unit 3 populations vocab
1/48
There's no tags or description
Looks like no tags are added yet.
Name | Mastery | Learn | Test | Matching | Spaced |
|---|
No study sessions yet.
49 Terms
generalist species
varied diet/range of tolerance
more adaptable because more likely to have things to eat
more likely to be invasive
often very competitive
specialist species
narrow range of tolerance/diet
more prone to extinction
population
A group of individuals of the same species living in a specific area at the same time, interacting and reproducing with one another.
K-selected
few offspring
lots of parental care
long lifespan
long time to sexual maturity = low biotic potential = slow population growth rate
more likely to be disrupted by environmental change/invasive species
r-selected
many offspring
little-to-no care
may reproduce only once
shorter lifespan
quick to sexual maturity = high biotic potential = high population growth rate
more likely to be invasive
better suited for rapidly changing environmental conditions
life span
The duration of time an individual organism lives, which can vary significantly among different species.
biotic potential
the maximum reproductive capacity of a species under optimal environmental conditions.
low: hard to recover pop. after disturbance (k-selected)
high: easier to recover pop. after disturbance (r-selected)
invasive species
non-native species that spread rapidly and cause harm to local ecosystems.
survivorship curve
a line that shows survival rate of a cohort in a population from birth the death
cohort
group of same aged individuals
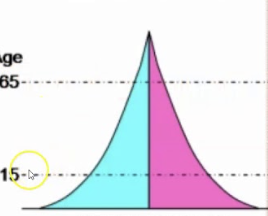
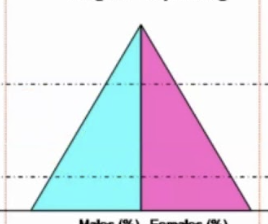
size (shape) indicates growth rate
larger 0-14: current and future growth (bc yet to have kids)
roughly equal 0-14 and 15-45: slight growth/stable (bc having only abt the same number of kids to replace them)
larger 15-45: population decline (bc having less than the number needed to replace them)
Type 1 curve
high survivorship in early life due to high parental care
high survivorship in midlife because of large size and defensive behavior
rapid decline in survivorship in later life as old age sets in
K-selected
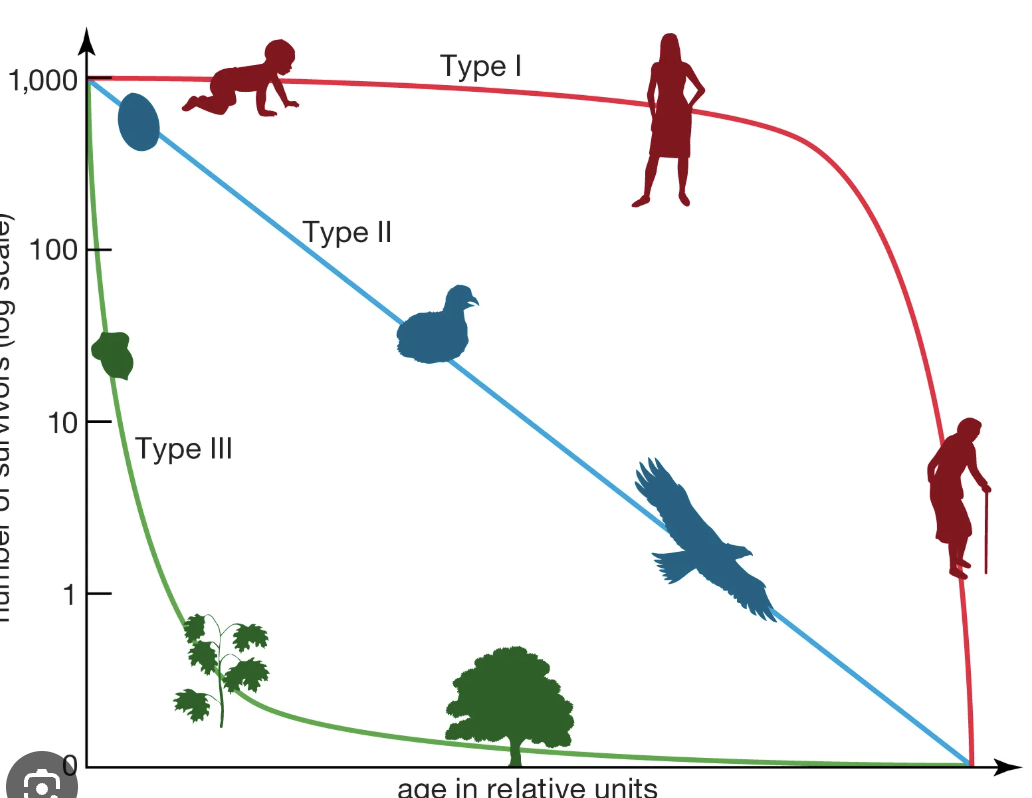
type 2 curve
steadily decreasing survivorship throughout life

type 3 curve
high mortality (low survivorship) early in life due to little-to-no parental care
few make it to midlife, slow and steady decline in survivorship in midlife
even fewer make it to adulthood

carrying capacity
the max. number of individuals in a population that an ecosystem can support (based on limiting resources)
exponential growth
A rapid increase in population size that occurs when resources are abundant, characterized by a J-shaped curve on a graph.
biotic potential = exponential growth
logistic growth
rapidly at first and then slowly as they approach carrying capacity and limiting factors come in, resulting in an S-shape curve
overshoot
when a population briefly exceeds carrying capacity
consequence: resource depletion
resource depletion
the exhaustion of essential resources due to overuse by a population, leading to a decline in available supplies for that population
population growth
the increase in the number of individuals in a population over time, influenced by birth rates, death rates, immigration, and emigration.
population decline
the decrease in the number of individuals in a population over time, often due to high death rates, low birth rates, or migration
resource availability
the accessibility and abundance of resources essential for supporting a population's needs and well-being
fecundity
the potential reproductive capacity of an individual or population, typically measured by the number of offspring produced.
total fertility rate (TFR)
average number of kids a woman in a population will have
higher = higher birth rate = population growth rate
replacement level fertility
the TFR required to offset deaths in a population and keep stable abt 2.1 in developed countries
higher in developing countries bc higher infant mortality
infant mortality rate (IMR)
number of deaths of kids under 1 per 1000 people in a population
higher = higher TFR (bc families having replacement kids)
higher in developing countries bc lack of access to food, healthcare, etc.
Malthusian theory
earths has a human carrying capacity limited based on food production
human population growth is happening faster than growth of food production
didn’t account for tech advancement
density-independent factors
tend to be abiotic
have an effect on populations regardless of size or density
natural disasters
doesn’t matter how big/small a population is natural disasters limit them
density-dependent factors
tend to be biotic
strong influence when number per unit are reaches a certain level
food, competition for habitat, water, light, disease
limit BASED ON SIZE
rule of 70
the time it takes (in yrs) for a pop. to double is equal to 70/growth rate
industrializing/developing
modernization brings access to clean water, healthcare, etc.
IMR and CDR decrease
TFR remains high bc lack of access of education for women and family planning
need for child labor (agricultural) decreases
generational delay (bc education and societal change take time)
rapid growth bc high CBR and decreasing CDR
shortish lives
pre-industrial economy
high IMR & death rate
bc lack access to basics and health care
high TFR bc lack of access to education for women and contraceptives
need for kids for agricultural labor
little to no growth bc high CBR and CDR balance
VERY few countries in this stage
industrialized economy
TFR declines
increased family income
more education for women
delayed age of 1st pregnancy and marriage
access to family planning and contraceptives
slowing growth rate bc CBR drops closer to CDR
long lives
low IMR
high literacy rate
post-industrial economy
highly modernized
affluent
TFR declines
more time for career and education
increased wealth
more use of family planning and contraceptives pushes age when 1st pregnant and how many kids had/needed
CBR drops lower than CDR and growth becomes negative
long lives
developed country
stage 3/4
lower TFR bc later age of 1st pregnancy, more education opportunities, more economic opportunities, less need for kids to provide income through agricultural labor, more access to family planning and contraceptives
developing country
stage 1/2
higher TFR due to earlier age of 1st pregnancy, limited education, and economic opportunities, reliance on agriculture, and less access to family planning and contraceptives.
limiting resource
limit pop. size (ex: food, water, habitat)
die-off/die-back
sharp decline in pop. size when resource depletion (overshoot) leads to many individual dying
size (N)
total number of individuals in a given area at a given time
larger = safer from population decline
population size
(immigrations + births) - (emigrations + deaths)
density
number of individuals per area
high density = higher competition, possibility for disease outbreak, possibility of depletion of food source
distribution
how individuals in a population are spaced out compared to others
random (trees)
uniform (territorial animals)
clumped (herd/group animals)
sex ratio
ratio of female to male
closer to 50:50: more ideal for breeding
die-off/bottleneck can lead to skewed sex ratio, limits population growth
rapid growth/stage 1 (pre-industrial)
slow growth/stage 2 (industrializing/transitional)

stable/stage 3 (industrialized)

declining/stage 4 (post-industrial)
growth rate
% increase in a population (usually per year)
r
(CBR-CDR)/10 = %/yr
crude birth rate (CBR)
births per 1000 ppl
crude death rate (CDR)
deaths per 1000 ppl