MKTG 465 10 - scale assessment
1/12
There's no tags or description
Looks like no tags are added yet.
Name | Mastery | Learn | Test | Matching | Spaced | Call with Kai |
|---|
No analytics yet
Send a link to your students to track their progress
13 Terms
according to churchill, what are the construct measures?
validity, reliability, dimensionality
validity includes what
face validity - judgement call by research
content validity - judgement supported by literature/studies
construct validity - discriminant and convergent
discriminant validity
the lack of association among
constructs that are purported to be different
convergent validity
the degree of association among
measures purporting to measure the same construct
reliability
repeatability, internal consistency, coefficient alpha
coefficient alpha (cronbach): alpha has to be ___ or higher to be reliable and not have too much ___
0.6, variance
multi-dimensional questions
questions have multiple dimensions
in a question about “attitude toward this class,” statements 1 - 4 are about course delivery and statements 5 - 8 are about course content
dimensionality: factor analysis
A statistical approach used to condense information contained in the original variables into a smaller set of variables with a minimum loss of information
⧫ A “cluster analysis” of similar variables
purpose of factor analysis
summarization and data reduction
explanation of factor analysis model
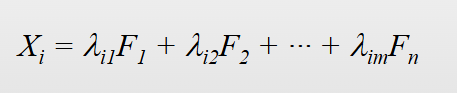
X (Observed variable): what you measured (your survey question/result)
F (Factor): the why behind the responses
λ): correlation, how strongly the question is connected to that why
e: error
a good survey will be/have:
multi item (multiple item statements), content validity (verified by academic sources), sensitive, reliable (alpha >= 0.6), and multidimensional (questions have more than 1 dimension)
sensitivity
how precise your scale is at picking up differences
A 2-point scale (Yes / No) → low sensitivity
A 7-point scale (Strongly disagree → Strongly agree) → high sensitivity
factor analysis - SPSS
only look at “rotated component matrix” charts, ignore others
X = individual questions, F = components, λ = the numbers
find the highest correlations (numbers) in each row, then for each column, find the correlations between the highest correlations.
ex: after finding highest correlations in each row, look at each column. for each highest correlation in the column, read the questions associated with them and determine what the main theme of those high correlations are.
after, take your main themes and create new columns in SPSS with them and run a reliability analysis on them.
look at the cronbach alpha = has to be 0.6 or higher to be reliable