Regression, Forecasting, and Data Mining in Business Analytics
1/106
There's no tags or description
Looks like no tags are added yet.
Name | Mastery | Learn | Test | Matching | Spaced | Call with Kai |
|---|
No analytics yet
Send a link to your students to track their progress
107 Terms
What is the primary purpose of regression analysis in business?
To build mathematical and statistical models that characterize relationships between a dependent variable and one or more independent variables.
What are the three major categories of forecasting approaches?
Qualitative and judgmental techniques, statistical time-series models, and explanatory/casual methods.
What does R-squared measure in regression analysis?
The measure of fit of the line to the data, ranging from 0 to 1; a larger value indicates a better fit.
What is a simple linear regression?
A regression model that involves finding a linear relationship between one independent variable and one dependent variable.
What is the difference between simple and multiple linear regression?
Simple linear regression involves one independent variable, while multiple linear regression involves two or more independent variables.
What is the purpose of residual analysis in regression?
To check the assumptions of regression and assess the model's accuracy by examining the differences between observed and predicted values.
What assumption must be checked regarding the residuals in linear regression?
Linearity, normality of errors, homoscedasticity, and independence of errors.
What is multicollinearity in regression analysis?
When two or more independent variables in the same regression model are highly correlated, making it difficult to isolate their effects.
What is the variance inflation factor (VIF)?
A measure used to estimate the degree of multicollinearity in regression analysis.
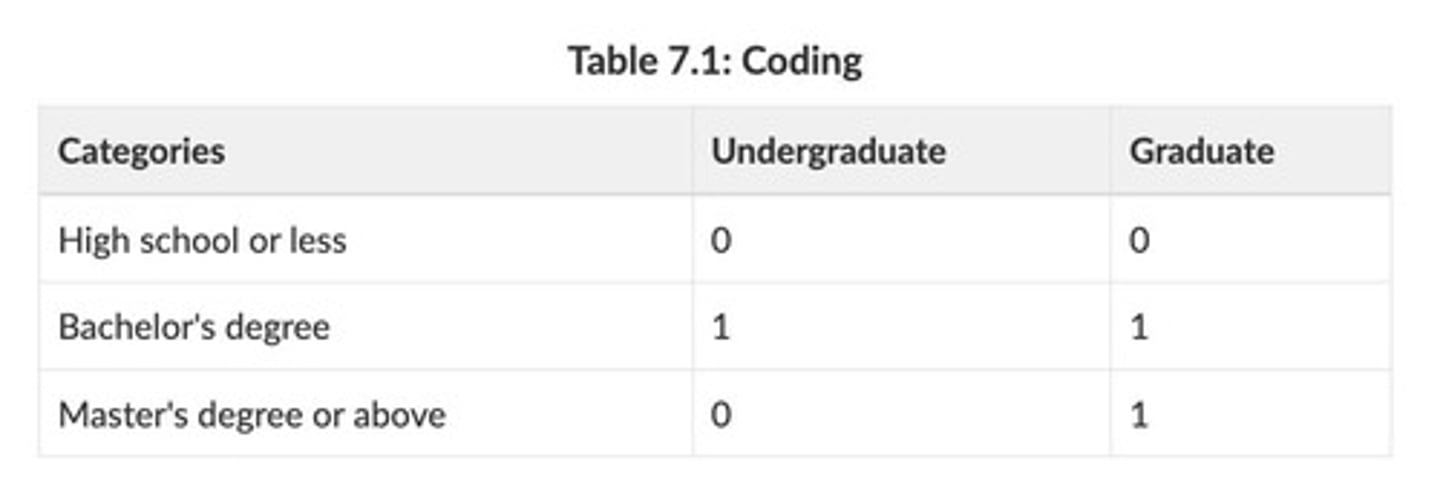
How can categorical independent variables be incorporated into regression models?
By transforming them into dummy variables for easier interpretation.
What is a time series in forecasting?
A stream of historical data used to predict future values based on past trends.
What are the four components of a time series?
Random behavior, trends, seasonal effects, and cyclical effects.
What is the Delphi method in qualitative forecasting?
A forecasting technique that uses a panel of experts responding to a sequence of questionnaires, with feedback shared after each round.
What is the purpose of trendline analysis?
To show the movement of data and model relationships between variables over time.
What is the least-squares regression method?
A technique that finds the best values of the slope and intercepts to minimize the sum of squares of the errors.
What is adjusted R-square?
A modified version of R-square that incorporates the sample size and the number of explanatory variables in the model.
What is a polynomial function used in predictive analytics?
A mathematical function of the form ax^2 + bx + c, used to model relationships in data.
What is the significance of the standard error in regression?
It measures the variability of the observed Y-values from the predicted values.
What is the purpose of building good regression models?
To ensure accurate predictions and reliable insights from the data being analyzed.
What does it mean if R-squared equals 1.0?
It indicates a perfect fit between the regression model and the data.
What is the role of trend analysis in business forecasting?
To identify patterns and trends in historical data to make informed predictions about future performance.
What is a curvilinear regression model?
A nonlinear regression model that is often used when the relationship between the independent and dependent variables is not linear.
What is the importance of checking for normality of errors in regression?
To ensure that the residuals are normally distributed, which is an assumption for many statistical tests.
What is the significance of the scatter diagram in regression analysis?
It helps to visually assess the linearity of the relationship between the independent and dependent variables.
What is the role of indicators in qualitative forecasting?
Indicators are measures believed to influence the behavior of a variable we wish to forecast.
What are cyclical effects in time series?
Cyclical effects are ups and downs over a much longer time frame, such as several years.
What characterizes a stationary time series?
Stationary time series do not have trend, seasonal, or cyclical effects but are relatively constant and exhibit only random behavior.
What are two techniques to forecast stationary time series?
Moving average and simple exponential smoothing.
What method is used to forecast time series with a linear trend?
Double exponential smoothing.
What methods are commonly used to forecast time series with seasonality?
Linear regression, Holt-Winters additive seasonality model without trend, and Holt-Winters multiplicative seasonality without trend.
Which models can be used to forecast time series with both seasonality and trend?
Holt-Winters additive seasonality model with trend and Holt-Winters multiplicative seasonality with trend.
What is the focus of data mining?
Data mining studies characteristics and patterns of data using statistical and analytical tools.
Name four common approaches in data mining.
Cluster analysis, classification, association, and cause-and-effect modeling.
What is cluster analysis?
Cluster analysis is a technique that groups a collection of objects into subsets or clusters, where objects in the same cluster are more similar to each other than to those in different clusters.
How is classification used in data mining?
Classification predicts how to classify a new data element, such as identifying fraudulent credit card transactions.
What does association analysis do?
Association analysis identifies natural associations among variables to create rules for target marketing or buying recommendations.
What is cause-and-effect modeling?
Cause-and-effect modeling develops analytic models to describe relationships between metrics that drive business performance.
What is the purpose of regression analysis in data mining?
Regression analysis helps predict relationships or future values of variables of interest.
What is the role of descriptive analytics in data mining?
Descriptive analytics helps identify patterns in data and predict future outcomes.
What is the significance of the Holt-Winters model?
The Holt-Winters model is significant for forecasting time series data that exhibit seasonality and trends.
What tools can be used for cluster analysis in Excel?
Excel can be used for simple cluster analysis through its data analysis tools.
What is the goal of conducting trendline analysis?
The goal of trendline analysis is to identify trends in data over time.
What does multiple linear regression analyze?
Multiple linear regression analyzes the relationship between two or more independent variables and a dependent variable.
What is the importance of regression assumptions?
Regression assumptions are important to ensure the validity of the regression model and its predictions.
What is qualitative forecasting?
Qualitative forecasting uses subjective judgment and opinion to make predictions about future events.
What is judgmental forecasting?
Judgmental forecasting involves making predictions based on expert opinions and insights.
What is the purpose of correlation analysis in data mining?
Correlation analysis helps identify the strength and direction of relationships between variables.
What is the significance of using Excel for data mining tasks?
Excel provides tools for analysis, visualization, and data manipulation, making it accessible for data mining tasks.
What is the outcome of effective data mining?
Effective data mining leads to better decision-making and improved business performance.
What is the relationship between customer satisfaction and contract renewal rates?
Understanding this relationship can lead to improved performance and retention strategies.
What should objects within clusters exhibit?
A high amount of similarity, while objects in different clusters should be dissimilar.
What is hierarchical clustering?
A clustering method where data are not partitioned into a single cluster in one step, but through a series of partitions.
What are agglomerative clustering methods?
A subdivision of hierarchical clustering that fuses n objects into groups, commonly used in clustering.
What are divisive clustering methods?
A subdivision of hierarchical clustering that separates n objects into finer groupings successively.
What is Euclidean distance?
A measure of distance between objects, extending the distance between two points on a plane.
What is single linkage clustering?
An agglomerative method that forms clusters from individual objects until only one cluster remains.
What is complete linkage clustering?
A method where the distance between clusters is defined as the distance between the most distant pair of objects from each cluster.
What is average linkage clustering?
A method where the distance between two clusters is defined as the average of distances between all pairs of objects from each group.
What is Ward's hierarchical clustering?
A clustering method that uses a sum-of-squares criterion.
What does a dendrogram visualize?
It visualizes different numbers of clusters at various stages of the clustering process.
What is classification in data mining?
The process of classifying a categorical outcome into one or more categories based on various data attributes.
What is a classification matrix?
A matrix that shows the number of cases classified correctly or incorrectly, assessing the effectiveness of a classification rule.
What does the k-nearest neighbors (k-NN) algorithm do?
It attempts to find records in a database that are similar to one we wish to classify.
What is discriminant analysis?
A technique for classifying observations into predefined classes based on predictor variables.
What is a cut-off value in discriminant analysis?
A rule for classifying observations using discriminant scores, determining group assignment based on a midpoint.
What is association rule mining?
A technique that uncovers interesting associations and correlation relationships among large sets of data.
What is market basket analysis?
An example of association rule mining that analyzes items purchased together in a transaction.
What does support for an association rule express?
The degree of uncertainty about an association rule, showing the number of transactions that include all items in the rule.
What is confidence in association rules?
The ratio of transactions that include all items in the consequent to those in the antecedent.
What is lift in association rules?
The ratio of confidence to expected confidence, indicating the increase in probability of the consequent given the antecedent.
What are lagging measures?
Outcomes that tell what has happened, often external business results like profit or customer satisfaction.
What are leading measures?
Performance drivers that predict what will happen, usually internal metrics like employee satisfaction.
What are the four common approaches in data mining?
Cluster analysis, classification, association, and cause-and-effect modeling.
What is the purpose of cause-and-effect modeling?
To develop analytic models that describe the relationship between metrics that drive business performance.
What is the goal of what-if analysis?
To evaluate future scenarios and answer questions regarding potential outcomes.
What is Monte Carlo simulation?
A technique used to understand the impact of risk and uncertainty in prediction and forecasting models.
What is a data table in Excel?
A data table is a range of cells that shows how changing one or two variables in your formulas will affect the results.
What is what-if analysis?
What-if analysis is a process of changing the values in cells to see how those changes will affect the outcome of formulas on the worksheet.
What is a Monte Carlo simulation?
Monte Carlo simulation is a technique used to understand the impact of risk and uncertainty in prediction and forecasting models.
What are the three strategies for building models?
1. Using logic and business principles, 2. Using influence diagrams, 3. Using historical data.
What is verification in spreadsheet engineering?
Verification is the process of ensuring that a model is accurate and free from logical errors.
What are descriptive spreadsheet models focused on?
Descriptive spreadsheet models focus on understanding the past.
What do predictive spreadsheet models aim to do?
Predictive spreadsheet models focus on understanding the future.
What is the focus of prescriptive spreadsheet models?
Prescriptive spreadsheet models focus on identifying the best solution.
What is a random variate?
A random variate is a value randomly generated from a specified probability distribution.
What is a feasible solution in optimization?
A feasible solution is any solution that satisfies all constraints of a problem.
What is the objective function in optimization models?
The objective function is the function that needs to be maximized or minimized in an optimization problem.
What are decision variables in optimization models?
Decision variables are the unknown values that the model seeks to determine.
What is a binding constraint?
A binding constraint is a constraint that holds as an equality at the optimal solution.
What is an unbounded solution in optimization?
An unbounded solution occurs when the value of the objective can be increased or decreased without bound without violating any constraints.
What does the Solver Answer Report provide?
The Solver Answer Report provides basic information about the solution, including the values of the original and optimal objective function and decision variables.
What are the four possible outcomes when solving a linear optimization model?
1. Unique optimal solution, 2. Alternative optimal solutions, 3. Unbounded solution, 4. Infeasibility.
What is the purpose of the Scenario Manager in Excel?
The Scenario Manager allows users to create and manage different scenarios for data analysis.
What is Goal Seek in Excel?
Goal Seek is a tool that allows users to find the input value needed to achieve a specific goal in a formula.
What is the first step in the Monte Carlo simulation process?
Develop the spreadsheet model.
What is the second step in the Monte Carlo simulation process?
Determine the probability distribution.
What is the third step in the Monte Carlo simulation process?
Identify the model output.
What is the fourth step in the Monte Carlo simulation process?
Determine the number of trials for the simulation.
What is the fifth step in the Monte Carlo simulation process?
Create a data table to summarize the values of the model output for the replications.
What is the sixth step in the Monte Carlo simulation process?
Compute summary statistics, percentiles, confidence intervals, frequency distributions, and histograms to interpret results.