Stats 301 Exam 1 Review
1/88
There's no tags or description
Looks like no tags are added yet.
Name | Mastery | Learn | Test | Matching | Spaced | Call with Kai |
|---|
No analytics yet
Send a link to your students to track their progress
89 Terms
Defining Statistics
Set of tools & techniques used to describe, organize, and interpret data
Goals of science & how stats helps achieve those
Sats helps describe, predict, and explain data
Descriptive Stats
Organize and describe data
Inferential Stats
Infer (guess) something about a larger group (population) from smaller groups (sample)
What is a sample?
A portion or subset OF the population
What is a population?
The overarching group you are studying (large)
What is a variable in stats?
Something that can change (vary) or have different values for different individuals
EX: Age, Major, etc
What is data in stats?
Information collected from the sample on the variables we are interested in (actual numbers & measurements & characteristics)
EX: Engineering, psych, business OR 18,19,20,21, etc
What is continuous data?
variables that can assume any value along some underlying continuum.
EX: height, weight, time
What is categorical data?
a variable that can take on one of a limited, usually fixed, number of possible values.
EX: political affiliation, marital status, and education level
What is central tendancy?
a statistical measure that identifies an (average value) in a data distribution
EX: mean, median, and mode
What is the mean and how do you calculate it?
The AVERAGE of the data
most sensitive to outliers
best used when there are NO extreme values in the data set
How to calculate:
x bar = sum of x over n
What is the median and how do you calculate it?
The MIDDLE number in a data set
NOT sensitive to extreme values
Use when extreme values ARE present
How to calculate:
Put data in numerical order
If an odd number of values, find the value in the center
OR
If even number of values, find the two values in the center, add them, and divide by 2.
What is the mode, and how do you calculate it?
The MOST FREQUENT occurring value in the data set
typically used in CATEGORICAL data
you CAN have multiple in the data set (bi-multi)
LEAST precise and LEAST affected by extreme values
How to calculate:
put values in numerical order
identify the MOST occurred value
if 2 values appear, they are BOTH modes of the data set
When to use which measure of central tendency?
3 Rules
Use mode when data is CATEGORICAL
Use mean when the data is CONTINUOUS and NO outliers
Use median when the data is CONTINUOUS and you think to mean is misleading because of extreme scores
When in doubt, report BOTH!
What are the extreme values for mean, median, and mode
Mean = DON’T use for extreme values
Median = can use for extreme values
Mode = can use for extreme values
What is the measure of Variability?
Tells us how DIFFERENT the scores are from each other.
represent the spread or dispersion in the dataset
Why is variability important?
helps us understand the nature of our SAMPLE and the nature of our VARIABLES
What are the 3 measures of variability?
Range
Standard Deviation
Variance
What is range and how do we calculate it?
The DIFFERENCE between the highest and lowest score of a data set
only considers MOST EXTREME values
not very accurate
How to calculate:
Range = h - l
What is standard deviation and how do we calculate it?
The AVERAGE distance scores are from the MEAN
The most commonly used measure of variability
SMALLER stand dev. means scores are closer to the mean
LARGE stand dev. means scores are further away from the mean
How to calculate:
Sigma (x-xbar) = single deviation
Sigma (x-xbar) squared = sum of ALL squared deviations
What is variance and how do we calculate it?
The standard deviation SQUARED
rarely used to report descriptive stats
more used as a concept
How to calculate:
Variance = SD ²
What are the important Standard Deviation concepts?
By def. the average of the deviations is ZERO (assuming normal distribution)
^ we must square the deviations
Values are squared so that they do NOT cancel each other out
SD is sensitive to extreme values
We use the sq root to REVERT back to original units
What is an outlier or extreme value?
A data point that appears to deviate markedly from other data points in the sample
What is the rule of thumb for outliers and extreme values?
Anything more than two standard deviations away from the mean is a potential outlier.
Anything more than three standard deviations away from the mean is likely an outlier.
Formula to calculate outliers
x bar +- ( c cut off value x s standard deviation)
How do you use standard deviation to understand an individual data point?
determine how far the point deviates from the mean (avg) of the dataset comparing it to the overall data spread
calculate the mean and standard deviation
find the “z” score and use the outlier identification formula
What is a “Z” score aka standard score?
The raw scores that have been adjusted for the mean and standard deviation of the distribution from which the raw scores came.
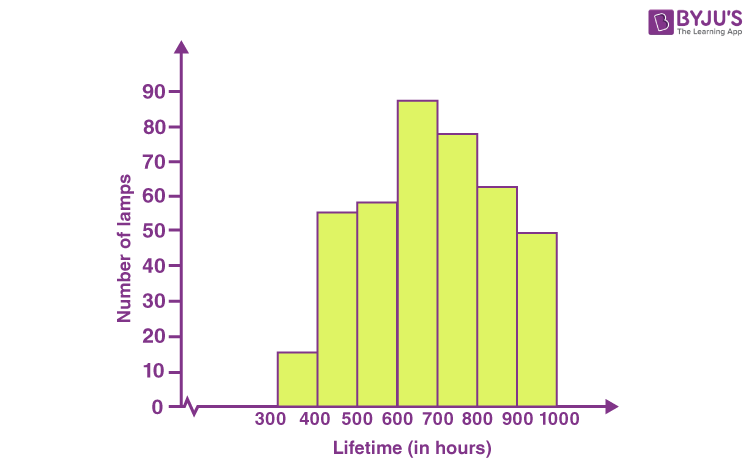
What are histograms and how do you identify them?
They show distributions of continuous variables
The height of the bar is the number of times that value occurs
The bars touch on the graph
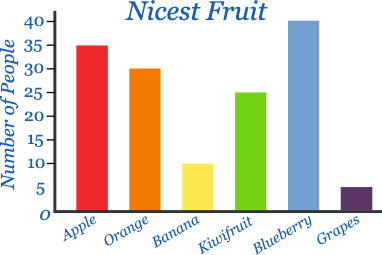
What are bar graphs and how do you identify them?
They show the frequency of categorical responses
The bars have spaces in between them on graph
How is central tendency described as a distribution?
Mean, median, and mode differ in central tendency but do not differ otherwise
all 3 m’s would be the same in each of the symmetrical distributions
aka the same variability, different average
How is variability described as a distribution?
Can have the same central tendency - but different amounts of variability
Some can have the same range but different standard deviations
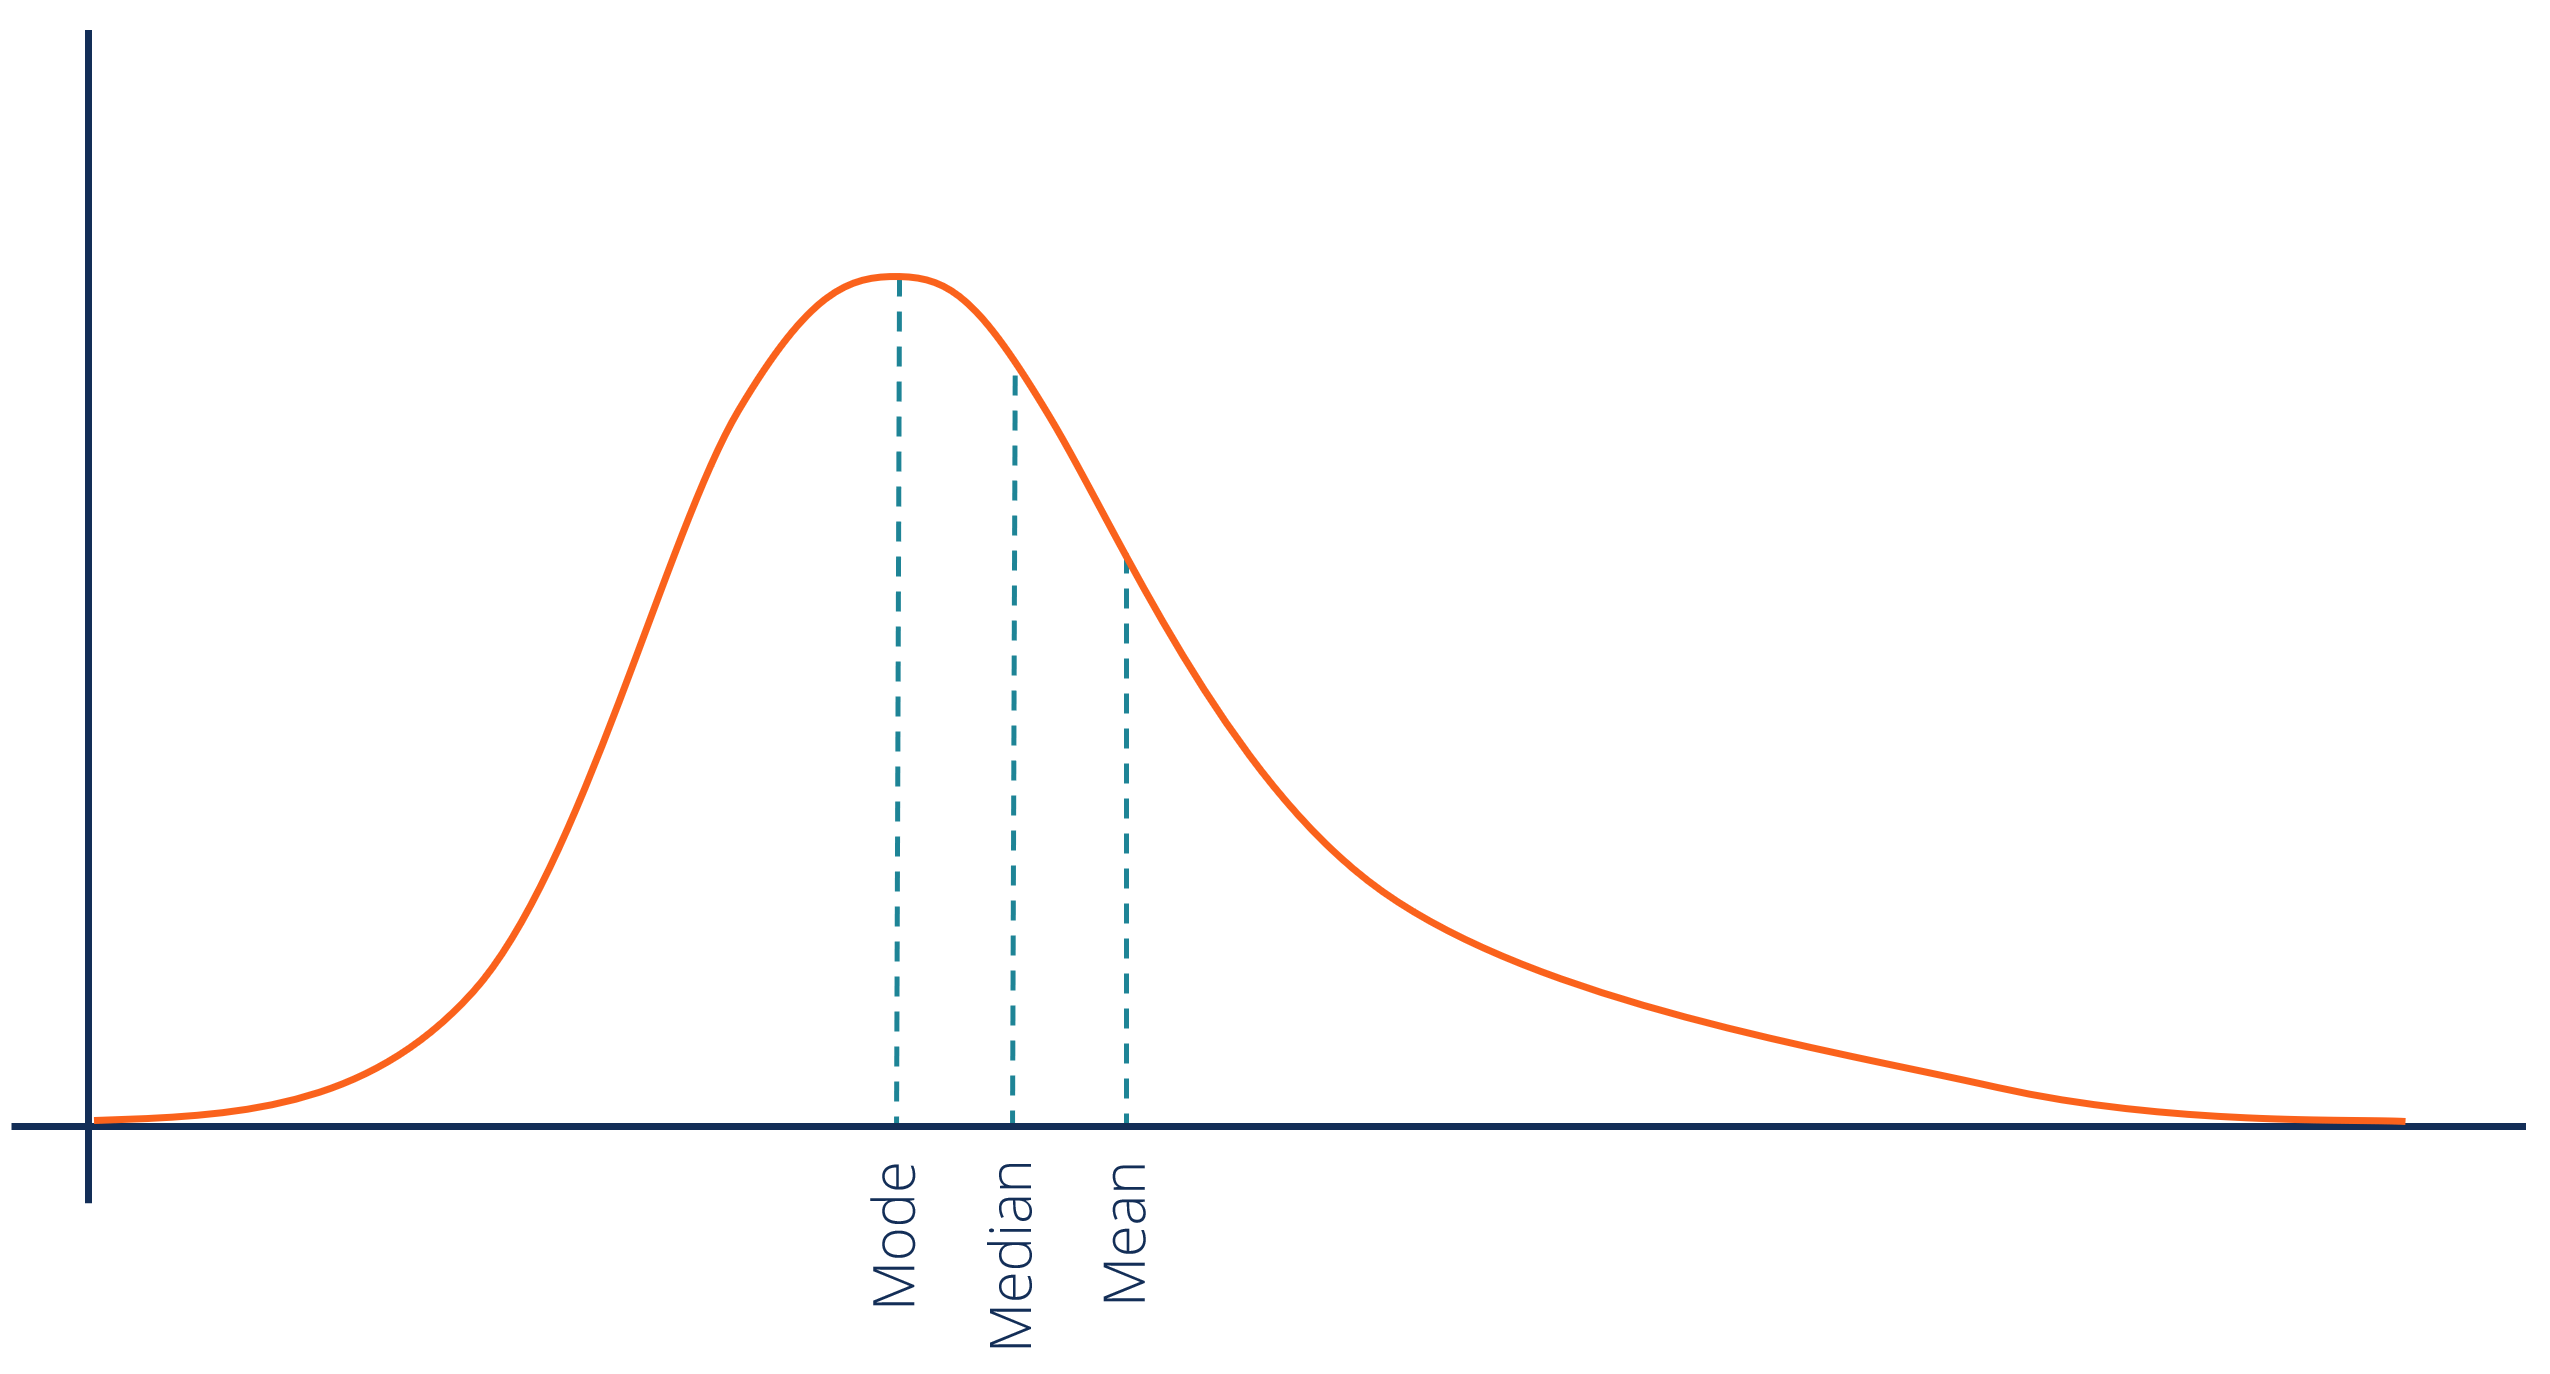
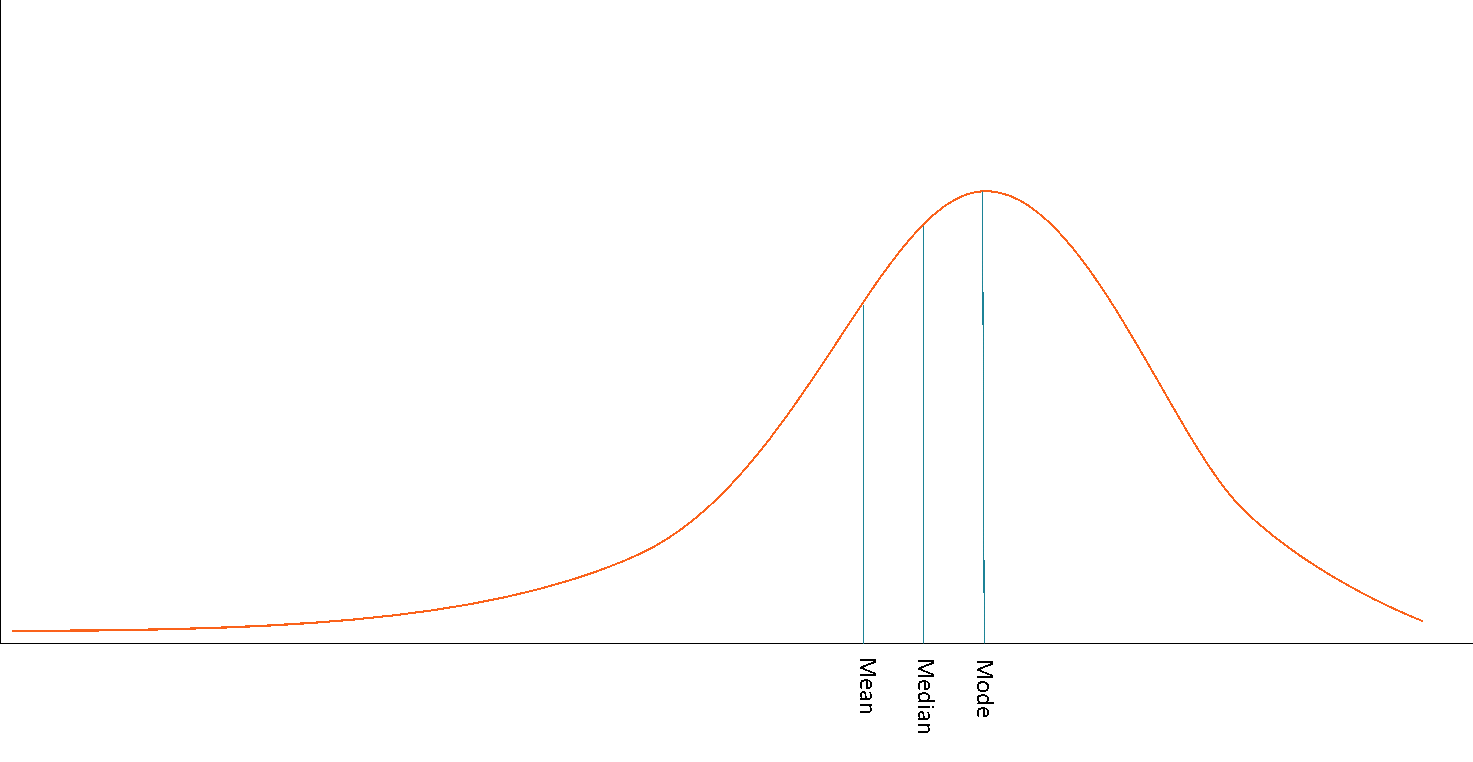
What is skewness and how is it described in a distribution?
The lack of symmetry in a graph
What is a positive skew and which way does the tail face
When the curve's tail is on the right side of the graph.
Mode is the highest on left side
The median is typically in the middle
Mean is the lowest on right side
What is a negative skew and which way does the tail face?
When the tail curve is typically on the left side of the graph
Mode is the highest on the right side
The median is in the middle
Mean is on the left side
What does skewness reflect about the mean, median, and mode?
Reflects the relation between one another
What is the floor effect?
When there is a bottom bound for the values of a data set. MUCH of the data falls around the BOTTOM bound.
creates a positive skew!
majority values fall on the LOW end of the distribution
What is the ceiling effect?
When there is an upper bound for the values of the data set
Creates a negative skew
majority of the values fall at the HIGH end of the distribution
What is kurtosis?
How peaked vs flat the distribution is
What is platykurtic?
LOW kurtosis
relatively FLAT
HIGH variability
What is leptokurtic?
HIGH kurtosis
relatively PEAKED
LOW variability
What can make graphs misleading?
This can occur when visual reprensations are off and distortions are created with manipulation of axes, scales, and more
What are correlations?
How changes in one variable relate to changes in another variable
THE RELATIONSHIP BETWEEN TWO VARIABLES
When do we use correlations?
They are used when you want to quantify the strength and direction of a liner relationship between two continuous variables
What is a correlation coefficient?
a single number that describes the relationship between two variables
How is correlation coefficient abbreviated, and what does it range from?
Abv. as “r”
Ranges from -1 to 1
What is direction in correlation coefficient?
The sign of the coefficient tells us in which direction one variable is to the other
What is the relationship of a positive coefficient?
DIRECT relationship
as x increases, y increases
What is the relationship of a negative coefficient?
INVERSE relationship
as x increases, y decreases
What is strength of a correlation coefficient?
The closer the coefficient is to -1 or 1, the stronger the relationship is
What are scatterplots in relation to correlations?
A chart or graph that uses dots to represent values for two different numeric values
What is an important idea to remember about correlation coefficient?
Correlation does NOT equal causation. Just because two variables are closely related, does not mean that one causes the other.
Understand the chart of correlation relationships

Understand scatter plots and correlation examples

What are the limitations of correlation coefficients?
Can only be used to identify LINEAR relationships
NO curvilinear relationships
Restriction of range
What is the restriction of range?
When there are too many scores that have similar values for a variable, the coefficient cannot capture the true relationship.
Do outliers have a significant effect on correlation coefficents?
YES! They have a huge impact on correlation co.
What is the coefficient of determination? And how do we calculate it?
The representation of how much variance two variables share
how much x can be accounted for y (vise versa)
How to calculate it?
simply square the coefficient! r²
How do we calculate/compute the correlation coefficient?
The formula used:

rxy = the correlation between x and y
n is the sample size
X is each individual's score on the X variable
Y is each individual’s score on the Y variable
XY is the product of each X score times its corresponding Y score
X2 is each individual's X score squared
Y2 is each individual’s Y score squared
What are the numerator and denominator relationships when computing a correlation coefficient?
numerator = how much do x and y go together
denominator = how much do x and y vary on their own
What is an example on how to report a correlation coefficient?
We found a strong or weak negative/positive correlation between ——- and ——- (r=). Suggesting that…..
What is coefficient of determination?
The more two variables have in common, the more variance they share
What is coefficient of determiination?
The variance that is left over after calculation
What is a correlation matrix?
A simple way to report a bunch of correlations at one time
What is r² and how do you calculate it?
This is known as the coefficient of determination and is calculated by squaring the value of r.
What is important to remember about correlation vs causation?
Correlation does NOT equal causation
we can NEVER definitively assume causation from a correlational relationship
What is reverse causation?
The causal direction may be opposite from what has been hypothesized
What is reciprocal causation?
When two variables cause each other
spiral effect
What are measures in reliability and validity?
the act or process of assigning numbers to phenomena according to a rule.
What are the 4 measurement scales from least to most precise?
Nominal Scale: measure split into categories. A person cannot be in more than one category. Data is presented as counts or percentages.
Ex: hair color, political affiliation
Ordinal Scale: categories are ranked in a hierarchy.
Ex: class ranking
Interval Scale: ranked continuous variables, with equal spacing (intervals) between values
Ex: 1-5 strongly agree to strongly disagree
Ratio Scale: similar to interval, but has a true zero value.
0= complete absence of the attribute
What is an independent variable?
Something that can be manipulated or changed in an experiment.
Ex: the amount of water used
What is a dependent variable?
What you measure/observe as a result of change
Ex: how much the plants had grown
What is reliability?
a measure that is consistent in the values it outputs
What is validity?
the measure is actually measuring what you intended to measure
What is a key note to remember about reliability and validity.
A measure can be reliable and NOT be valid.
But a measure cannot be valid and NOT be reliable.
What is the idea of garbage in, garbage out?
if the data you collected is based on invalid or unreliable measure, your results will be useless.
What is the goal for reliability and validity/ overall stats and testing?
MINIMIZE the error!
What is an observed score?
the ACTUAL score a person receives
What is a true score?
the theoretical score representing a persons actual ability or trait without measurement errors. (aka the perfect score)
What is an error score?
AKA measurement error, the discrepancy between observed and true score.
What are the types of reliability?
Test-retest: does a person receive the SAME score when they complete the measure at two different points in time?
Parallel test forms: are different versions of the same measurements equivalent?
Internal consistency: do all items in a measure assess the same concept you are trying to measure? Is there a strong correlation between individual items and total scores?
Chronbachs Alpha ^:
Inter-rater: does the measure produce the same results regardless of who is grading the scale? Can be evaluated by looking at the correlation between raters.
What is important to remember about test-retest and parallel forms?
both can be measured using correlation
the CLOSER the coefficient is to 1, the more reliable the measure is.
What is Cronbachs Alpha in relation to internal consistency?
a stat that reflects the degree of internal consistency of items. Should always be from ZERO to ONE. The closer to 1, the better.
How to improve cronbachs alpha?
Increase # of items in the survey
properly format instructions
make sure the admin of the measure is standardized
remove unclear or confusing items
Can validity be assessed with stats?
NO.
requires theory, critical thinking, and lots of data
What are the 3 types of validity?
Content: does the measure cover ALL of what we are trying to measure?
Criterion: does the measure predict other indicators of the same construct?
Construct: is the measure related to things it shouldn’t be and is it not related to things it should? Does it measure the underlying concept you set out to measure? Requires psychological theory
What are concurrent and predictive validity within criterion validity?
Concurrent validity: do the measures taken correlate with pre-existing measures that have already been validated?
Predictive validity: the ability of the measure to predict outcomes in the future.
What are convergent and discriminant validity within construct validity?
Convergent validity: does the measure relate to things that it should?
Construct validity: does the measure NOT relate to things that it should?