Lab ES | Unit 7a - Marine Biomes and Water Pollution
1/54
There's no tags or description
Looks like no tags are added yet.
Name | Mastery | Learn | Test | Matching | Spaced |
|---|
No study sessions yet.
55 Terms
Aquatic biomes
Categorized by salinity, temperature, and amount of sunlight.
Types of aquatic biomes
The two major categories are freshwater and saltwater (marine).
Freshwater biomes
Include lakes, rivers/streams, and wetlands.
Saltwater/Marine biomes
Include oceans and estuaries.
Estuary
The location where a freshwater river or stream meets the ocean, creating a place where fresh and salt water mix due to the tides.
Difference in salt concentrations
Marine biomes have a 3% concentration, while freshwater biomes have a 0.1% concentration.
Earth's surface coverage by biomes
Marine biomes cover around 97% of Earth's surface, while freshwater makes up less than 3% of Earth's water supply.
Intertidal zone
Occurs at the transition between land and sea, where organisms can tolerate a wide range of water levels and varying levels of air exposure.
Adaptations of intertidal organisms
Organisms can attach to a substrate to avoid being carried away by tides.
Examples of intertidal organisms
Include urchins, sea stars, and anemones.
Primary productivity
The rate at which sunlight is converted into organic compounds through photosynthesis.
Net primary productivity
The amount of organic matter produced by photosynthetic organisms after accounting for their respiration rates.
Net primary productivity formula
Net primary productivity = gross primary productivity - cellular respiration.
Global photosynthesis in oceans
Almost half of global photosynthesis occurs in the ocean and is completed by phytoplankton.
Open ocean primary productivity
The open ocean, which covers 65% of earth, accounts for very little of Earth's primary productivity.
Algal beds and coral reefs
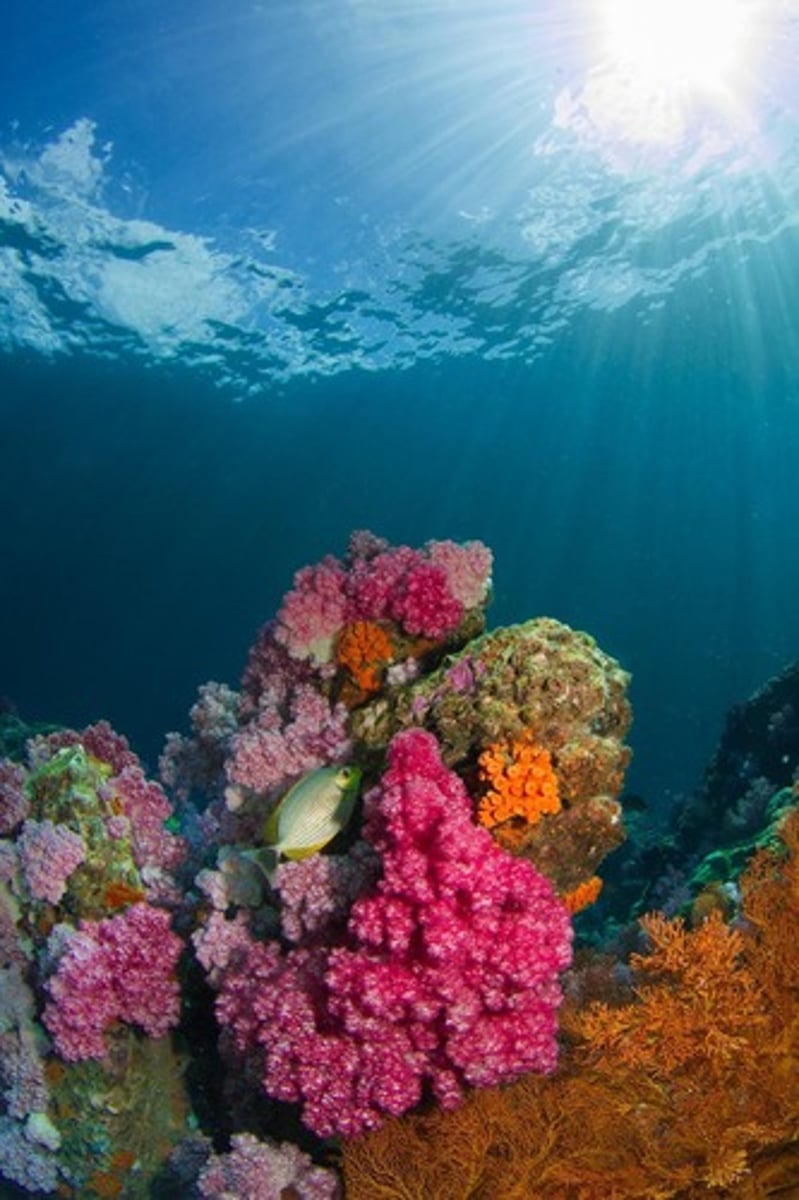
Only 0.1% of Earth's surface is comprised of these areas, but they have the most primary productivity on Earth.

Marine species in algal beds and coral reefs
25% of all marine species are found in these areas.

Euphotic zone
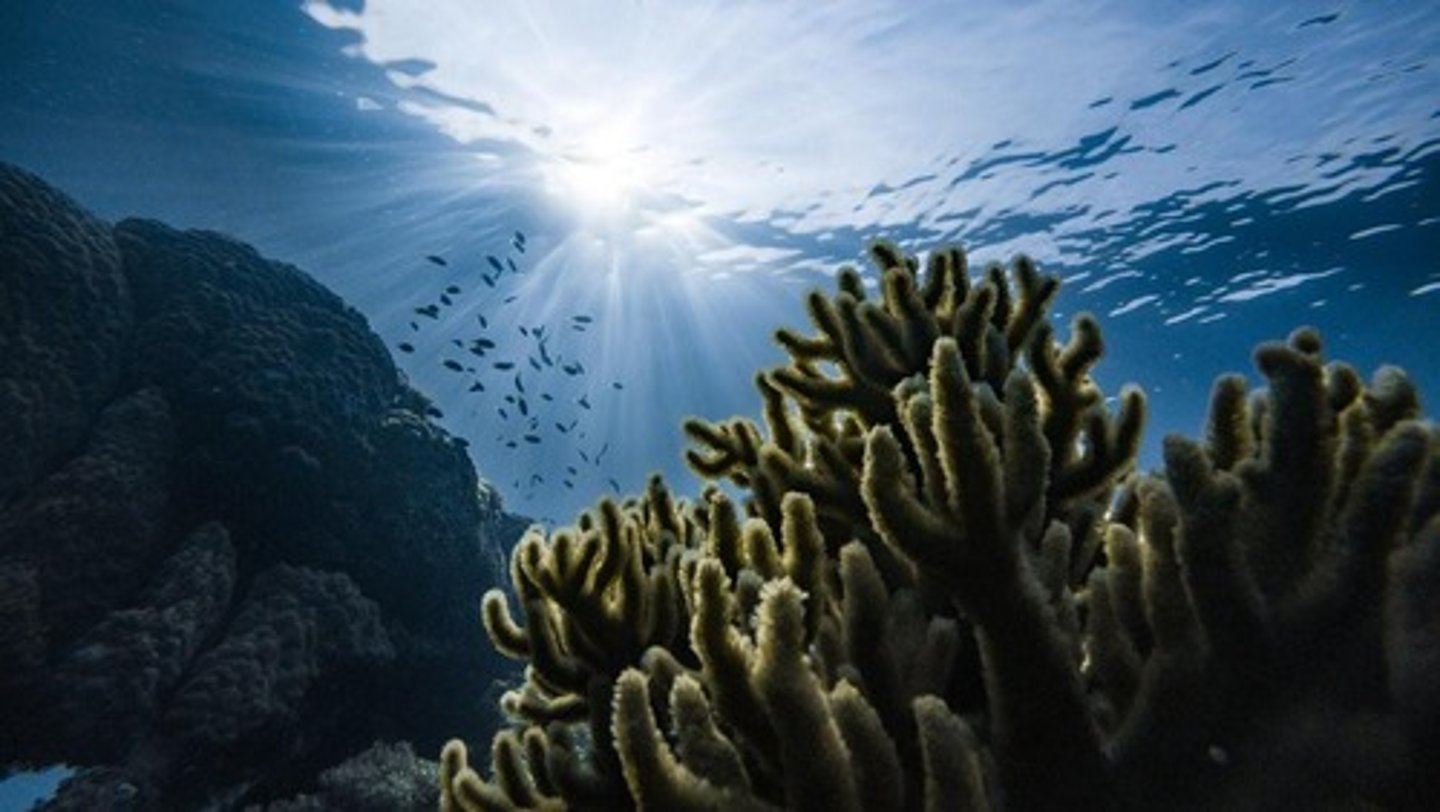
The part of the ocean where sunlight is able to penetrate the water, going to around 200 m deep.
Phytoplankton in the euphotic zone
Found in this zone, they control the populations and distribution of all other organisms.
Nutrient limitation for phytoplankton
Phytoplankton have plenty of light in the euphotic zone but are limited by nutrients in the ocean.
Water mixing in the euphotic zone
The warmer water often doesn't mix with the denser, colder water below it, restricting nutrient flow except in specific areas of upwelling.
Thermocline
A thin layer in the water where temperature changes quickly, dividing the upper layer of water from the lower layer.
Conditions affecting ocean productivity
Factors such as lack of thermoclines, sunlight for nutrient flow, Coriolis effect, upwelling, and nutrient availability at river mouths.
Impact of climate change on ocean productivity
Increased temperatures in the Southern Ocean cause greater thermoclines, reducing nutrient upwelling and potentially leading to more ocean desert areas.
Phytoplankton
Organisms that complete almost half of global photosynthesis, primarily in areas like coral reefs.
Water pollution categorization by source
1. Point source pollution - can be traced back to a specific point. 2. Non-point source pollution - an aggregate of pollution from a large area.

Point source pollution
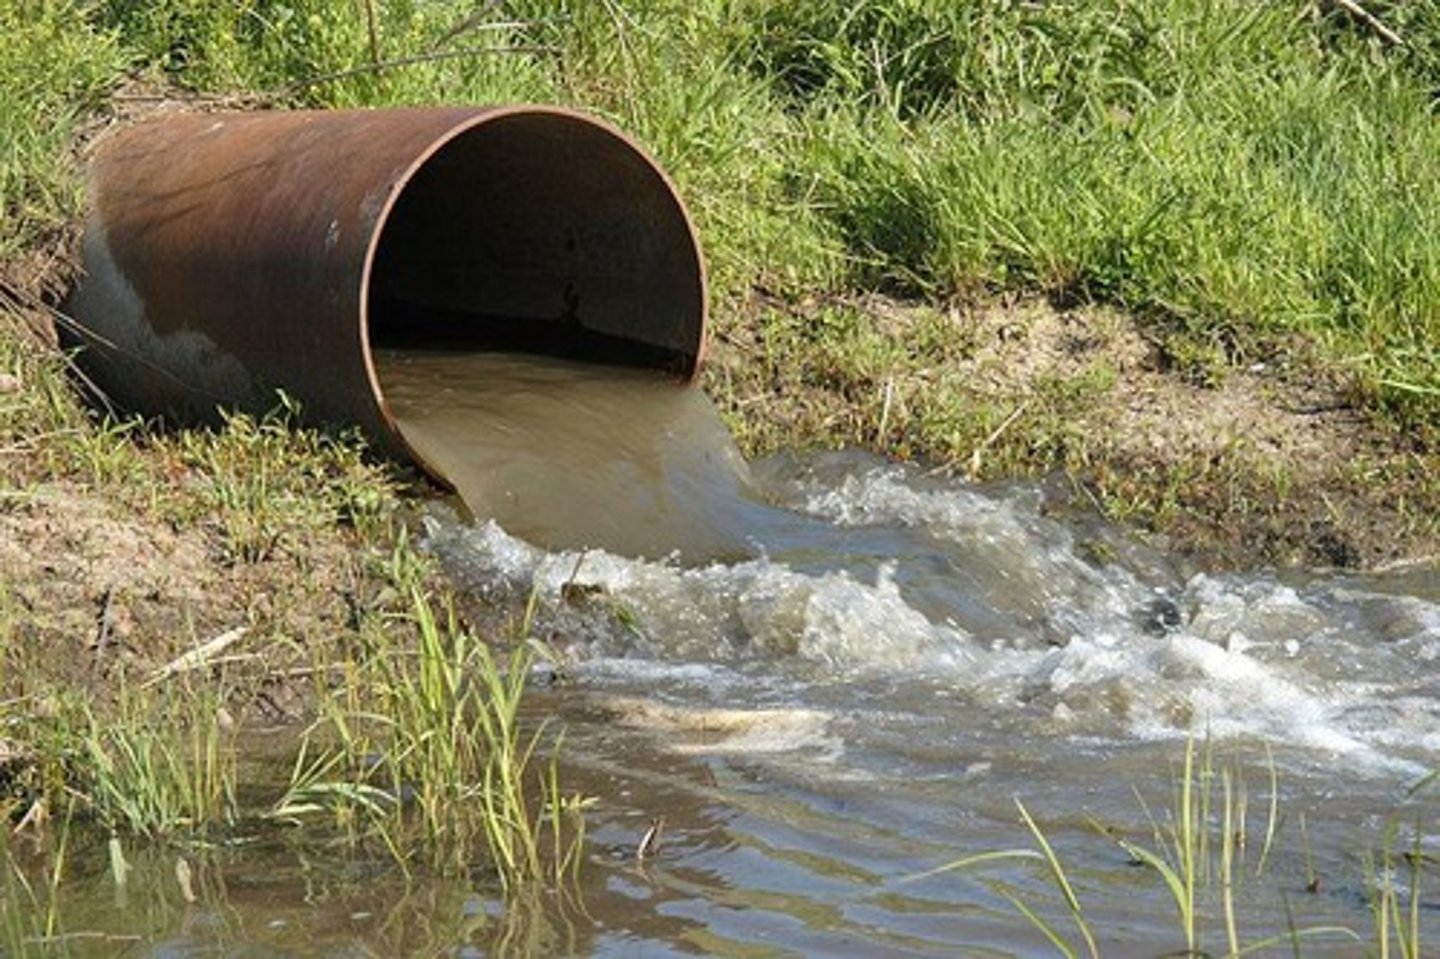
Pollution that can be traced back to a specific point, such as a discharge pipe or treatment plant.
Non-point source pollution
An aggregate of pollution from a large area, such as farms or parking lots.
Water pollution categorization by composition
Major categories include nutrient pollution, thermal pollution, sediment pollution, biological pollution, and chemical pollution.
Nutrient pollution
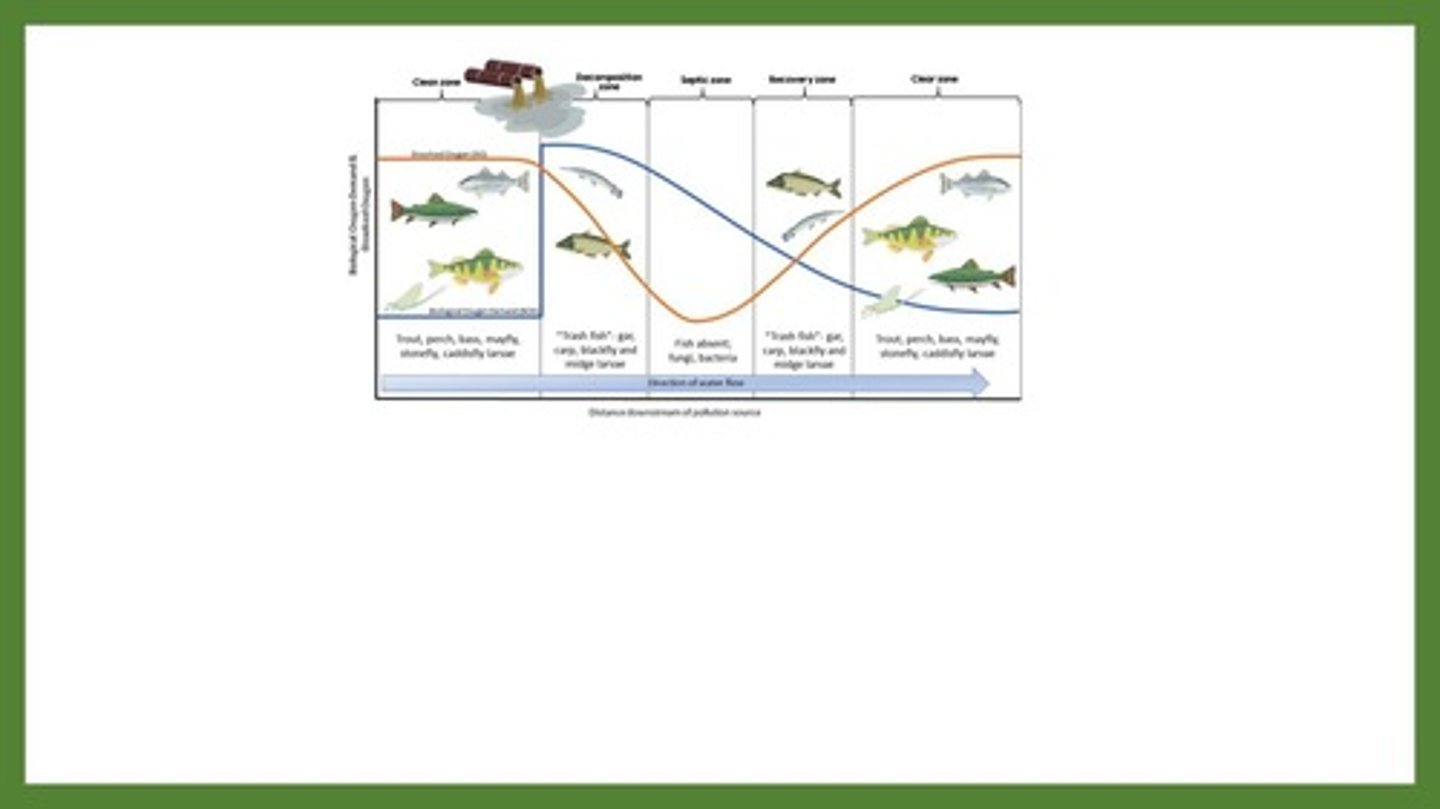
Pollution that affects water quality by causing an oxygen sag curve, leading to reduced biodiversity in aquatic organisms.
Oxygen sag curve
A graph showing how biological oxygen demand and dissolved oxygen are affected by the addition of pollution.

Thermal pollution
Pollution that decreases dissolved oxygen levels due to warmer water holding less dissolved gases.
Contributors of thermal pollution
Power plants using water as coolants and urban runoff from areas with little shade.
Sediment pollution
Pollution caused by loose soil, sand, silt, and clay that can reduce light penetration and disrupt benthic habitats.
Causes of sediment erosion
Natural erosion by wind or water, accelerated by land uses like agriculture and construction.
Impact of sediment on aquatic ecosystems
Added sediment can reduce light penetration and disrupt habitats at the bottom of water bodies.
Biodiversity recovery
As nutrients are consumed by microorganisms and diluted over time, dissolved oxygen will rebound and biodiversity will recover.
Biological Pollution
The presence of pathogens such as bacteria and viruses in the water supply.
Causes of Biological Pollution
Primarily caused by contamination of drinking water by human and animal waste.
Impact of Biological Pollution
Causes the most human health problems of any type of pollution.
Regions Affected by Biological Pollution
Majority of issues are in South Asia and Africa from the lack of wastewater treatment.
Chemical Pollutants
Examples include pesticides, heavy metals, industrial solvents, and petroleum.
Effects of Chemical Pollution
These chemicals affect surface water and can infiltrate groundwater supplies affecting drinking water.
Persistent Organic Pollutants (POPs)
Many chemical pollutants that do not easily break down in the environment.
Bioaccumulation
When animals ingest POPs, they are absorbed into fatty animal tissue because they are fat-soluble.
Biomagnification
The process where POPs are concentrated through the food chain, leading to much higher levels in top predators.
Bioassay
A test used to determine the effect that a chemical or pollutant has on a living organism.
LD50
The lethal dose 50%, which is the amount of a chemical that will kill 50% of the population of that organism.
Wetlands
Areas that must have water present at least part of the year, hydric soils, and hydrophytic vegetation.
Importance of Wetlands
They provide water retention, reduce erosion, and filter waterborne pollutants.
Wetlands and Carbon Sequestration
Anoxic soils slow the decomposition of organic matter, causing carbon to build up in the wetlands.
Vegetation in Wetlands
Fixes atmospheric carbon through photosynthesis.
Gases Released from Disturbed Wetlands
Carbon is released because the organic matter is allowed to receive oxygen to decompose.
Wetland Mitigation
The process of creating, enlarging, or preserving wetlands due to human impacts.
Benefits of Wetlands
Prevent erosion and filter pollutants while holding on to carbon and reducing atmospheric carbon.