5.6 Production planning
1/84
There's no tags or description
Looks like no tags are added yet.
Name | Mastery | Learn | Test | Matching | Spaced | Call with Kai |
|---|
No analytics yet
Send a link to your students to track their progress
85 Terms
Production planning
Management process of ensuring sufficient inputs are available to create outputs
In a timely manner to meet customer needs
Supply chain
Diff stages of activities from production of product → distribution to end customer
Network of the individuals, firms, resources, business operations, technologies involved in the creation and sale of a particular good
Supply chain management
The art of managing + controlling the sequence of activities from the production of a product to delivery to final customer.
Must be efficient + effective → firm can be profitable
Work w suppliers to maximise efficiency
Local supply chain
Short distances betw producers, suppliers, consumers
In a confined location eg same city
Efficient: less time, transport → good for environment, less prone to distruption
Shorter supply chain
Global supply chain
Long distance (spans multiple countries) betw firm, supplier, consumers
Transactions on international level (eg trade)
Cost effective (offshore production)
Bad impact on environment, less sustainable
What do MNCs rely on to increase customer base + profits?
Global supply chain
Why is a long supply chain / ineffective SCM expensive?
Increases chance of:
Miscommunication
Late deliveries
So reshoring has become popular (less risk of long supply chain)
Main parts of SCM
Stock control
Quality control
Supplier networks- eg intermediaries
Transport networks
Pros of using SCM
Prevents mistakes that occur in long supply chains
Helps w stock control (prevents stockpiling → too much liquidity tied, or insufficient stock → delays)
Helps achieve lean production
Global supply chain → spread risks (eg if natural disaster in 1 country)
Global SC → easier for firms to sell around the world
Cons of using SCM
GSC: time, lang, cultural differences → miscommunication + delay
GSC: greater interdependence → single problem causes major issues (increased chance in GSC)
Need more time + resources
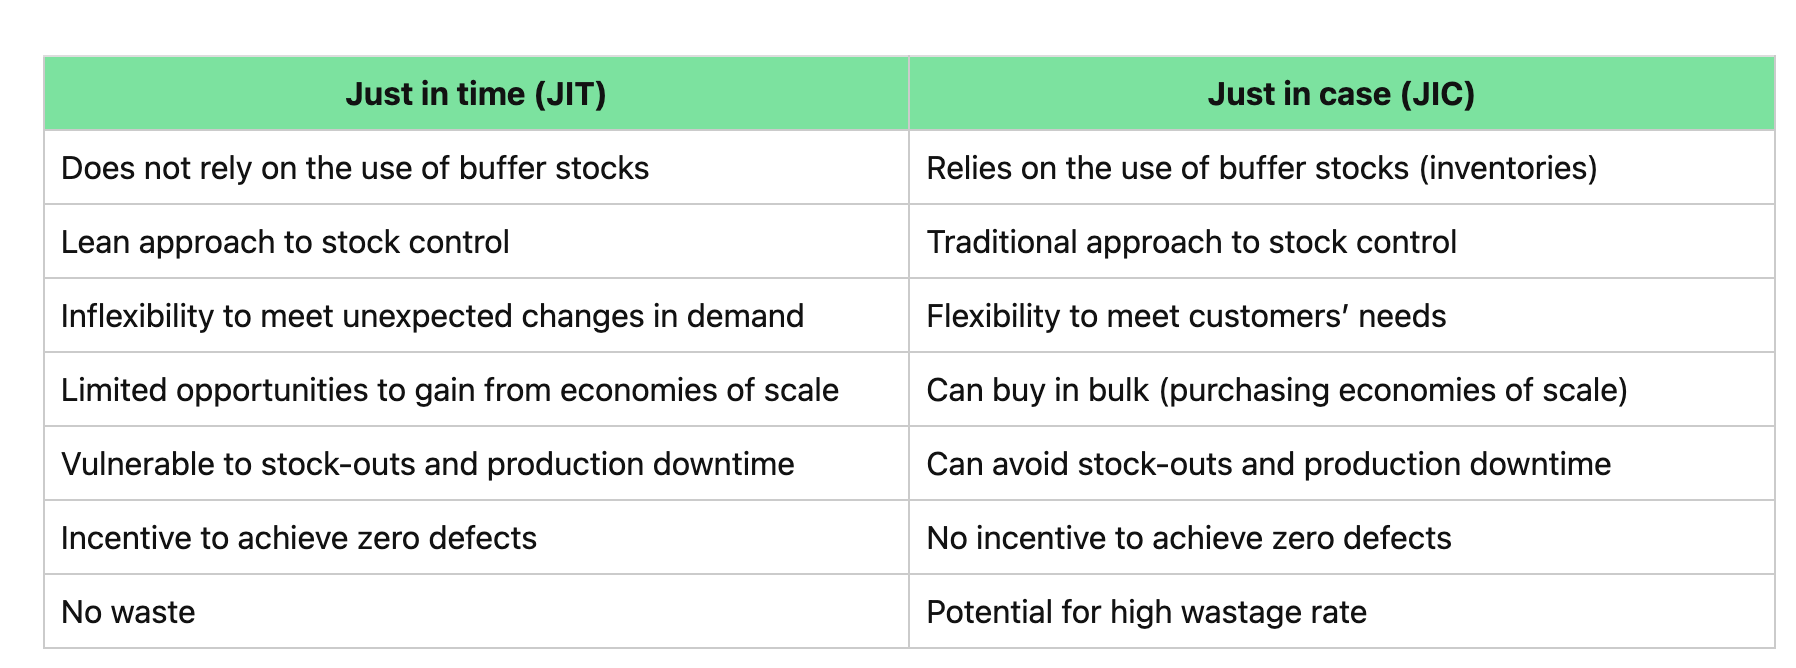
Just-in-time (JIT)
Lean method of stock control
Inputs scheduled to arrive precisely when they are needed in the production process
Features of JIT
No need to hold buffer stock → less storage, insurance costs
Improves firms working capital- money not tied up in inventory (illiquid)
Pros of JIT
No need to hold buffer stock → minimises storage costs
Form of lean production: less wastage → no inventory to expire / damage
Improves liquidity position- cash not tied up w inventory → improves cash flow
Lower stock management costs + improved quality → improves firms competitiveness
Reduces firms break even
Strengthens rs w suppliers → reduces lead time
Cons of JIT
Small orders → no EOS
Inflexible → can’t cater for sudden increase in demand → loss of sales
Heavy reliance on tech (for efficient stock control) → risk of tech breakdown
Heavy dependance on 3rd party suppliers
Suppliers charge higher prices for urgent stock delivery
Buffer stock
The min stock level held by a business at any time
Held as a contingency in case of unexpected orders for the firm's output OR delays from suppliers of RM / components / finished goods
Just in case (JIC)
Stock control system
Requires businesses to have large quantities of stock
In case needed for an unexpected order / problem w the supply chain
Aka supply or demand fluctuations
Does JIC use buffer stock?
Yes
To meet changing demand
Can meet unexpected orders quickly
What firms is JIC appropriate for?
Use durable stocks
Not perishable
Pros of JIC
Uses buffer stock → flexible → can meet increase in demand → increase sales
Uses buffer stock → can continue production even if suppliers deliver stock late
Purchase large stock quantities → purchasing EOS
Maintains customer satisfaction
Less down time → less waste
Cons of JIC stock control
Increases costs- storage, maintenance
Stocks subject to damage
Not suitable for perishable products
Stockpiling reduces firms working capital + cash flow (esp if illiquid)
Opp cost of buing stock
JIT vs JIC
Stocks / inventories
The goods that a business has available for sale, per time period
Materials, components used in production process
Intend to be sold ASAP, to generate cash for the business.
3 types of stock
Raw material (natural resources)
Semi-finished goods / work in progress (incomplete)
Finished goods (complete, ready to sell)
Why is managing stock importance?
To avoid:
Stockpiling
Stock-outs
Stockpiling
Business orders + hold more stock than it would usually do (too much)
Bc anticipating high levels of demand
Stock-outs
When a business has no more stock for production or sale
Cons of stockpiling
Storage costs
Stock can perish / damage
Semi-finished goods = v illiquid
Changing tastes → no demand for stock → becomes obsolete → high discounts to sell (low PM)
Cons of stock-outs
Lose sales (to rivals) → less revenue
Production halted → inefficiencies + delays
Poor corporate image → harms customer loyalty
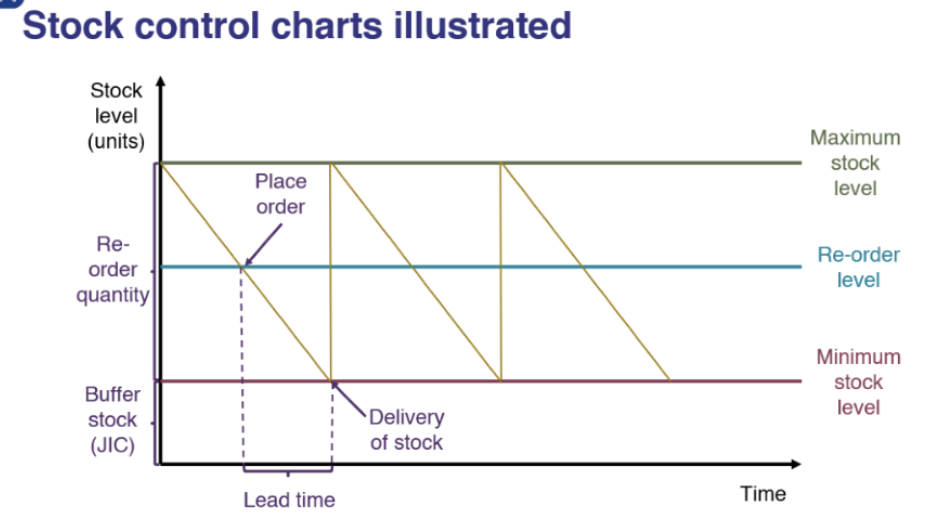
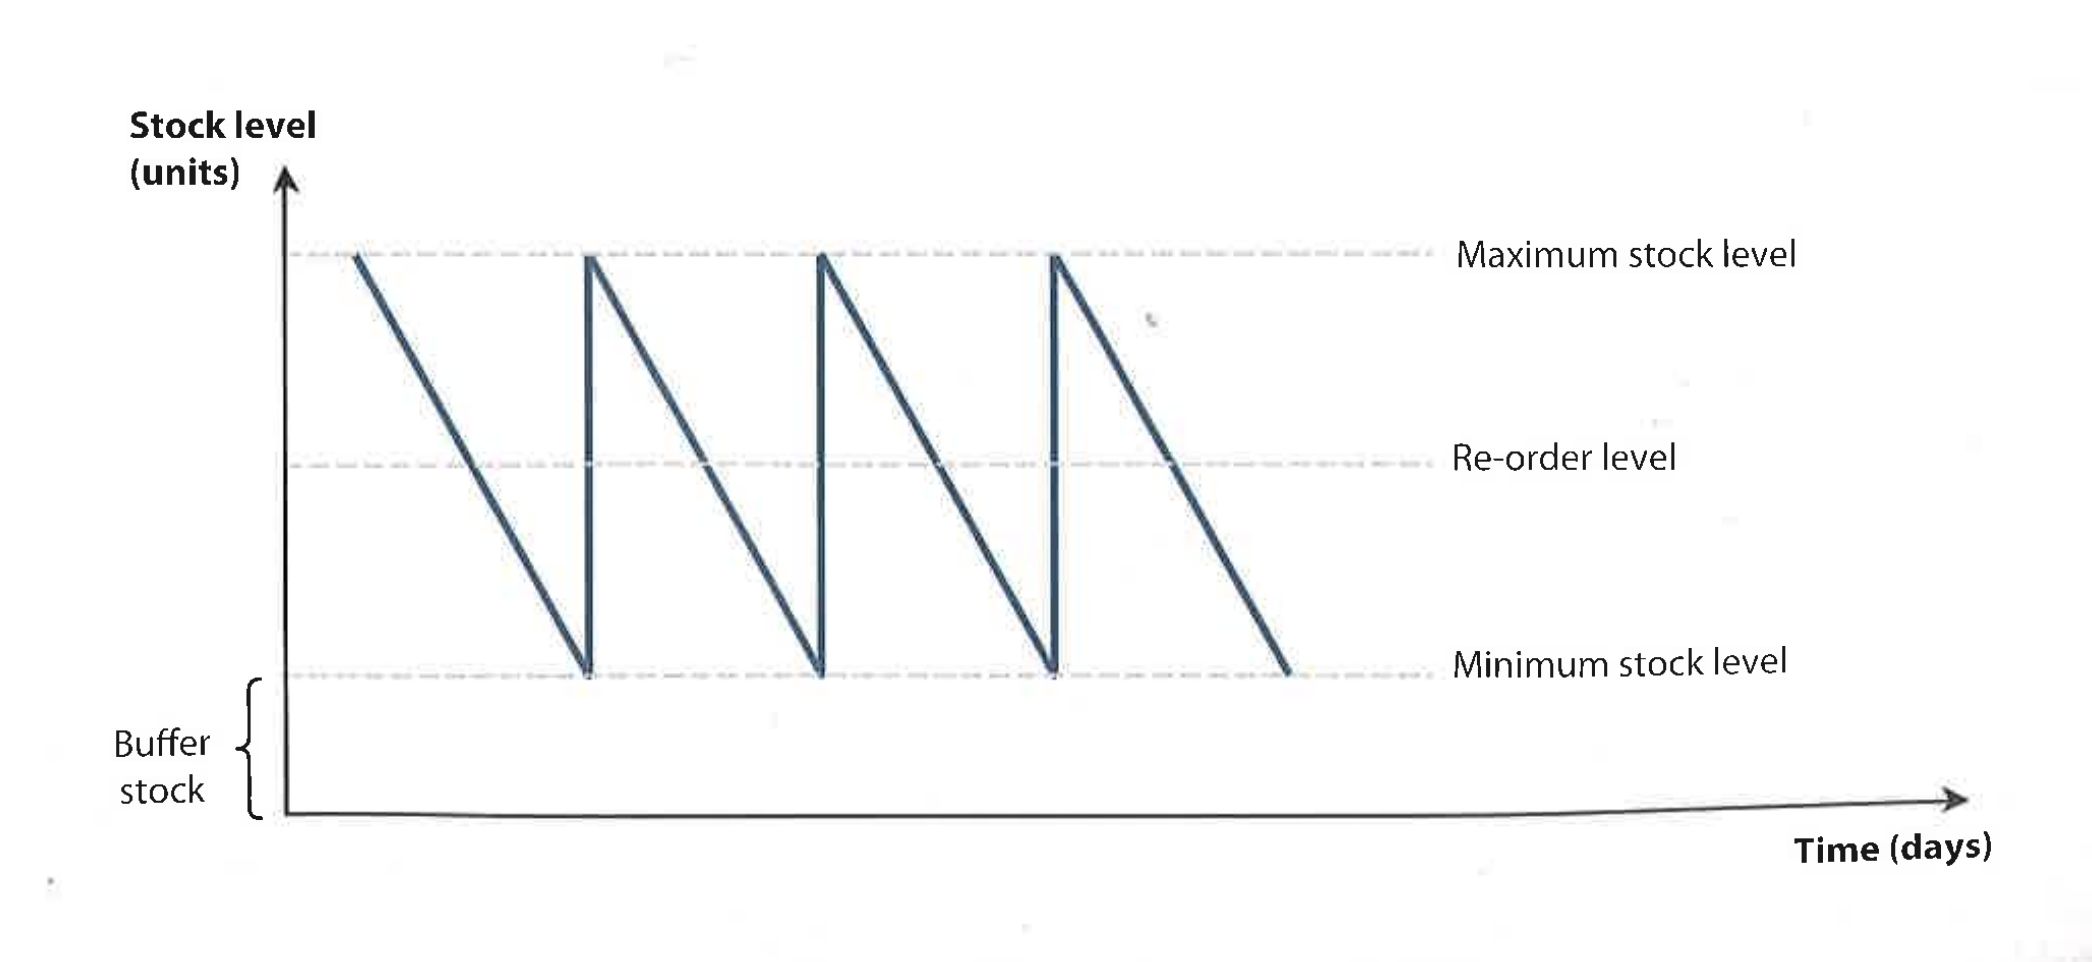
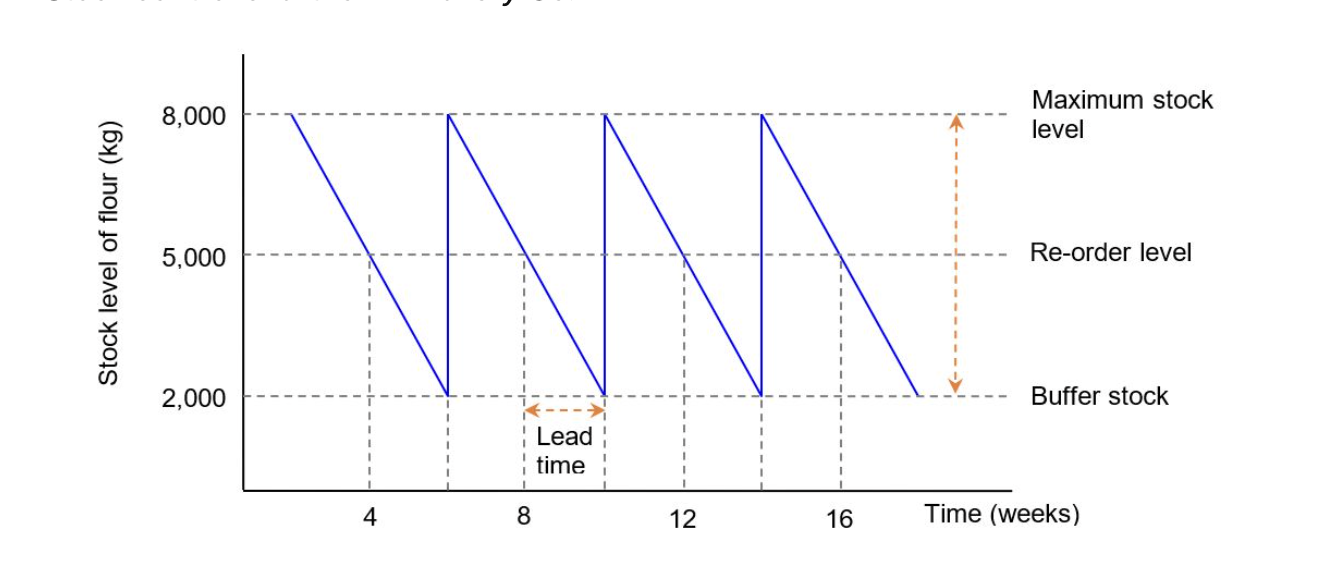
Stock control charts
Visual tool used to monitor + analyse a firm’s stock levels
Shows rate which stocks are used, when stocks are order, how long they take to be distributed, and when they are delivered.
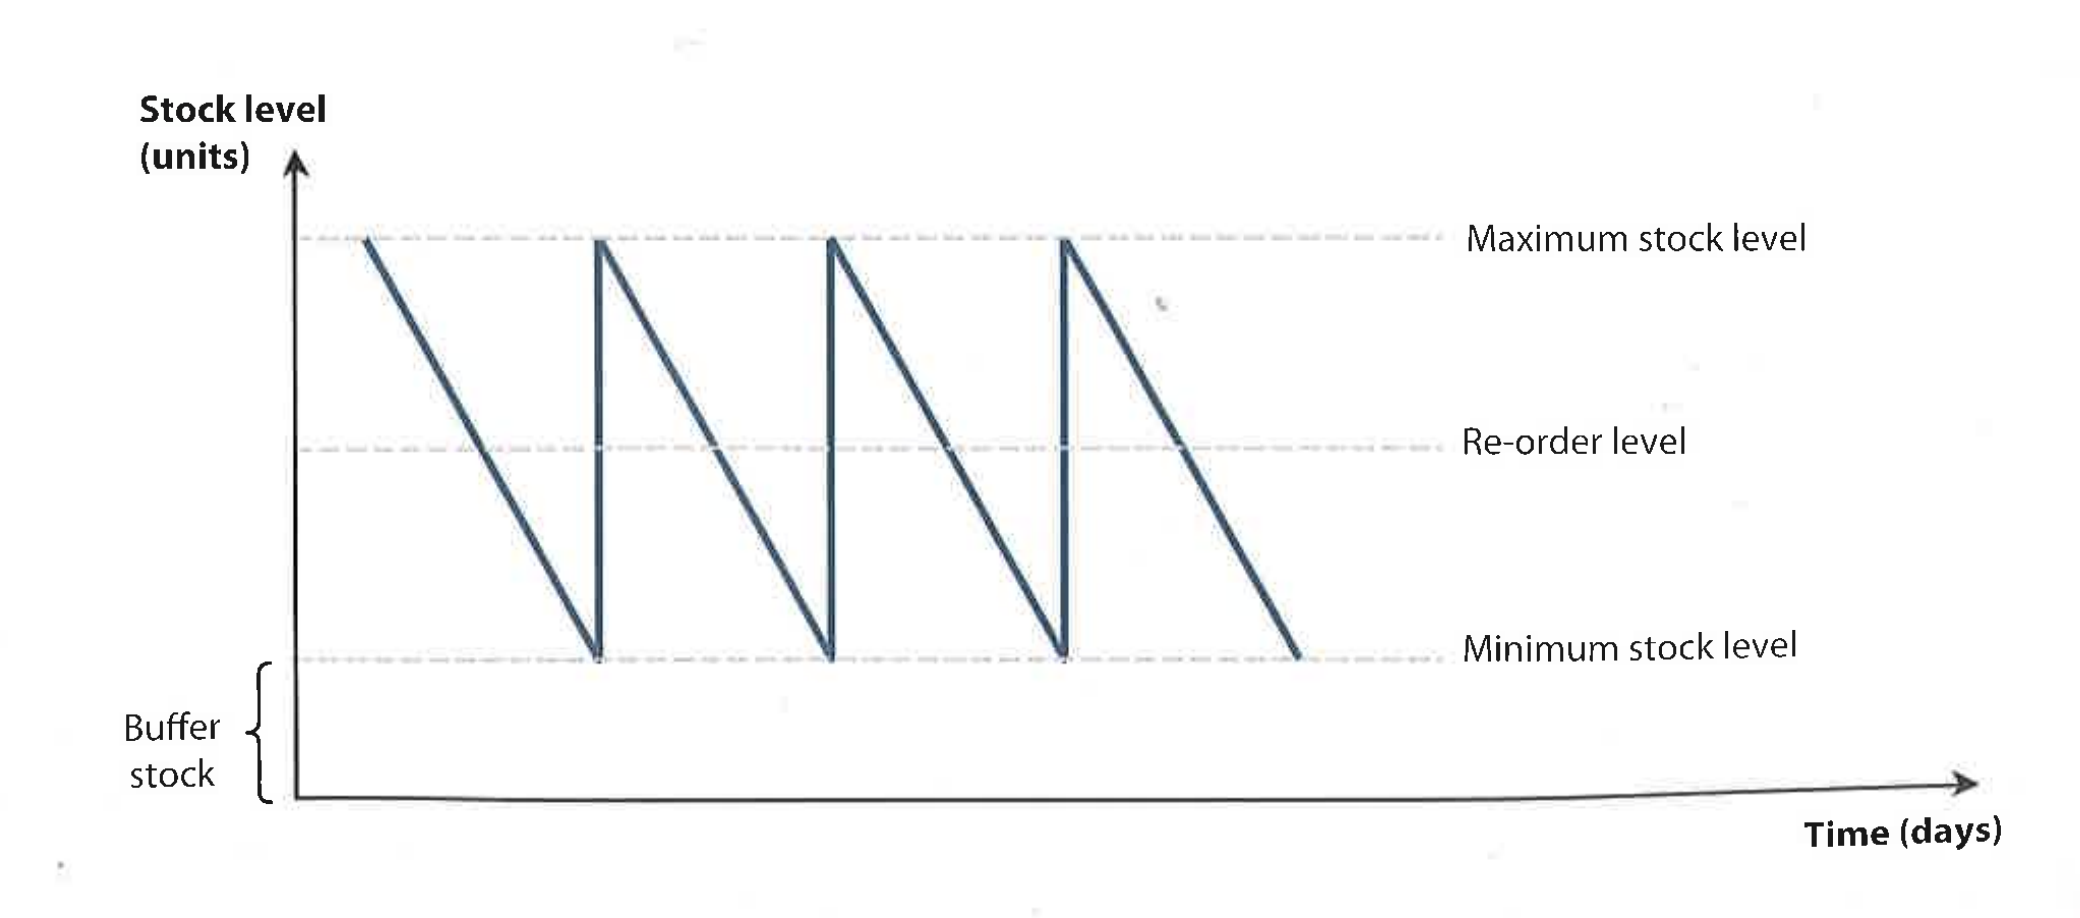
Main features on stock control charts
Lead time
Buffer stock
Re-order level
Re-order quantity
Maximum stock level
The most amt (upper limit) of stock that a firm wants to hold at any point in time
Based on its storage facilities + capacity
Buffer stock (min stock level)
The lowest amt (lower limit) of stock that a firm wants to hold at any point in time
Due to precautionary measures eg unexpected demand
The more efficient a firm is → lower BS
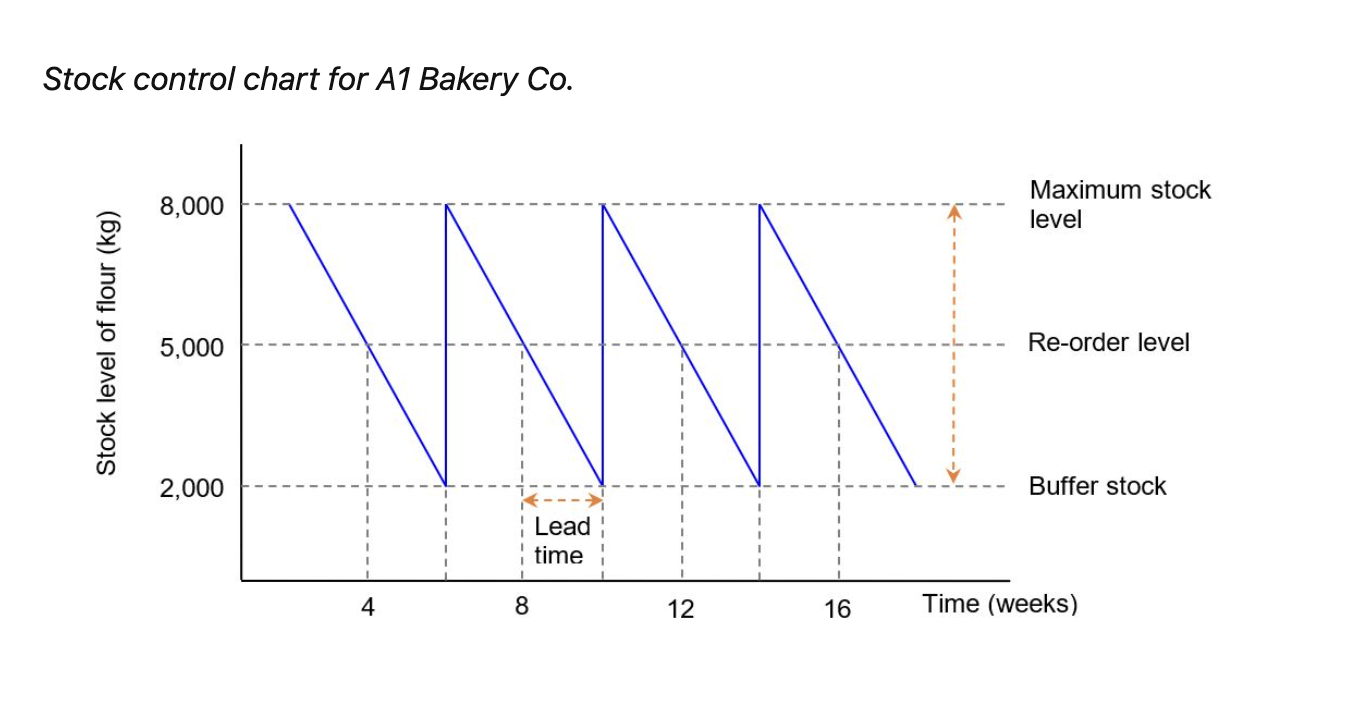
Reorder level
The level of inventory at which a firm places a new order for stock
Helps prevent production problems due to lack of stock (due to lead time)
Reorder quantity
The amount of new stock that is ordered for production
Max - min stock level on stock control chart
How to determine reorder quantity?
Max - min stock level
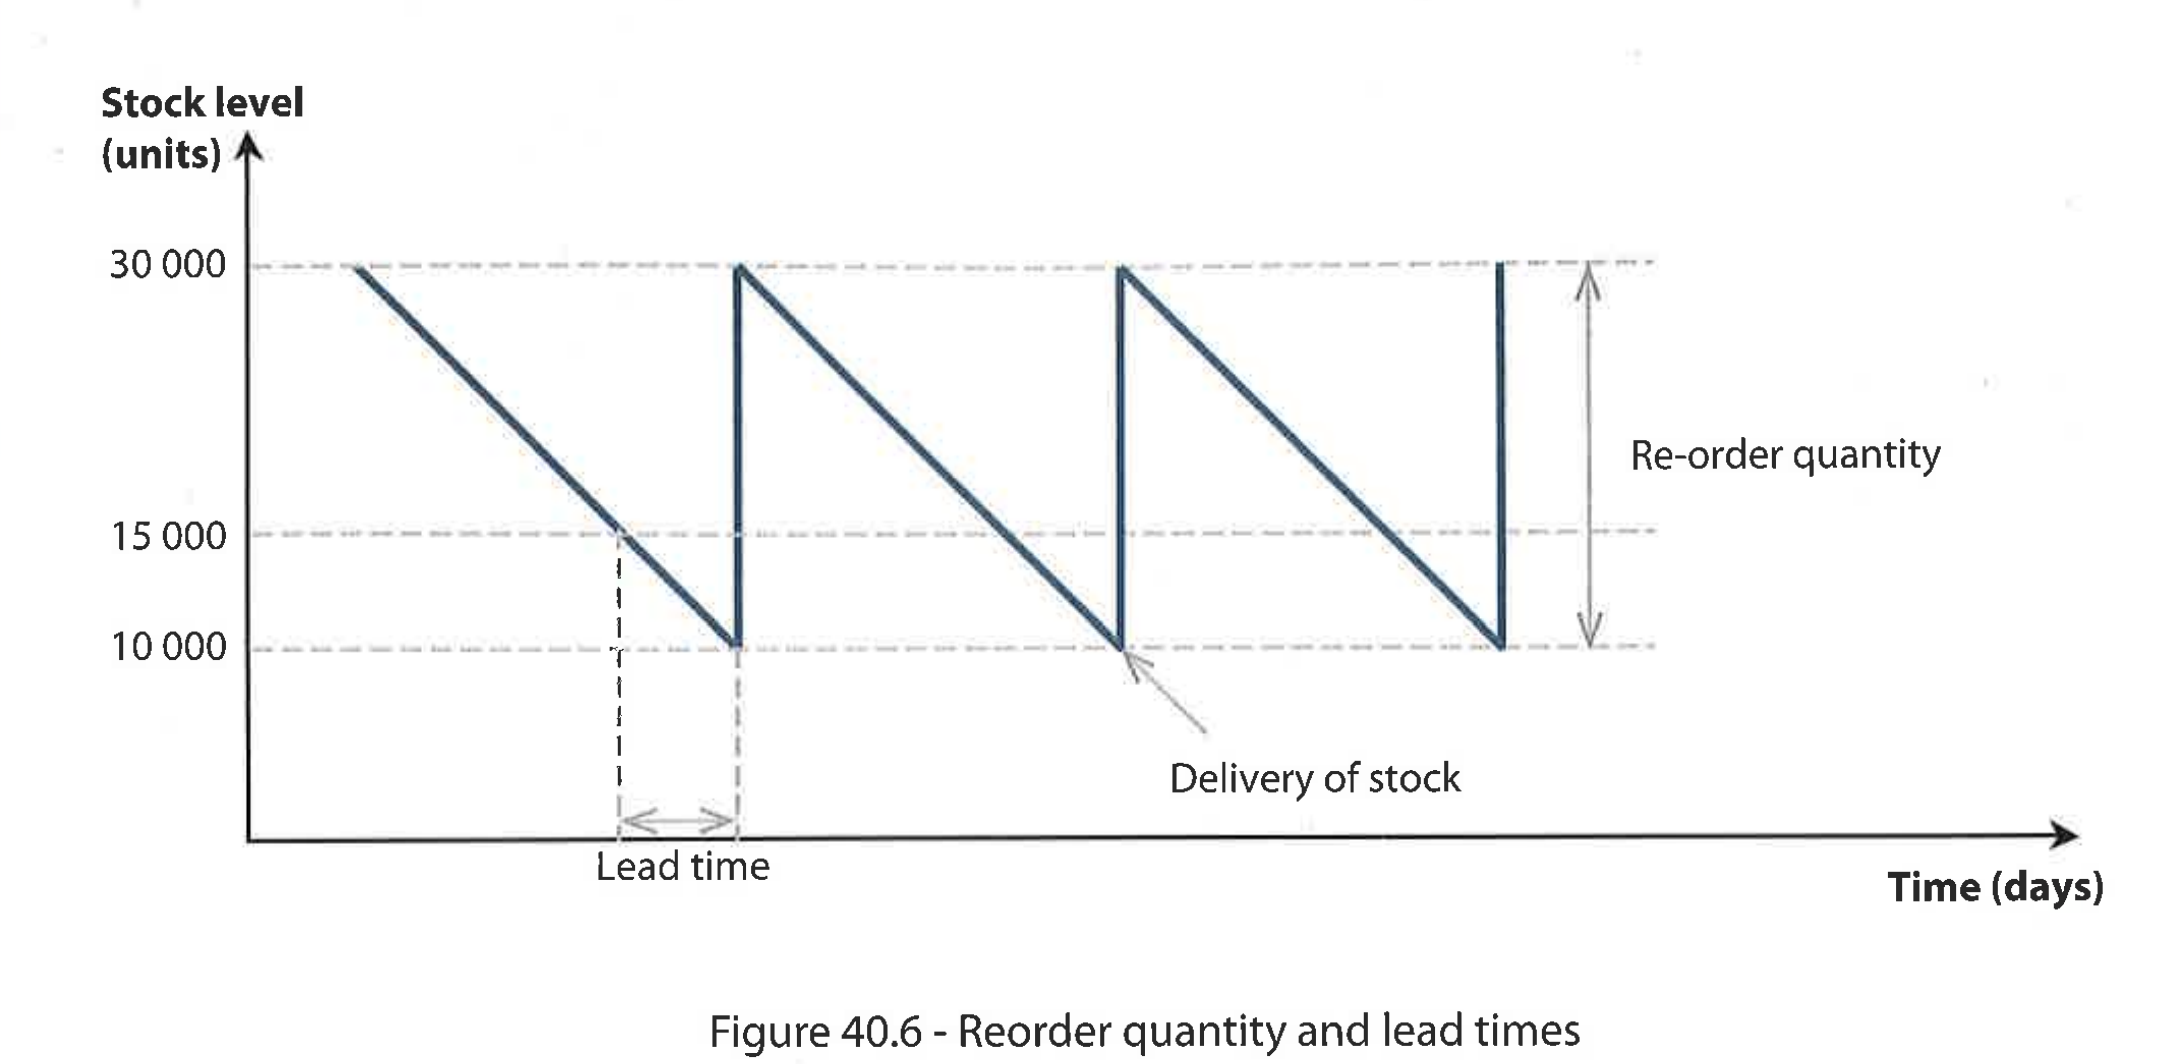
Lead time
The duration (time lag) betw a firm placing an order for stock + receiving delivery of the stock
If a firm has high lead times, will it hold high or low buffer stocks?
High
Longer lead time → higher buffer stock
Usage rate
Shows the speed (rate) at which stocks are used in the production process
On stock control chart
Higher UR = more freq reorder
Usage rate formula
Usage rate per time period = Stocks used / Time period
Draw a stock control chart
When do usage rates tend to increase + decrease?
Increase- economic prosperity + peak-periods
Decrease- recession, off peak
What happens if firms have longer lead times?
Need to reorder earlier
Or need to reorder larger amounts
Why can low buffer stock levels be held w short lead times?
Producer knows new stock orders will be delivered soon → prevents delays to production
Cons of stock control charts
Simplistic
Affected by late deliveries, seasonal fluctuations in demand, production delays
Factors influencing amt of stock a business holds
Type of product
Fast moving- high (due to high stock turnover)
Perishables- low (prevent spoilage)
Consumer durables- low (purchased infrequently)
Expected demand level
High demand- high
Lead times
Long- high
Cost of holding stock
High OC of stockpiling (eg jewelry)- low (risk of damage / theft)
Low OC- high (eg fast moving, low cost goods)
Capacity utilization
The extent to which an organization operates at its maximum level (productive capacity)
Capacity utilization rate
Measures a firm’s actual output as a % of its capacity (maximum potential output), at a particular point in time.
Measure of efficiency
Productive capacity
The max level that a firm is able to operate at, given the resources it has
All resources are used fully + efficiently
Capacity utilization rate formula
(actual output / productive capacity) x 100
What does it mean if a firm has 0% capacity utilization?
Not producing any output
When is capacity utilization likely to fall?
Demand level falls
Insufficient resources
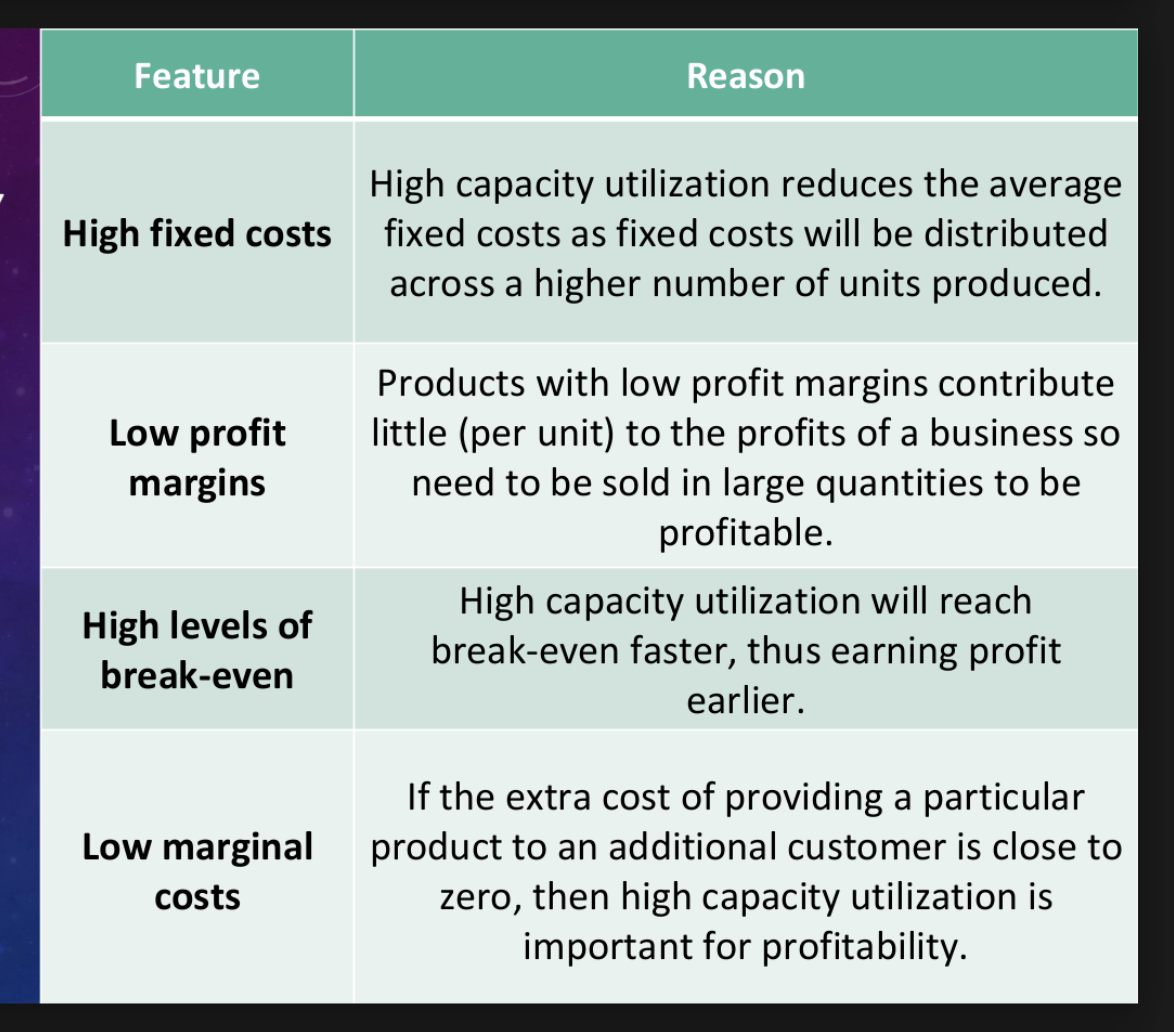
Pros of HIGH capacity utilization
Helps achieve EOS (high CU = increase output = EOS, AC fall)
Helps reduce AC → more competitive
Lower AC → increase profits
Means firm is productively efficient
Reach BEP faster
Cons of HIGH capacity utilisation
Employees become overworked → stressed + demotivated
Machinery wears out + depreciates faster → higher maintenance + replacement costs
Focus on quantity of output → quality suffers → reduced customer satisfaction
Need to upgrade IT systems- expensive
Doesn’t lead to growth- need to increase productive capacity for this
Zero defects
An aspect of lean production that focuses on preventing mistakes being made by getting things done right, first time round.
Defect
Output that is substandard
Needs to be re-produced- wastes time, money, resources
Defect rate
Measures proportion of output that is substandard, per time period
Defect rate formula
(defect output / total output) x 100
(defect output / no. output tested) x 100
Higher defect rate…
Lower quality of output
Cons of high defect rate
Poor rep → less sales, hard to attract customers
Rework → increases costs
Waste- time, material, labor → harms liquidity position
Wastes money- opp cost- could have been used for marketing / innovation
Legal issues → lawsuits (eg if defect harms customer)
Customer dissatisfaction → complain → negative word of mouth (more powerful than ATL)
Productivity
The level of efficiency in the production process
The more productive resources are, the more output they generate.
3 ways to measure productivity
Labor productivity
Capital productivity
Operating leverage
Productivity rate formula
Productivity rate = (Total output ÷ Total input) × 100
Productivity rate = (Total output ÷ Total input)
Labour productivity
Measures the average level of output per worker, for a given period of time
Efficiency of labour
Labour productivity formula
Labour productivity = Total output ÷ No. of workers
Capital productivity
Measures how efficiently an organization’s fixed assets are used to generate output for the business.
Capital productivity formula
Capital productivity = (Total output ÷ Total capital input) × 100
Capital productivity (output per machine hour) = Total output ÷ Machine hours
Pros of high productivity rates (4 Es)
EOS (reduce AC → low price for customers / greater PM)
Earnings (high profit → can reinvest, OR → pay workers higher wages → easier to attract high skilled employees)
Efficiency → increases competitiveness
Evolution aka growth → increase productive capacity
What determines productivity rates TRIES (not in spec)
Tech- new tech → increase productivity
Rivalry- comp → incentive to be productive (low price to consumers)
Innovation- can increase labor productivity (eg offline work)
Entrepreneurship
Skills / experience- improved quantity + quality of labor → increase productivity
Operating leverage
Financial ratio
Measures how a firm's operating income is affected by its fixed costs, variable costs, and sales
FC as proportion of VC
Shows extent to which firm can increase operating income by increasing SR
If a firm has relatively high fixed costs, will they have a high or low operating leverage?
High OL
Operating income / profit
Firm's earnings from SR before interest and taxes are deducted
Operating income = Gross profit − Operating expenses
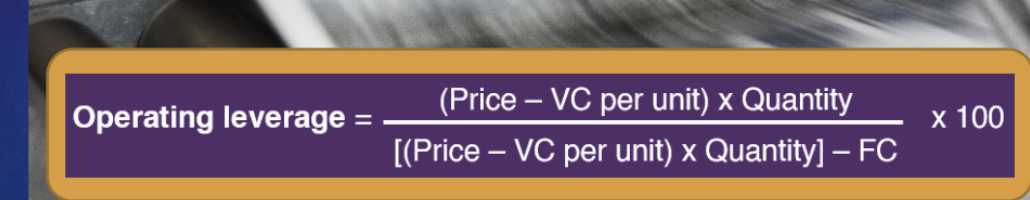
Operating leverage formula
OL = total contribution / net profit
OL = ((P- VC) x Q) / ((P-VC)xQ - FC))
Why is a high operating leverage bad?
Increases BEP
Sales drop → can’t cover fixed costs
Is it bad if firms have high VC?
No
BC if SR drops → VC drops
High operating leverage =
Higher risk BUT higher profit potential
What does it mean if a firms OL is less than 1?
Making loss on product
Costs more to produce than earns in profit
Next steps: reassess pricing methods / increase efficiency
If a firm has low OL bc most of its production costs are VC, what should it do? (kinda imp?)
Consider automation
But automation → higher fixed costs, lower variable costs
But its fince bc if demand increases → costs increase less (bc lower VC), so profits increase more
What does it mean in terms of FC and VC if a firm has a low OL?
FC relatively low compared to VC
Low FC, high VC
Sales falls → VC fall → easier to earn profit at low sales level (low risk)
But needs high sales vol to earn profit
Make or buy decision
The choice managers / firms have whether to manufacture a product in-house or to purchase it from a third-party subcontractor
Based on CTM and CTB
Cost to buy
Calculates the total cost of subcontracting production to a third-party supplier
In MOB decision
Cost to make
Calculates the total cost of producing the product in-house, instead of using a third-party provider
In MOB decision
Cost to buy formula
P x Q
Cost to make formula
(AVC x Q) + TFC
When will a firm make vs buy? (based on quantitative reasoning only?)
CTM > CTB: buy (outsourcing or subcontracting)
CTB > CTM: make (insourcing- in-house production)
Qualitative factors to consider in make or buy decisions
Product quality- buy vs make
Timeframe
Availability of spare capacity to meet extra orders
Reliability of suppliers- to deliver on time
Decision is irreversible (contract terms and conditions)