Biochem Exam 2
5.0(1)Studied by 140 people
Card Sorting
1/203
Earn XP
Description and Tags
Last updated 6:10 PM on 10/9/22
Name | Mastery | Learn | Test | Matching | Spaced | Call with Kai |
|---|
No analytics yet
Send a link to your students to track their progress
204 Terms
1
New cards
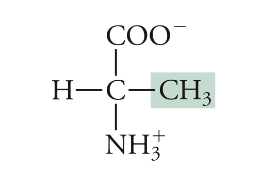
Alanine
Ala, A, Non-polar
2
New cards
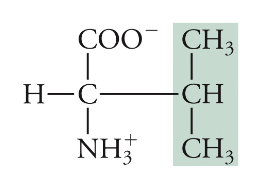
Valine
Val, V, Non-polar
3
New cards
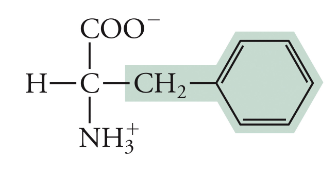
Phenylalanine
Phe, F, Non-polar
4
New cards
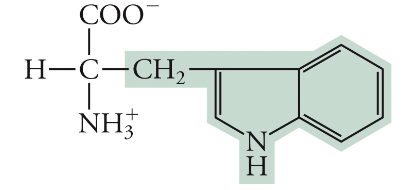
Tryptophan
Trp, W, Non-polar
5
New cards
Leucine
Leu, L, Non-polar
6
New cards
Isoleucine
Ile, I, Non-polar
7
New cards
Methionine
Met, M, Non-polar
8
New cards
Proline
Pro, P, Non-polar
9
New cards
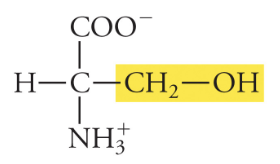
Serine
Ser, S, Polar
10
New cards
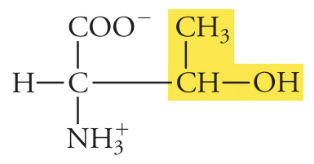
Threonine
Thr, T, Polar
11
New cards
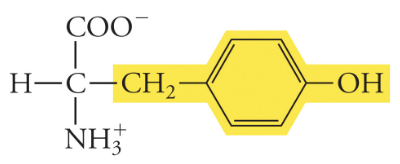
Tyrosine
Tyr, Y, Polar
12
New cards
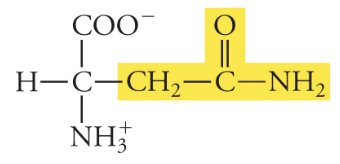
Asparagine
Asn, N, Polar
13
New cards
Glutamine
Gln, Q, Polar
14
New cards
Cysteine
Cys, C, Polar (creates disulfide bonds with other cysteines
15
New cards
Histidine
His, H, Polar (can be charged)
16
New cards
Lysine
Lys, K, Basic (pos charge)
17
New cards
Arginine
Arg, R, Basic (pos charge)
18
New cards
Aspartate (aspartic acid)
Asp, D, Acidic (neg charge)
19
New cards
Glutamate (glutamic acid)
Glu, E, Acidic (neg charge)
20
New cards
Glycine
Gly, G, Not charged
21
New cards
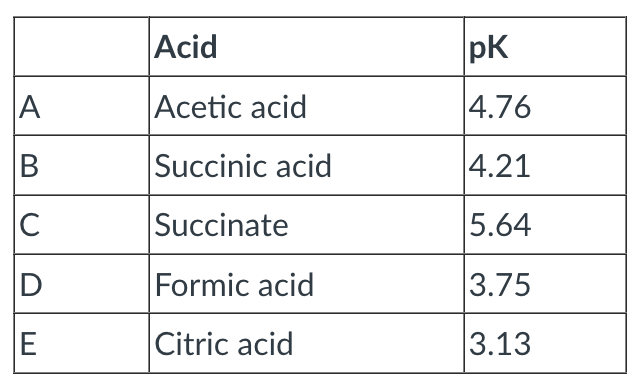
Rank the following according to their strength as acids--rank from strongest (1) to weakest (5).
A - 4
B - 3
C - 5
D - 2
E - 1
B - 3
C - 5
D - 2
E - 1
22
New cards
Which of the following would NOT form a suitable buffer?
Hydrochloric acid/chloride
23
New cards
Under what conditions would a carboxyl group (COOH, pK 3.5) be mostly protonated?
pH < pK
24
New cards
Under what conditions would a carboxyl group (COOH, pK 3.5) be mostly deprotonated?
pH > pK
25
New cards
In aqueous solution, globules of up to several thousand amphiphilic molecules arranged with the hydrophilic groups on the surface and the hydrophobic groups buried in the center are called _____.
micelles
26
New cards
What term is used to describe the exclusion of nonpolar substances from an aqueous solution?
hydrophobic effect
27
New cards
Which of the following is an example of the hydrophobic effect?
all are examples of the hydrophobic effect
28
New cards
A molecule that has both a polar and nonpolar region is called _____________.
amphiphilic
29
New cards
If the pK value for acetic acid (CH3COOH) is 4.76 at what pH would one observe equal amounts of CH3COO- and CH3COOH?
4.76
30
New cards
During metabolic acidosis, ______ ventilation excretes acid in the form of _____ .
increased; CO2
31
New cards
The LOWER the pK value of an acid the STRONGER the acid.
True
32
New cards
Which of the following bond forces are important in tertiary structure:
Hydrophobic effect
Hydrogen bonds
Disulfide bonds
Hydrogen bonds
Disulfide bonds
33
New cards
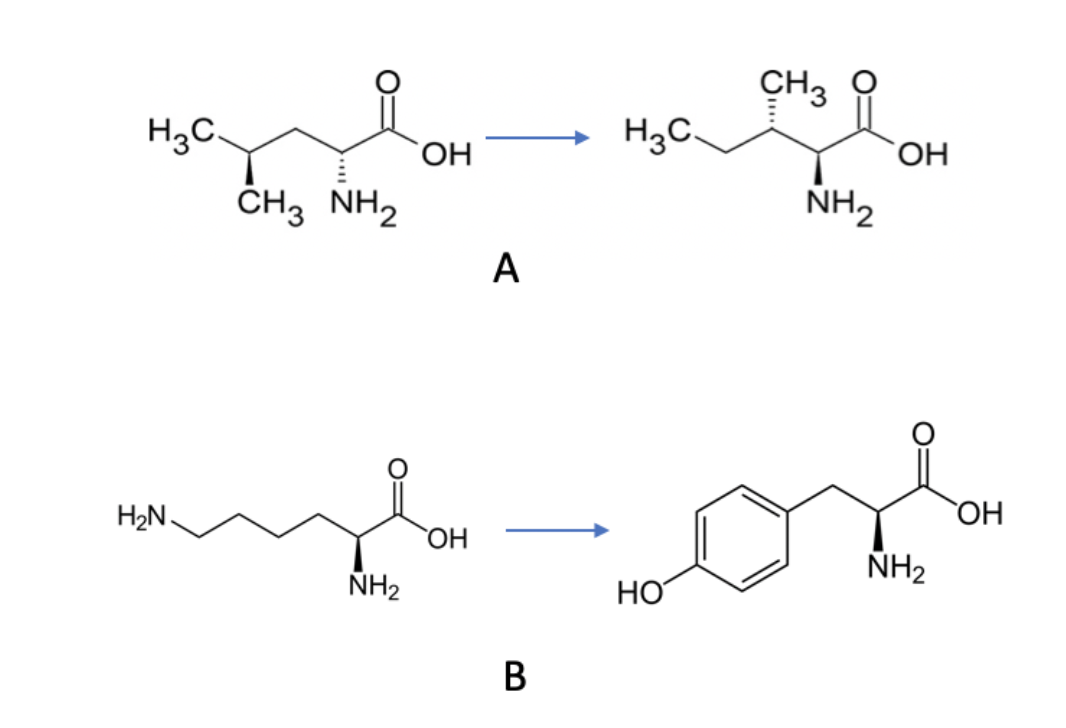
Which of the following amino acid substitutions would be most likely to effect protein function?
B
34
New cards
Select all the commonalities between alpha helices and b-pleated sheets. (i.e. select what is similar in both types of secondary structure)
prolines and glycines aren't suitable for the secondary structure
hydrogen bonds between main chain CO and NH groups
peptide bond is planar
hydrogen bonds between main chain CO and NH groups
peptide bond is planar
35
New cards
The formation of a dipeptide from two amino acids involves
A) side-chain complementarity.
B) loss of water.
C) oxidation of the alpha-carbon.
D) reduction of the alpha-carbon.
E) base catalysis.
A) side-chain complementarity.
B) loss of water.
C) oxidation of the alpha-carbon.
D) reduction of the alpha-carbon.
E) base catalysis.
B
36
New cards
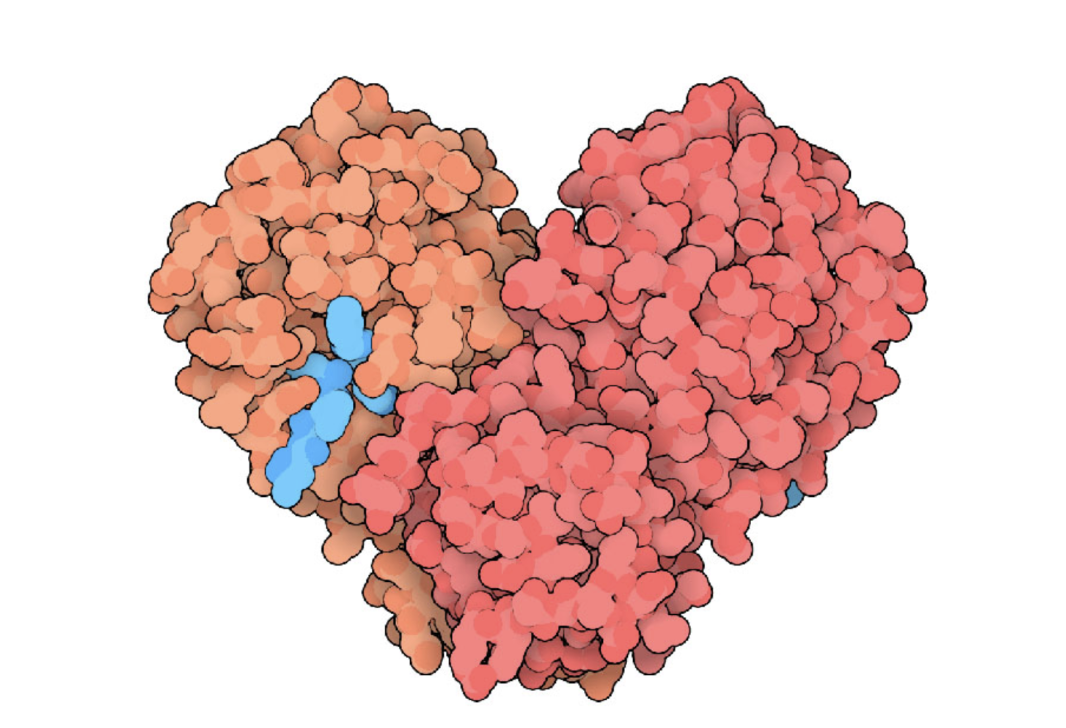
The protein shown above is the human coronavirus protease. The structure contains 2 subunits, that have identical sequences. This protein can be classified as:
quaternary:homodimer
37
New cards
At what pH would an amino acid bear both a COOH and an NH2 group?
Never
38
New cards
All secondary structures in proteins involve helical forms.
False
39
New cards
Cys-Ala-Gly-Arg-Gln-Met
In the above peptide, the amino-terminal amino acid is
____ and the carboxyl-terminal amino acid is ____
In the above peptide, the amino-terminal amino acid is
____ and the carboxyl-terminal amino acid is ____
Cys; Met
40
New cards
For the amino acid structures shown above, the protonation state of structure A is shown at ______ pH, and the protonation state of structure B is shown at _______ pH.
low; high
41
New cards
Choose the amino acid that would be more likely to appear on the solvent-exposed (water facing) surface of a protein.
Leu or Lys
Ser or Ala
Phe or Tyr
Trp or Gln
Asn or Ile
Leu or Lys
Ser or Ala
Phe or Tyr
Trp or Gln
Asn or Ile
Lys
Ser
Tyr
Gln
Asn
Ser
Tyr
Gln
Asn
42
New cards
Primary
The order in which the amino acids in a protein are linked by peptide bonds
43
New cards
Secondary
The arrangement of the backbone atoms in a polypeptide chain
44
New cards
Tertiary
The arrangement of all the atoms in a protein (interactions between the R groups, hydrophobic ones inside of the protein)
45
New cards
Quaternary
the interaction of several polypeptide chains in a multisubunit protein
46
New cards
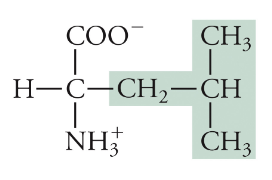
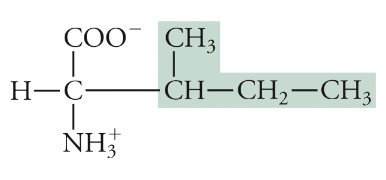
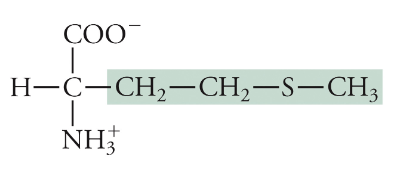
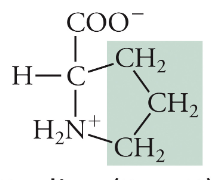
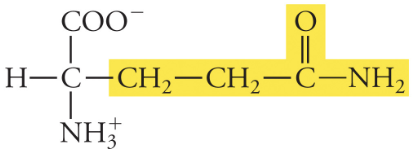
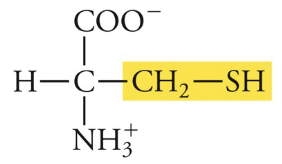
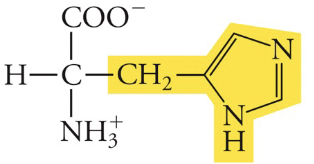
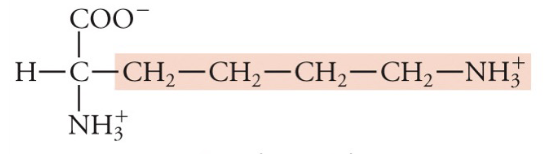
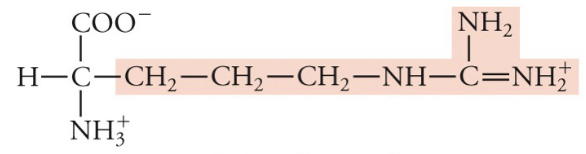
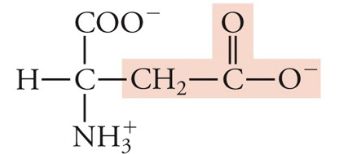
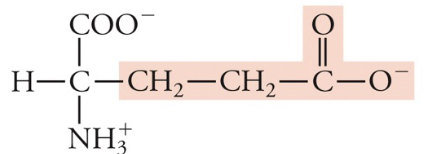
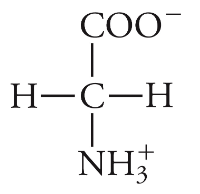
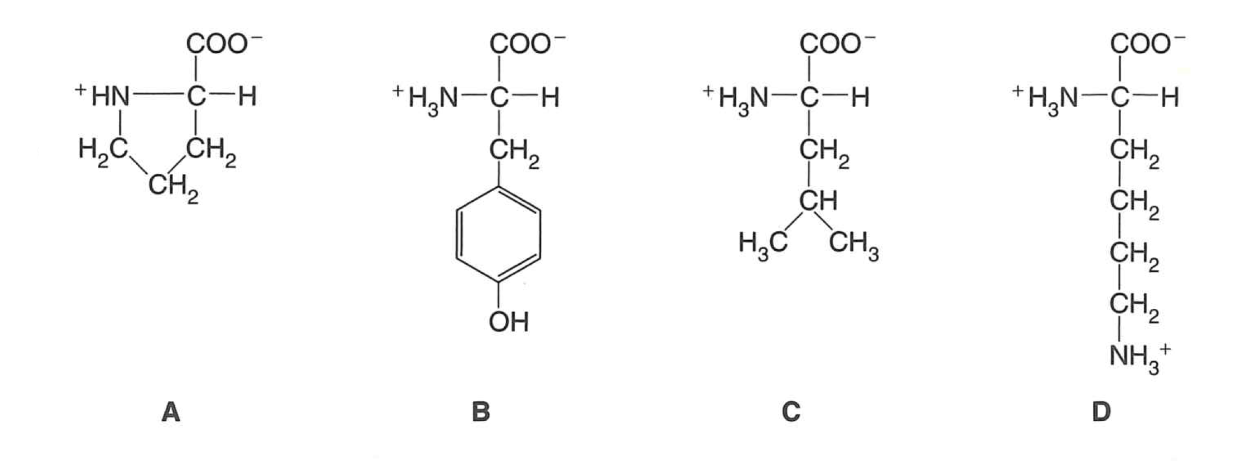
Examine the four amino acids given below:
Indicate which of these amino acids are associated with the following properties:
Indicate which of these amino acids are associated with the following properties:
branched aliphatic sidechain - C
basic sidechain - D
aromatic R group - B
cyclic (nonaromatic) R group - A
basic sidechain - D
aromatic R group - B
cyclic (nonaromatic) R group - A
47
New cards
Which of the following amino acids carry a net positive charge at pH 7.0?
Arg, Lys
48
New cards
What is the net charge on the following peptide at pH 9.5?
Lys-Ala-Glu-Gln-Cys-Ile
Lys-Ala-Glu-Gln-Cys-Ile
-2
49
New cards
What is the net charge of the pentapeptide Ala-Cys-Ser-Glu-Asn at pH 7?
-1
50
New cards
Any peptide which contains 2 sulfur-containing amino acids can form an internal disulfide bond.
False
51
New cards
The interactions that stabilize multisubunit complexes are different than those that stabilize tertiary structure.
False
52
New cards
Myoglobin is _____; hemoglobin is _____.
monomeric; tetrameric
53
New cards
The individual hemoglobin subunits and myoglobin share similar primary structure but have rather different secondary structure.
False
54
New cards
Which of the following fibers is correctly paired with the protein that forms the fiber?
extracellular support fibers: collagen
microtubules: tubulin
microfilaments: actin
intermediate filaments: keratin
(all are true)
microtubules: tubulin
microfilaments: actin
intermediate filaments: keratin
(all are true)
55
New cards
Which amino acid is critical for crosslinking of keratin fibers?
Cys (disulfide bonds)
56
New cards
The idea that binding of one molecule of oxygen to hemoglobin enhances further binding of oxygen to hemoglobin is called _____.
cooperativity
57
New cards
What is the most prevalent secondary structure observed in the proteins of intermediate filaments?
alpha helices
58
New cards
Which of the following statements about actin are true?
Monomeric G-actin polymerizes to form F-actin.
Actin filaments are polar (the ends can be distinguished).
Actin filaments are polar (the ends can be distinguished).
59
New cards
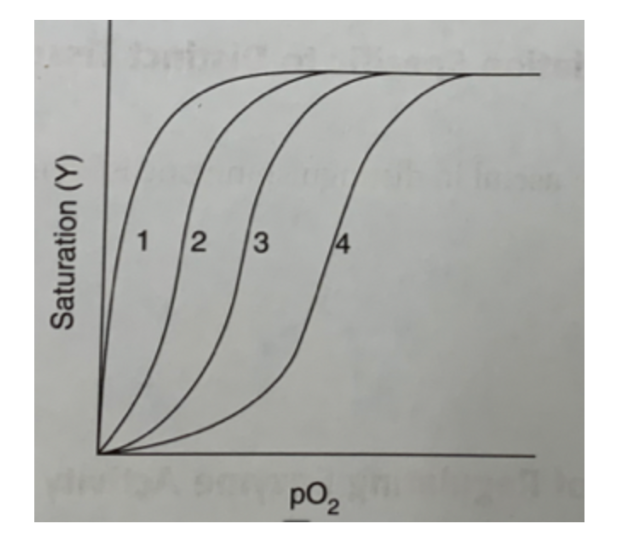
Several oxygen dissociation curves are shown in the figure below. Assuming that curve 3 corresponds to isolated hemoglobin placed in a solution containing physiologic concentrations of CO2 and BPG at a pH of 7.0, indicate which of the curves reflects the following changes in conditions:
Increased BPG concentration
4
Increased pH
2
Dissociation of hemoglobin into subunits.
1
4
Increased pH
2
Dissociation of hemoglobin into subunits.
1
60
New cards
Match the feature of hemoglobin with the proper structural level.
Amino acid sequence in each of the alpha and beta polypeptide chains.
Primary Structure
8 alpha helices in each of the subunits.
Secondary Structure
Spatial relationship between every atom in the individual subunits.
Tertiary Structure
Spatial relationship between the four polypeptide chains.
Quaternary Structure
Primary Structure
8 alpha helices in each of the subunits.
Secondary Structure
Spatial relationship between every atom in the individual subunits.
Tertiary Structure
Spatial relationship between the four polypeptide chains.
Quaternary Structure
61
New cards
The presence of 2,3-BPG causes hemoglobin's affinity for oxygen to______.
decrease
62
New cards
Which amino acid is involved in heme coordination in both hemoglobin and myoglobin and is highly conserved?
Histidine
63
New cards
Calculate the fractional saturation for myoglobin when pO2 is a. 20 torr and b. 80 torr. Assume K=2.8.
a. 0.88
b. 0.97
b. 0.97
64
New cards
Both myoglobin and hemoglobin exhibit cooperative binding to oxygen.
False
65
New cards
Conservative amino acid mutations (i.e. Val to Leu) are likely to affect stability or function of a protein.
False
66
New cards
Which of the following fatty acids have the lowest melting point?
Linoleate (18:2)
67
New cards
Which of the following types of lipids can be found in cell membranes?
glycerophospholipids
cholesterol
cerebrosides
gangliosides
cholesterol
cerebrosides
gangliosides
68
New cards
Select the statements the describe fatty acids:
can either be saturated or unsaturated.
mostly found with an even number of carbons
mostly found with an even number of carbons
69
New cards
In what way(s) do sphingolipids differ from glycerophospholipids?
Sphingolipids are not built on a glycerol backbone.
Sphingolipids contain an acyl group attached via an amide bond on the serine potion of the sphingosine.
Sphingolipids contain an acyl group attached via an amide bond on the serine potion of the sphingosine.
70
New cards
Show which are characteristics of peripheral membrane proteins and which are characteristics of integral membrane proteins.
peripheral
bind to the surface of membranes
integral
have transmembrane domains
bind to the surface of membranes
integral
have transmembrane domains
71
New cards
Which of the following is most likely to be an unnatural fatty acid?
17:3△t9,12,15 (uneven number of carbons)
72
New cards
Sphingosine is not a component of:
glycerophospholipids
73
New cards
Select the fatty acid in each pair that has the higher melting temperature.
16:1c9 or 16:2c9,12
- 16:1c9
18:0 or 18:1c9
- 18:0
18:0 or 20:0
- 20:0
- 16:1c9
18:0 or 18:1c9
- 18:0
18:0 or 20:0
- 20:0
74
New cards
Membranes are generally symmetrical, i.e., the outer face is composed of the same number and types of phospholipids as the inner face.
False
75
New cards
Phospholipids can freely diffuse from the interior leaflet of the plasma membrane to the exterior leaflet without the assistance of enzymes.
False
76
New cards
Triglycerides are fat storage molecules not typically found in membranes.
True
77
New cards
Match the description given with the correct lipid. (Answers may be used more than once)
Primary storage form of lipids.
Triacylglycerols.
Provides stability in the plasma membrane.
Cholesterol
Isoprene derivative
Cholesterol
Commonly found in nervous tissue
Sphingomyelin
Sphingosine backbone with several carbohydrates attached
Ganglioside
Glycerol backbone with two fatty acyl groups
Glycerophospholipid
Triacylglycerols.
Provides stability in the plasma membrane.
Cholesterol
Isoprene derivative
Cholesterol
Commonly found in nervous tissue
Sphingomyelin
Sphingosine backbone with several carbohydrates attached
Ganglioside
Glycerol backbone with two fatty acyl groups
Glycerophospholipid
78
New cards
A membrane's fluidity is largely determined by the percentage of _____________.
unsaturated fats
79
New cards
The concentration of Ca2+ in the endoplasmic reticulum (outside) is 1 mM, and the concentration of Ca2+ in the cytosol (inside) is 0.1 μM. Calculate ΔG at 37°C when the membrane potential is −50 mV (cytosol negative)
-33,388.1
80
New cards
Which of the following is/are true regarding the glucose transporter?
it transports glucose down it's concentration gradient
binding of glucose causes a conformational change so that the transporter is never open on both sides of the membrane
binding of glucose causes a conformational change so that the transporter is never open on both sides of the membrane
81
New cards
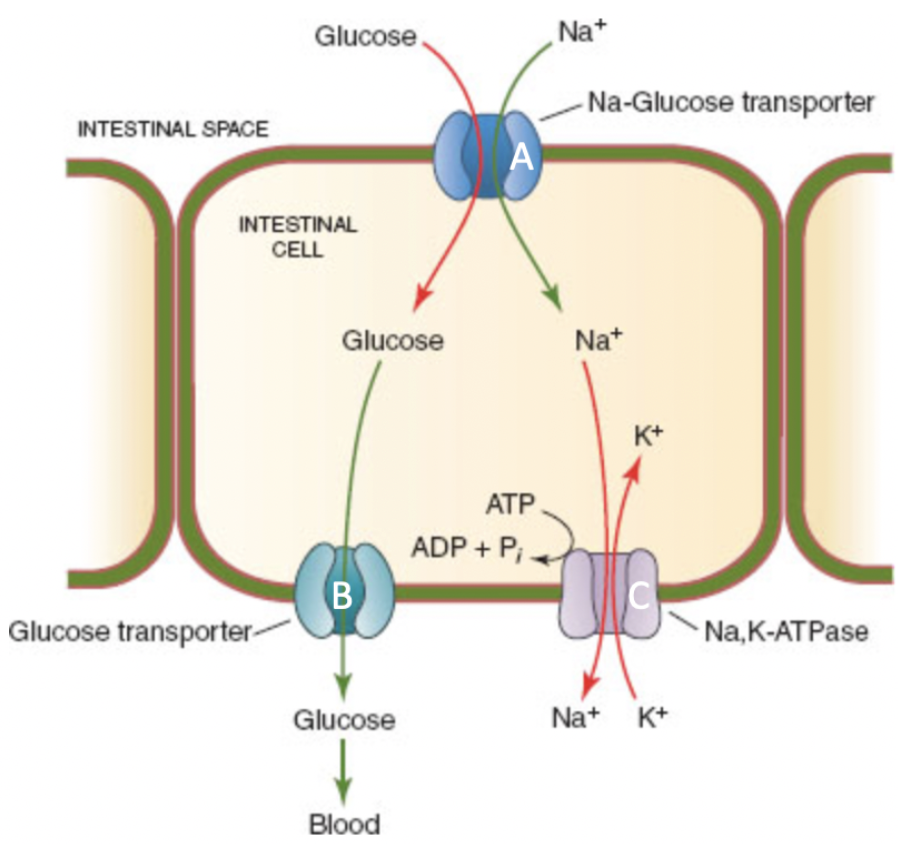
Match the transporter (A- blue, B- green, C- light purple) with it's description.
A - Symporter
B - Uniporter
C - Antiporter
B - Uniporter
C - Antiporter
82
New cards
Indicate whether the following compounds are likely to cross a membrane by simple diffusion or facilitated diffusion transport:
aspartic acid
facilitated
carbon dioxide
simple
glucose
facilitated
facilitated
carbon dioxide
simple
glucose
facilitated
83
New cards
Which of the following will cause the opening or closing of a gated ion channel?
voltage change
84
New cards
What substance will be transported through an aquaporin?
water
85
New cards
In the sodium-potassium pump:
sodium is transported out of the cell and potassium into the cell, both against concentration gradients
86
New cards
Active transport is uniquely characterized by:
the tight coupling of an input of energy, with the species going from a lesser concentration to a greater concentration.
87
New cards
Facilitated (Mediated) diffusion across a biological membrane:
is driven by a difference in solute concentration.
88
New cards
Energy requiring transport mechanisms include
Active transport
89
New cards
Inside a nerve cell at rest, [Na +] is
____ and [K+] _____ relative to the concentrations seen outside the cell.
____ and [K+] _____ relative to the concentrations seen outside the cell.
low, high
90
New cards
The Hydrophobic Effect
The exclusion of nonpolar substances from an aqueous solution
91
New cards
Amphiphilic
experience both hydrophilic interactions and the hydrophobic effect. most lipids are amphiphilic.
92
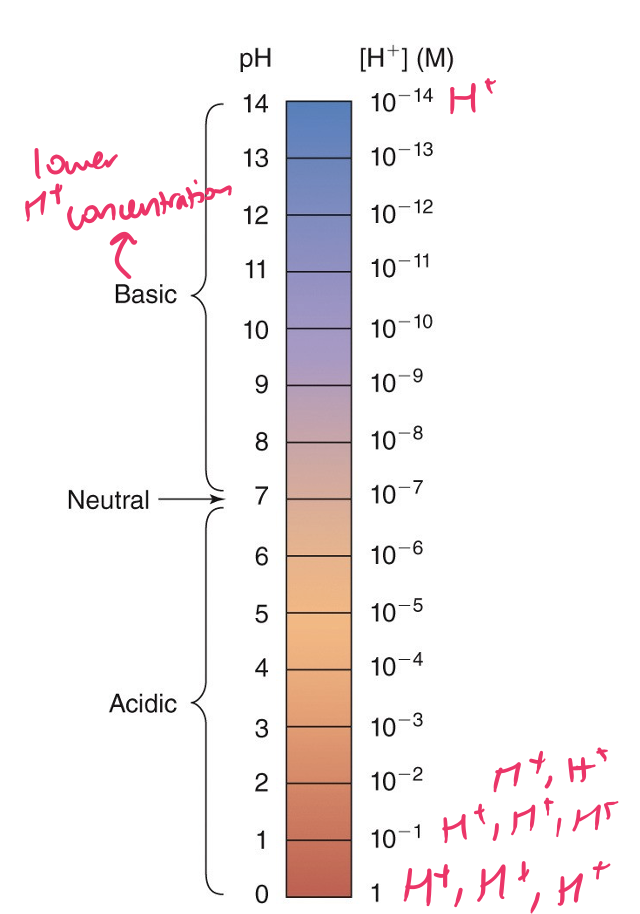
New cards
the pH scale
93
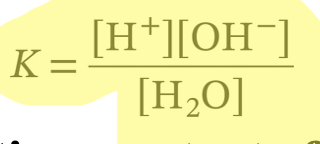
New cards
The ionization of water can be described by a dissociation constant, K:
(products)/(reactants)
94
New cards
acid
substance that can donate a proton
95
New cards
base
a substance that can accept a proton
96
New cards
pK helps to
determine the strength of an acid (lower pK = stronger acid, higher pK = weaker acid)
97
New cards
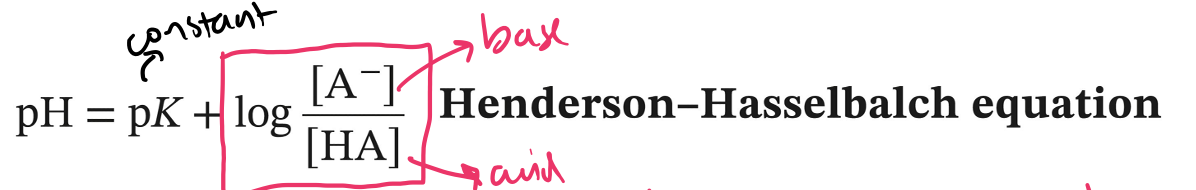
Henderson-Hasselbalch Equation
*pK is the specific pH where there are equal concentrations of base and acid
*log > 1 --> always positive, pH rises
*log < 1 --> always negative, pH lowers
*log > 1 --> always positive, pH rises
*log < 1 --> always negative, pH lowers
98
New cards
pH < pK
everything will be protonated
99
New cards
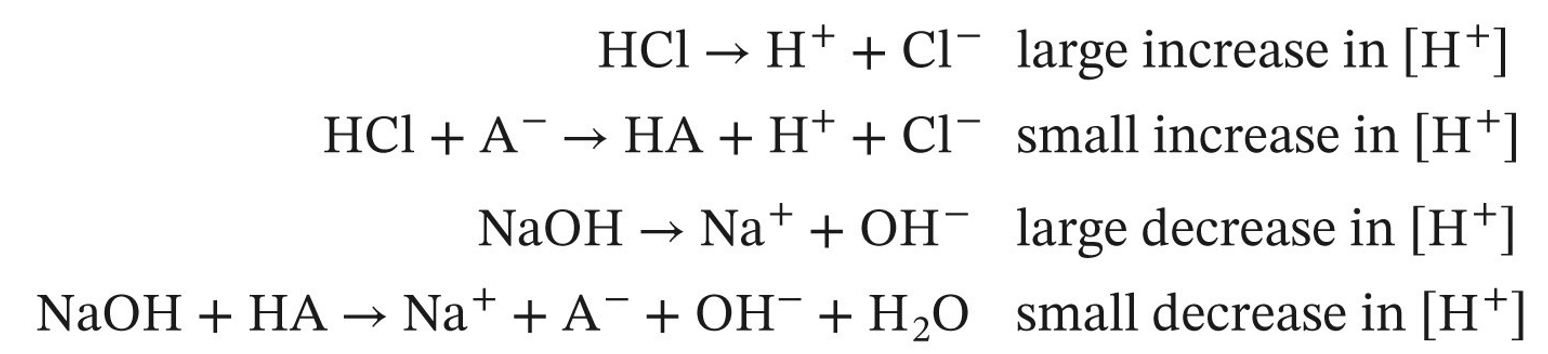
buffer
*weak acid/conj base system* aids in resisting changes in the pH of a system
100
New cards
Amino Acids (L and D groups)
L --> amino group to the left of the alpha carbon
D --> amino group to the right of the alpha carbon
L is the most common in nature
D --> amino group to the right of the alpha carbon
L is the most common in nature