LEA Waveforms
1/68
There's no tags or description
Looks like no tags are added yet.
Name | Mastery | Learn | Test | Matching | Spaced | Call with Kai |
|---|
No analytics yet
Send a link to your students to track their progress
69 Terms
Stroke Volume
amount of blood ejected from the heart every beat; measured as liters/beat
Stroke Volume Equation
EDV-ESV
Cardiac Output
volume of blood ejected by the heart per minute
Cardiac Output Equation
SV x HR
Pre Load
amount of blood left in ventricle at the end of diastole
After Load
resistance against which the ventricle must pump
Cardiac Cycle
pressure wave created by each stroke volume of blood
Pulsatile Wave
variations in blood volume and energy occuring during each cardiac cycle
Cardiac and Venous Flow
-IVC to RA
-increase P RA, blood to RV
-increase P RV, blood to pul art
-blood to lungs
-oxygen into blood
-pul vns to LA
-increase P in LA
-blood to LV
-blood dispersed to arterial system
Cardiac and Arterial Flow
-LV pressure > aorta
-BP rises in aorta
-arterial walls expand
-arterial reservoir
-diastole: walls relax and blood propelled
Spectral Doppler
-analyzes how all the RBCs are moving at a particular point in time
-movement of RBC is evaluated and displayed on a graph
-doppler signal is in the audble range the spectral display adds a visual representation (20Hz- 20kHz)
Spectral Doppler
-presence of flow
-direction of flow
-flow characteristics
SD Direction of Flow
relative to the position of the trace on the baseline
SD Flow Characteristics
-peak velocity of flow and thickness of the trace indicate normal/abnormal hemodynamics
-vessel resistance (high or low)
-magnitude (mean)
SD Flow Direction
-doppler shift is the difference btwn transmitted and recieved frequency
-flow away from doppler beam is negative flow and is displayed below the baseline (unless inverted)
-flow towards doppler is positive flow and is above the baseline
Spectral Doppler
-flow direction is shown in relation to spectrum baseline and color bar
-velocity: PSV and EDV
-pulse repetition frequency
Y/Vertical Axis
velocity
X/Horizontal Axis
time
Z Axis
magnitude/characteristics, distribution of velocities
Z Axis
-each pixel corresponds to a specific moment in time or specific frequency shift or velocity
-brightness of a pixel is proportionate to the # of blood cells causing the frequency shift at that specific point in time
SD White
large number of blood cells have the corresponding velocity at that moment in time
SD Black
no or few blood cells have the corresponding velocity
SD Gray
moderate number have corresponding velocity
Fast Fourier Transformer
-mathematical formula designed to break down a complex waveform into various frequency components
-signal is digitized and mathematically analyzed to determine the individual frequency range
-displayed on a graph as a function of time showing the relative amplitude of the frequencies
FFT Advantages
-exceedingly accurate
-displays all individual velocity components that make up the complex reflected signal
-distinguishes between laminar and turbulent flow
Waveform
shape of the wave that is produced by the heart over the cardiac cycle
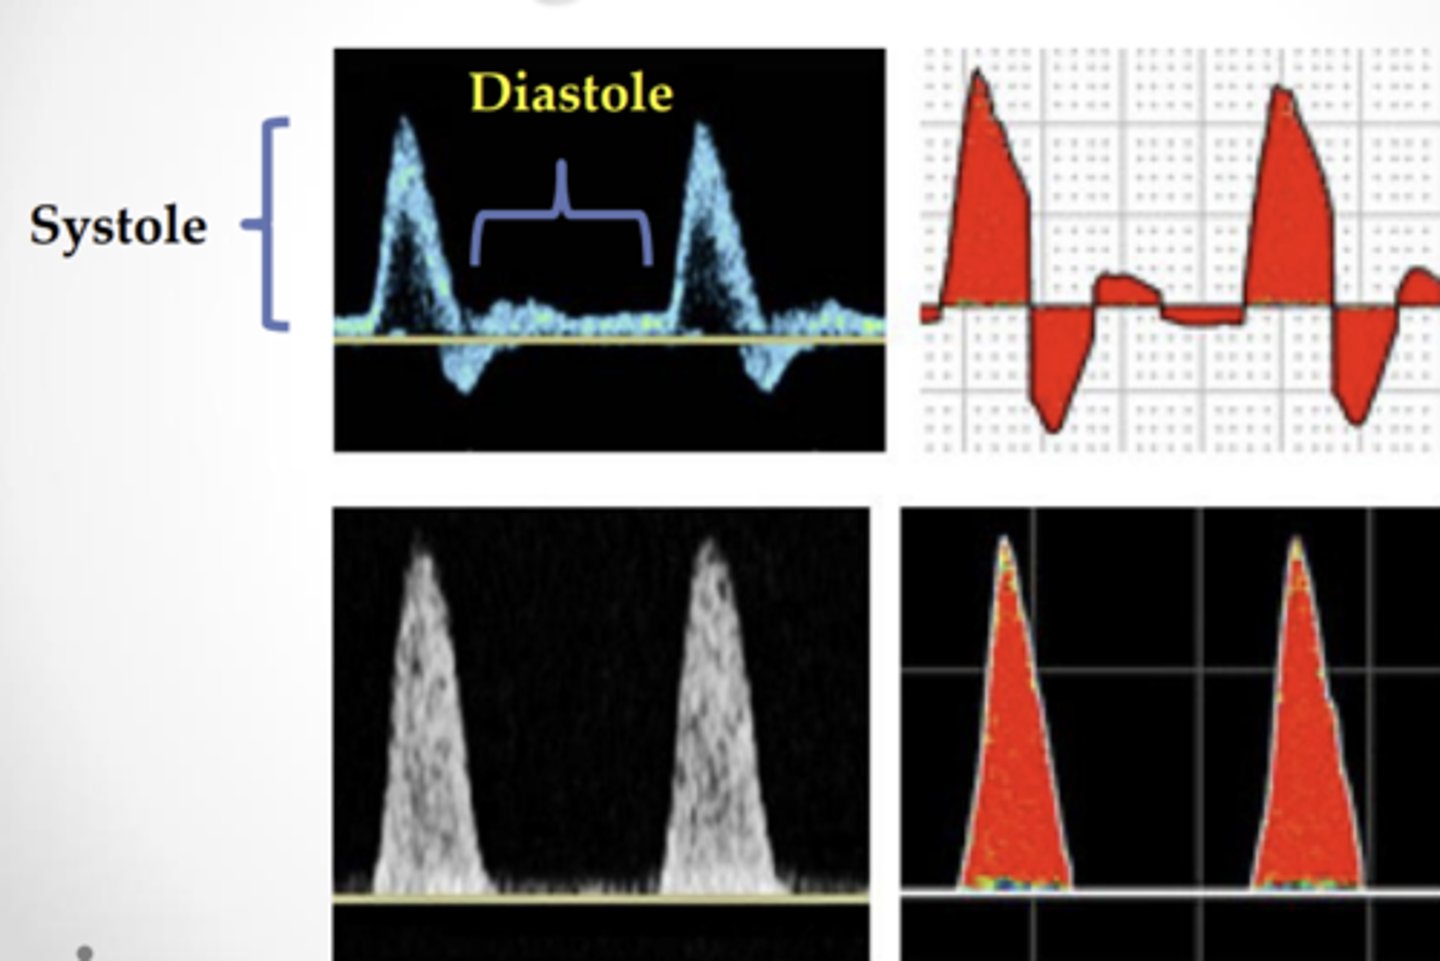
Systole
initial contraction phase, peak velocities
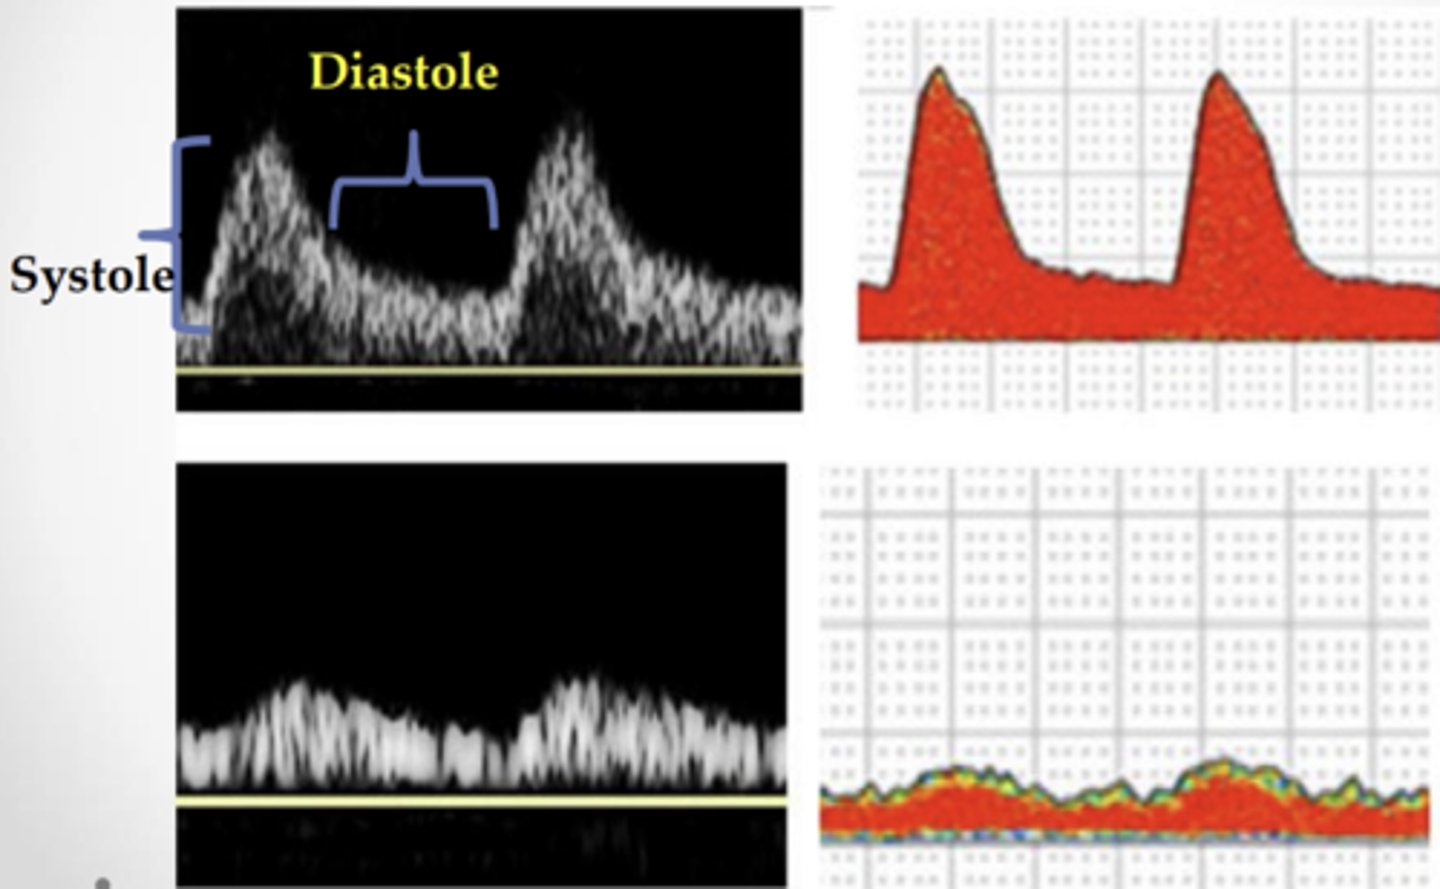
Diastole
relaxation phase, lowest velocities
Zero Baseline
signifies flow direction
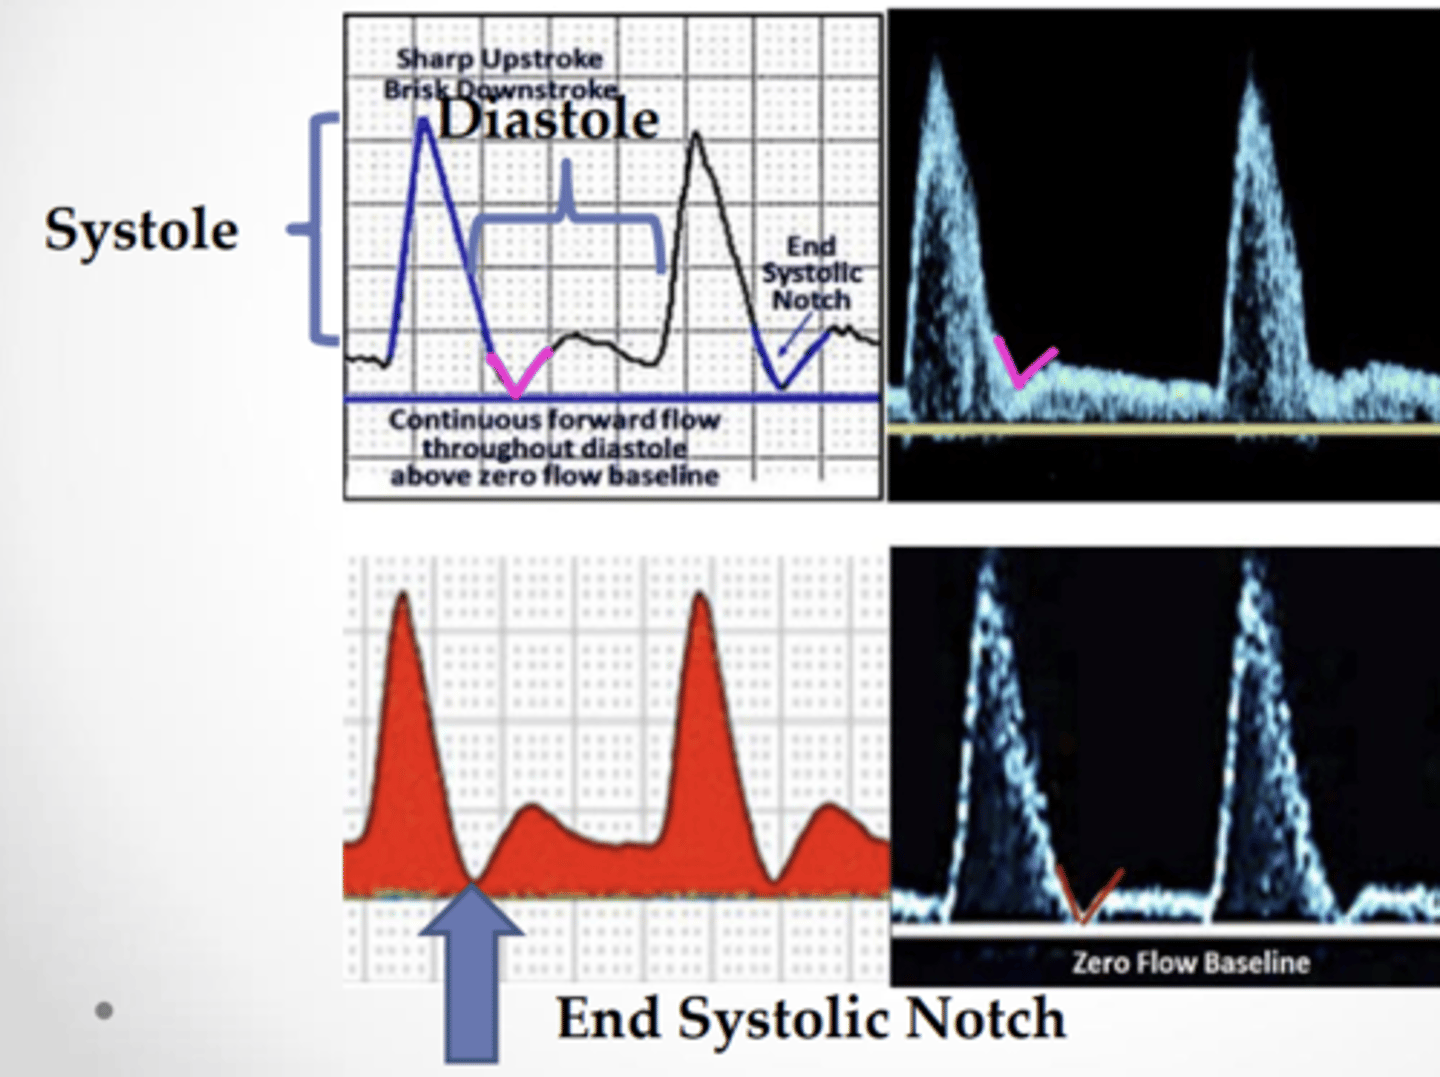
End Systolic Notch
rapid deacceleration of systole and rapid acceleration of diastole
Flow Direction
movement of blood
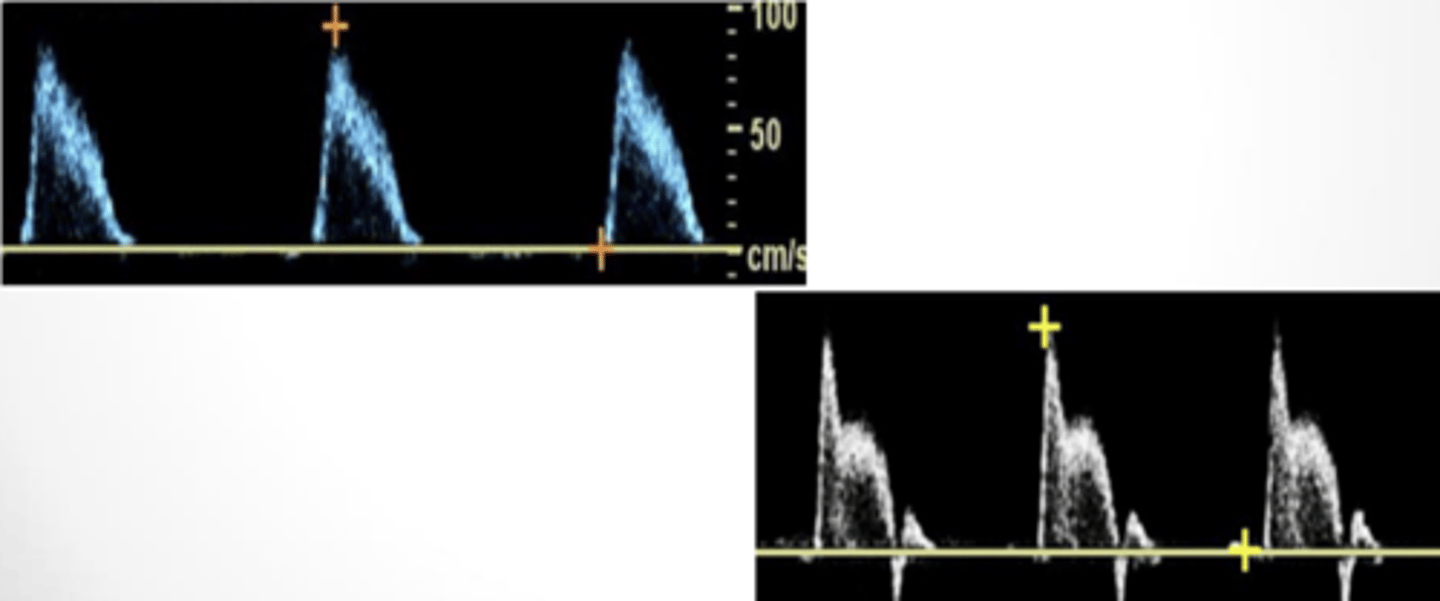
Antegrade
forward flow, normal
Retrograde
reversed flow, abnormal
Bidirectional
both forward and reversed
Absent
flow not present
Antegrade
Retrograde
Bidirectional
Absent
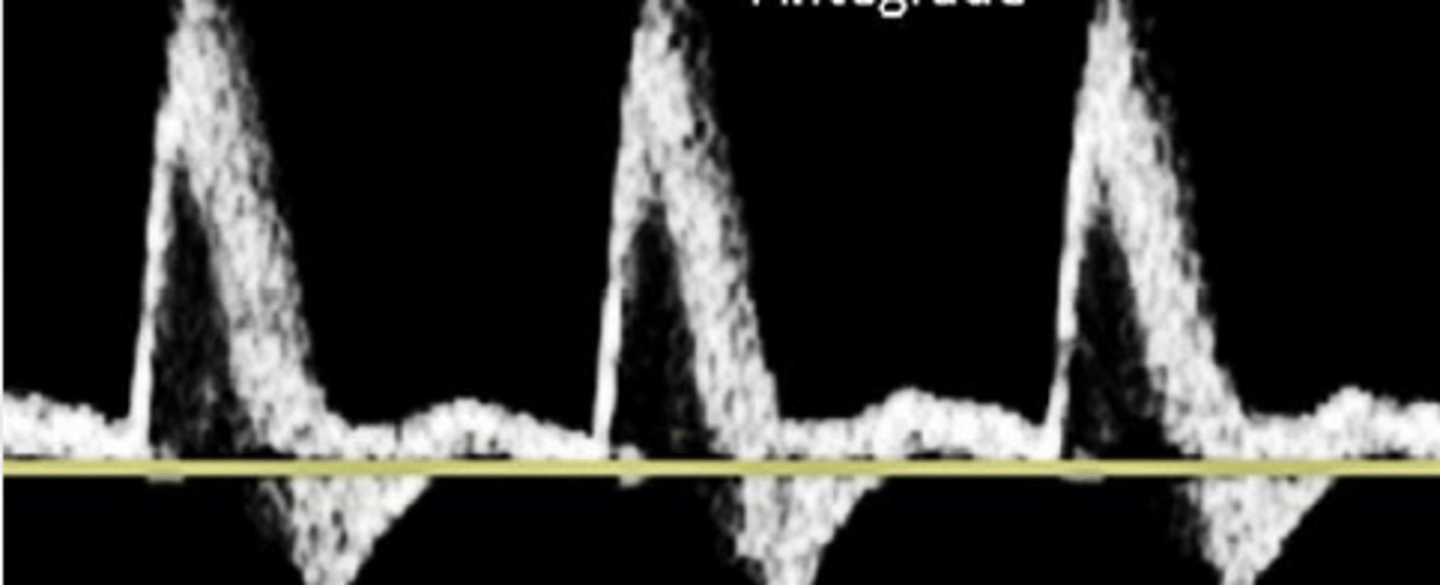
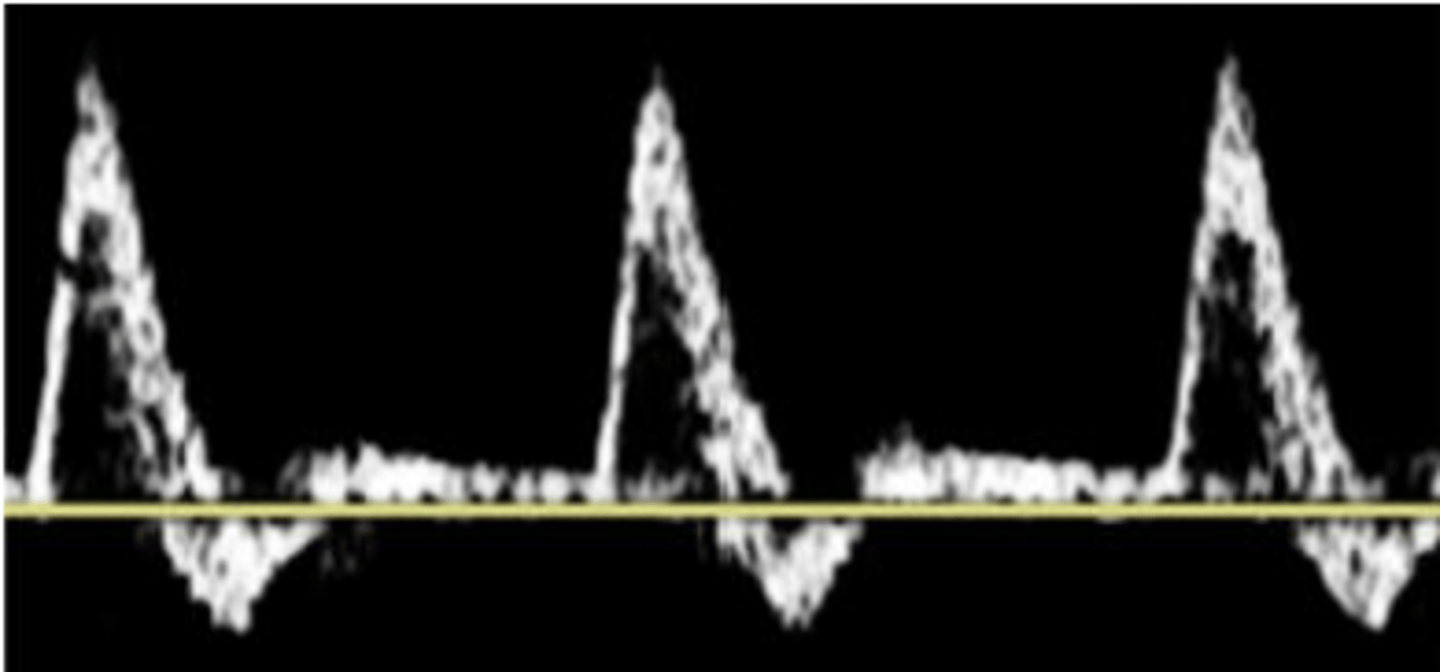
Phasicity
changes in flow direction
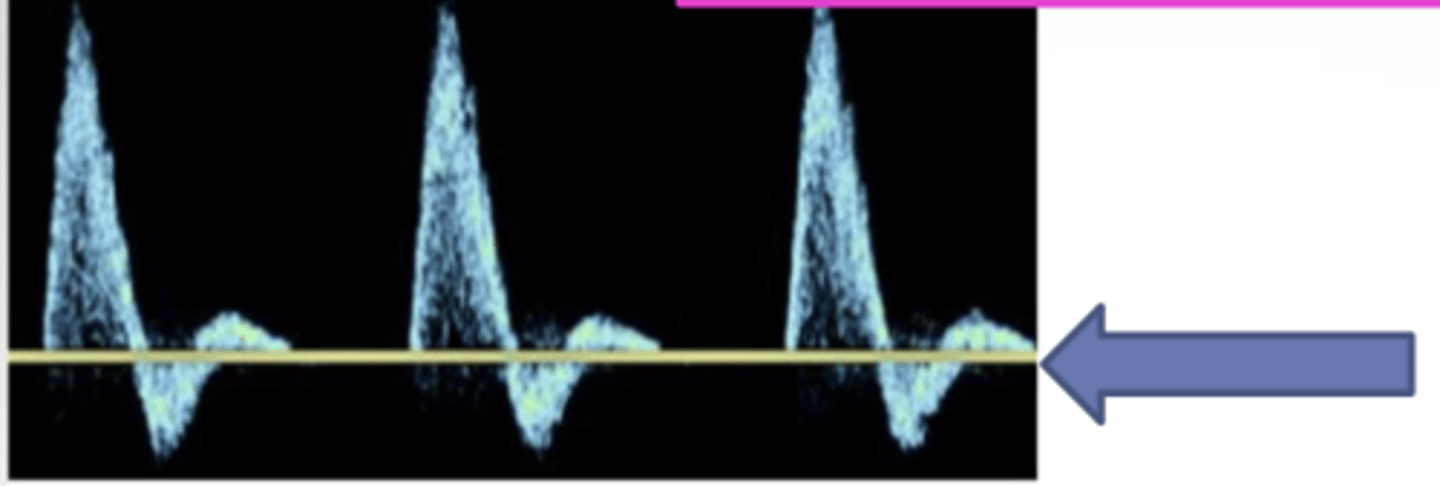
Multiphasic
crosses the baseline and has forward and reversed flow components
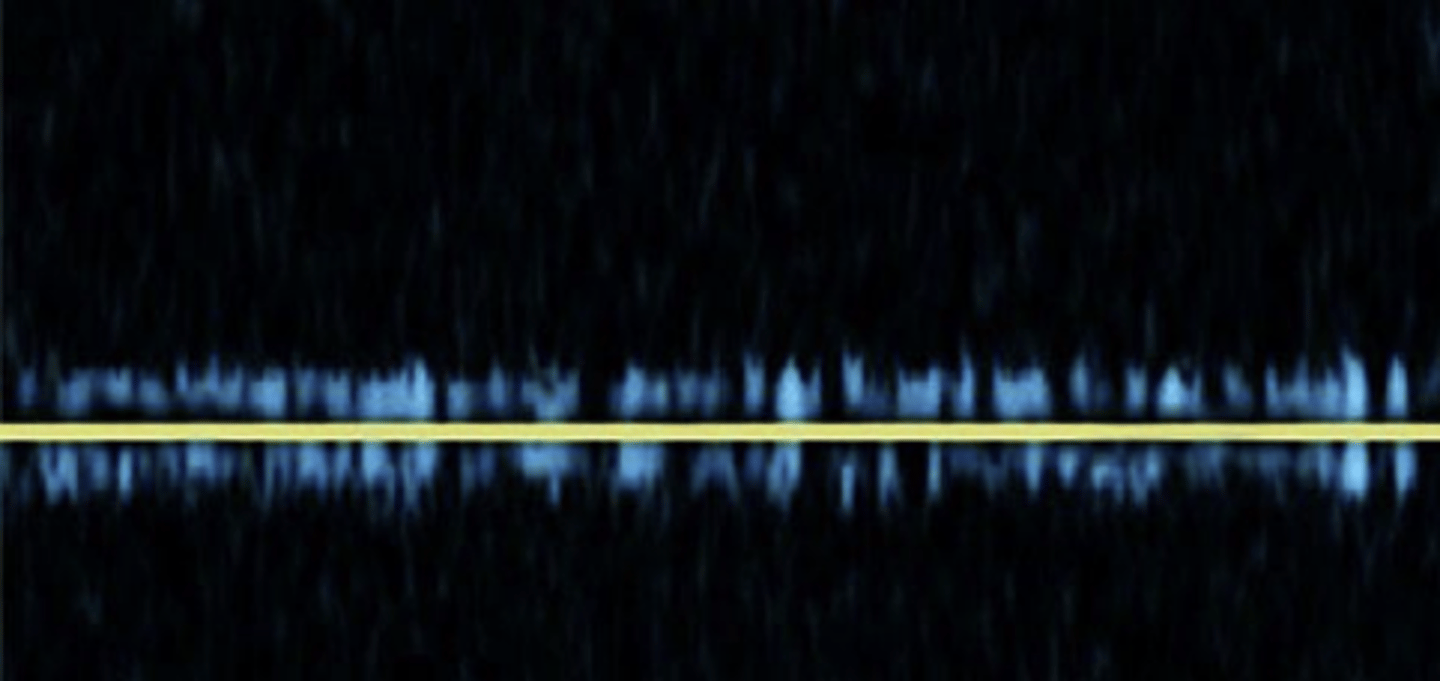
Monophasic
does not cross baseline and has continuous forward flow
Zero Baseline
Multiphasic
Monophasic
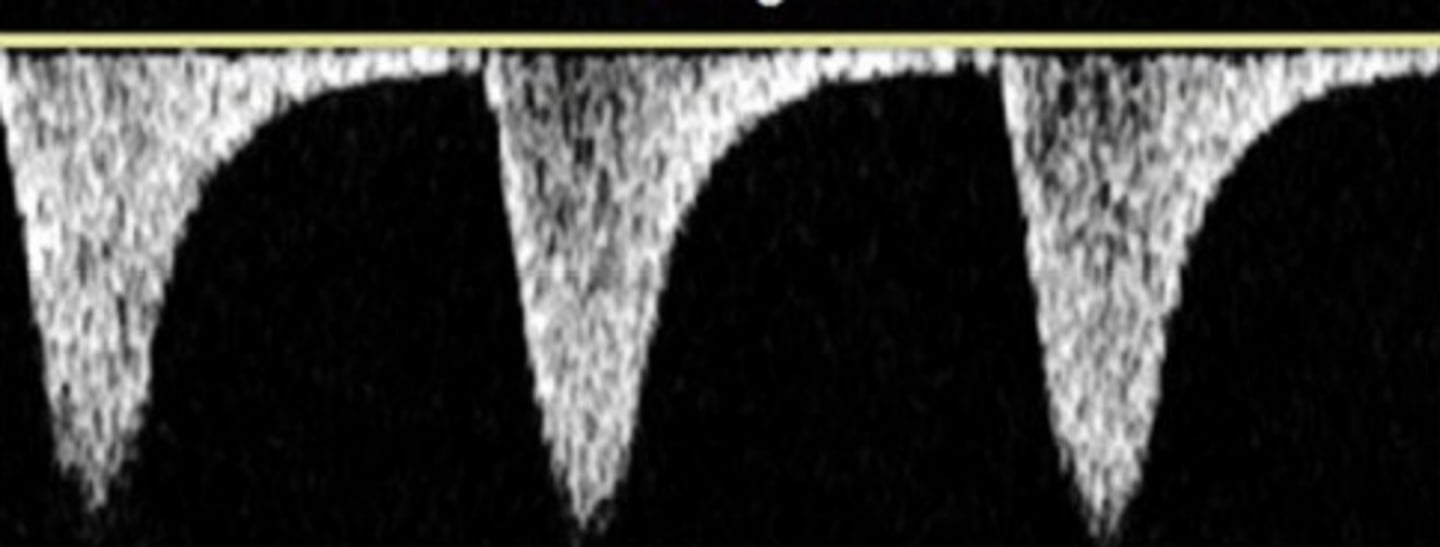
Resistance
any type of impediment to flow
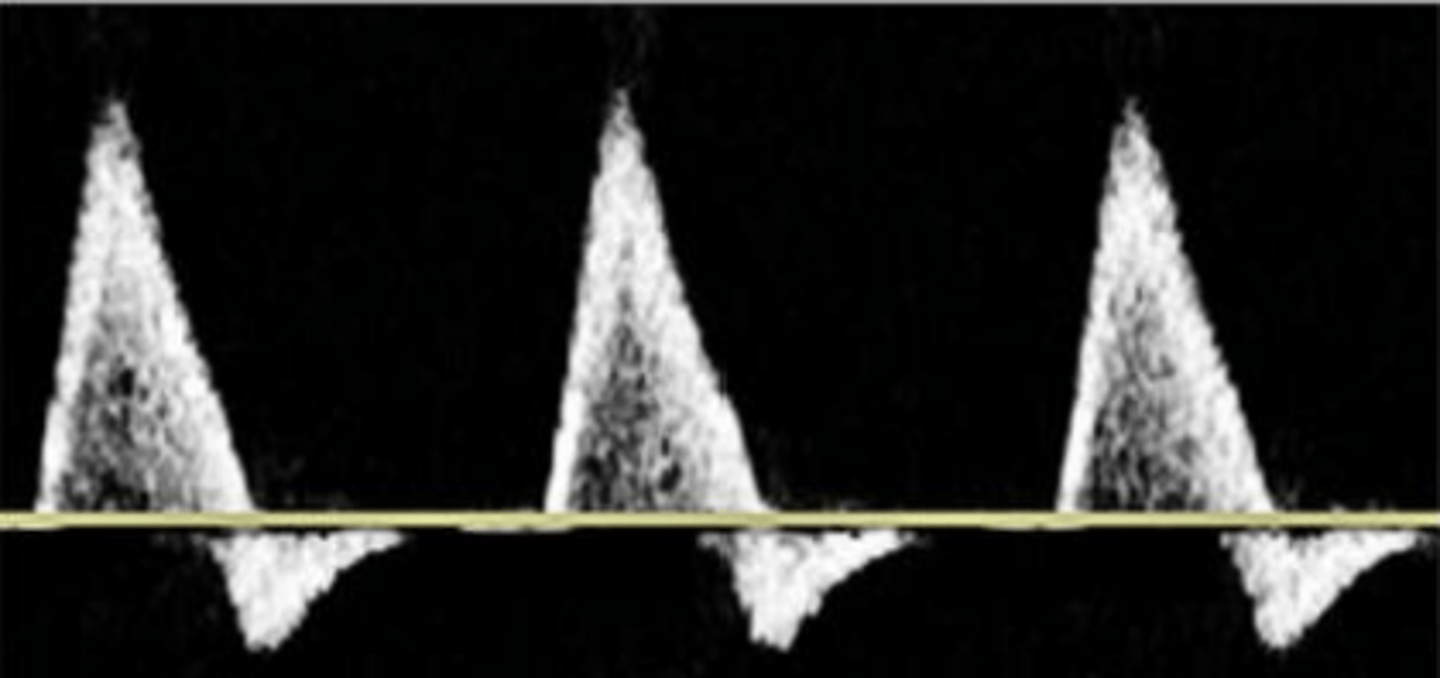
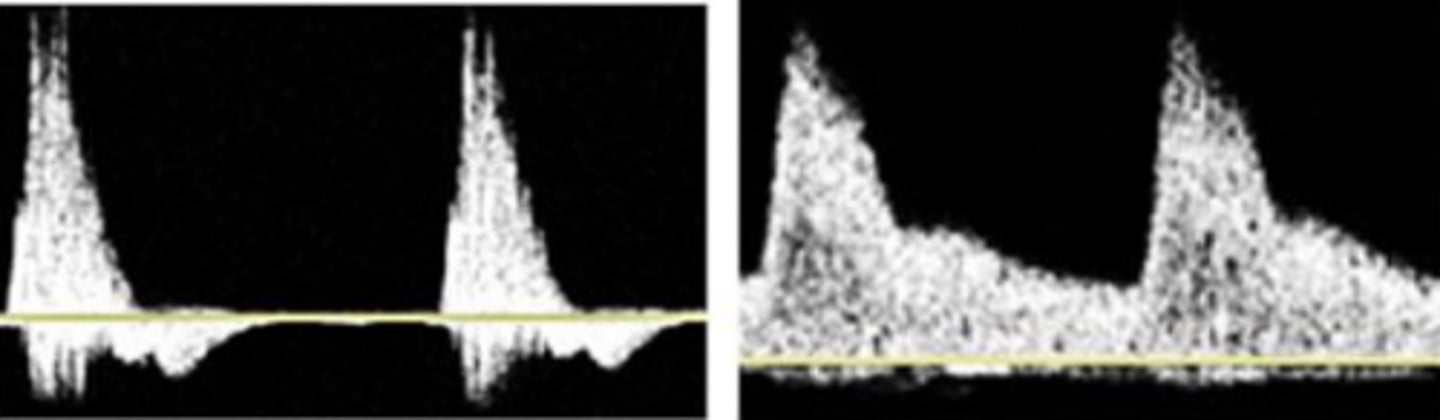
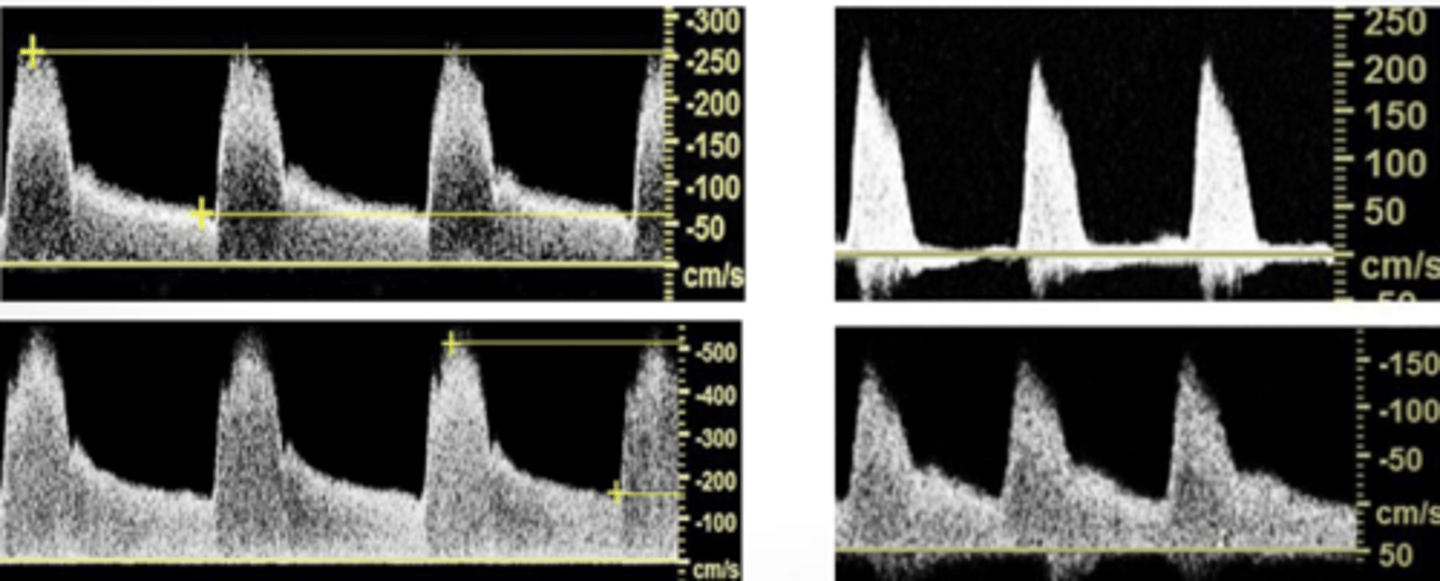
High Resistance
sharp upstroke/brisk downstroke
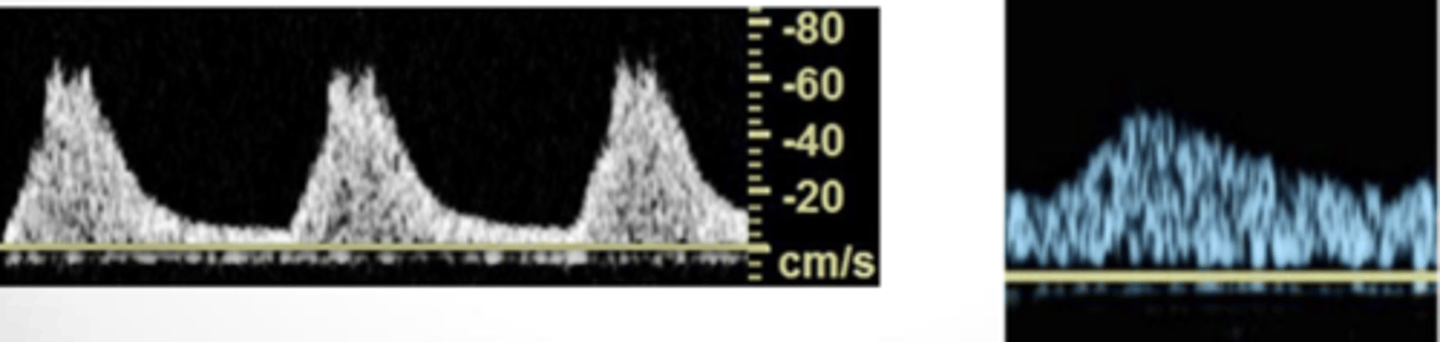
Intermediate Resistance
-sharp upstoke/brisk downstroke
-forward flow throughout
-end systolic notch
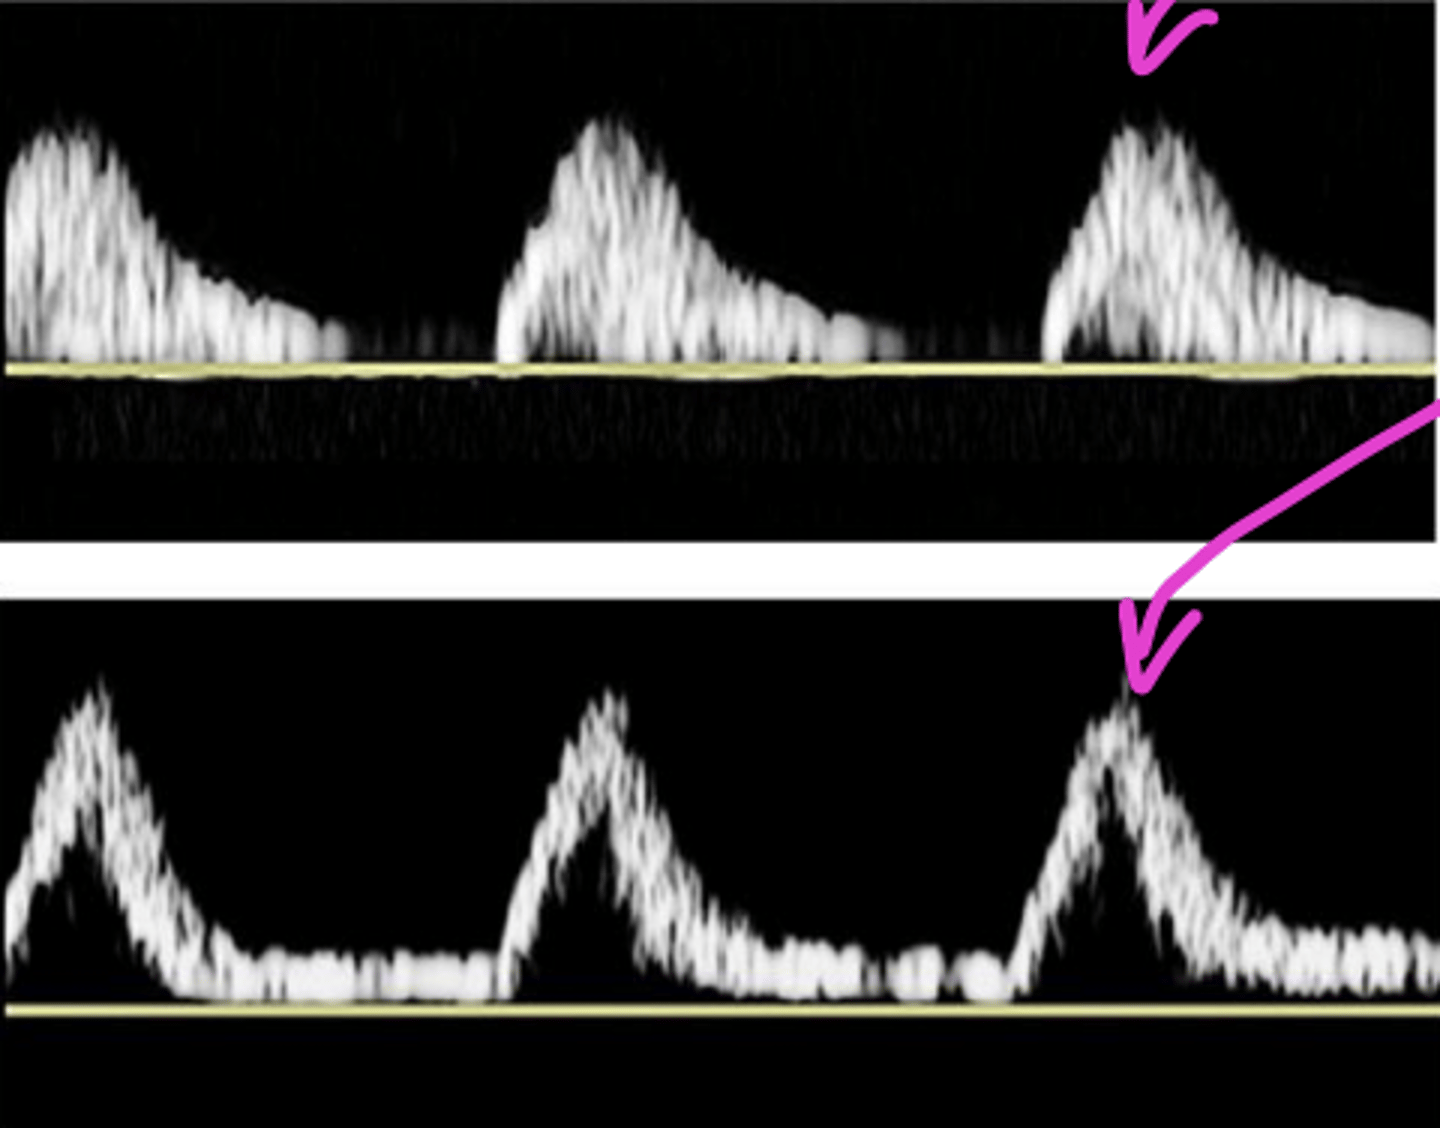
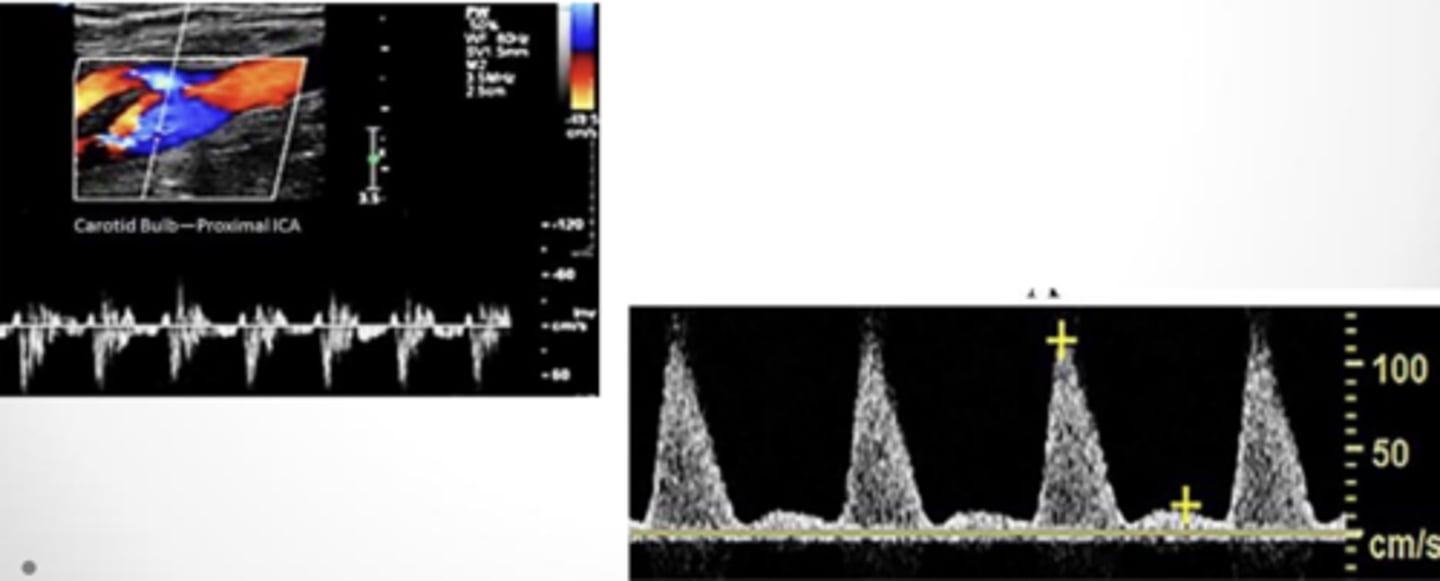
Low Resistance
broad downstroke and continual flow through out diastole
High Resistance
Intermediate Resistance
Low Resistance
Normal High Resistance
-infra renal aorta, CIA, EIA, IIA
-SMA/IMA Fasting
-CFA, DFA, SFA, Pop, ATA, PTA, Pero
-subclavian, axillary, brachial, radial, ulnar
-external carotid
Normal Intermediate Resistance
-supra renal aorta
-common carotid
Normal Low Resistance
-celiac, renal, SMA, IMA post prandial
-internal carotid, vertebral artery
-hepatic and splenic arteries
Laminar/Parabolic Flow
-faster in the middle/slower at the sides
-spectral trace is narrow during systole (blood cells accelerate together at similar velocites)
-spectral trace is thicker during diastole (blood cells are slowing down and do so at various velocites)
-anechoic spectral window
Laminar/Parabolic Flow
Spectral Broadening
-disruptive flow pattern
-indicative of disturbed or turbulent flow
-sample gate next to wall
-wide sample gate
-increased doppler gain
-filled in spectral window
Spectral Broadening
Dampening/Tardus Parvus
-upstroke/downstroke equal
-overall low velocities
-never normal (indicated stenosis proximal to insonation site)
Dampening/Tardus Parvus
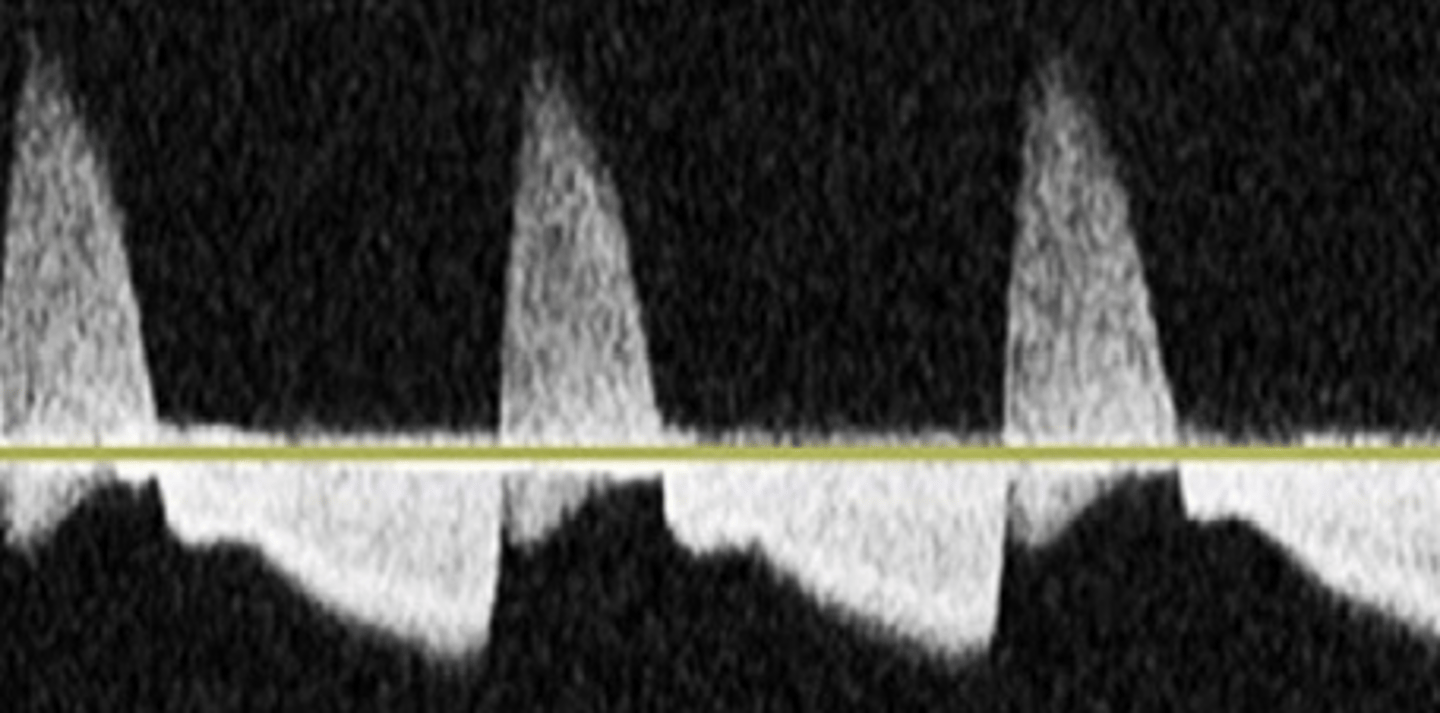
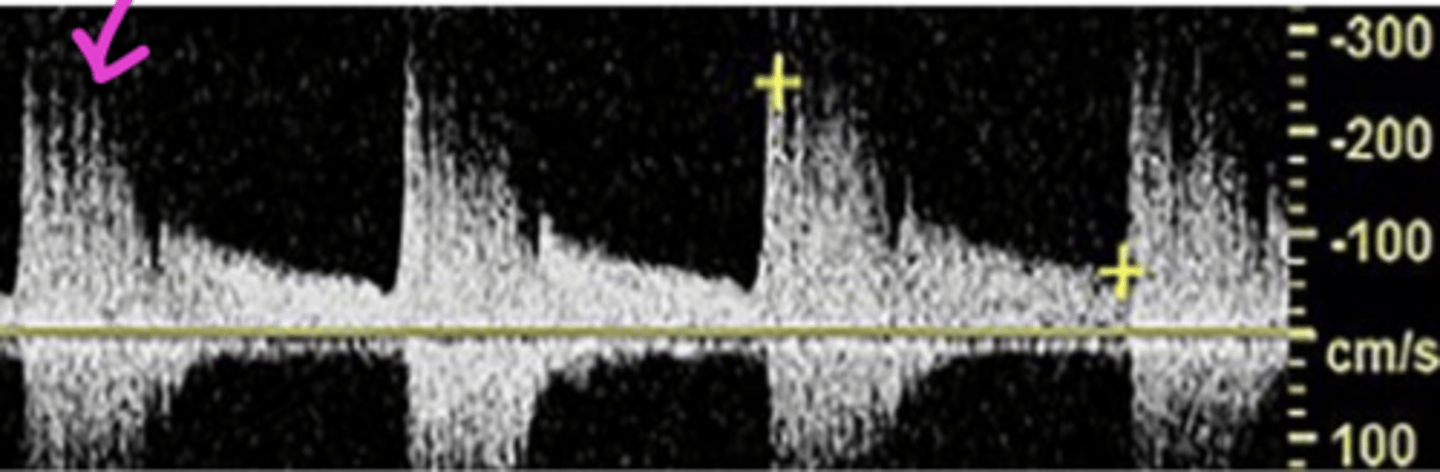
Turbulence
-forward and reversed (bidirectional) flow
-marked spectral broadening
-variable velocities
-post stenosis
Turbulence
Disturbed/Flow Separation
-flow lines are slightly disrupted
-bulb, bifurcation, noncritcal stenosis
Disturbed/Flow Separation
Flow Jet
-maximum flow velocities across a narrowed segment
-velocity is correlated to the percentage of narrowing
-tightly narrowed segment = high velocities
Flow Jet
Occluded Flow
no flow present due to occlusion of artery
Occluded Flow