Bio 1B Midterm 2
1/109
There's no tags or description
Looks like no tags are added yet.
Name | Mastery | Learn | Test | Matching | Spaced | Call with Kai |
|---|
No analytics yet
Send a link to your students to track their progress
110 Terms
Ecology
The study of the relationship between organisms & their environment. It looks at how living things interact with each other and with non-living elements like water, soil, and climate.
Population
a group of individuals of the same species living in a particular area
Community
all the different populations of species living and interacting in a particular area
Ecosystem
a community of living organisms plus the non-living elements of the environment interacting together
Biosphere
The global sum of all ecosystems; all regions of Earth where life exists
What is Life History and some key aspects of it?
The pattern of growth, reproduction, and survival that an organism follows during its lifetime
Life history refers to the collection of traits that define a species’ life cycle and the timing of major life events.
Key life history traits:
Average lifespan
Age at first reproduction
Number & timing of reproductive episodes
Size & number of offspring in each episode
Duration & investment of parental care
Survivorship
Example: A caterpillar becomes a butterfly, showing a complex life cycle with distinct stages
Principle of Allocation
The idea that organisms have limited resources, so investing in one function (e.g., reproduction) reduces the resources available for others (e.g., growth or survival)
Principle of Allocation: Organisms have limited resources that must be divided among growth, survival, and reproduction; individual organisms have a limited amount of resources to invest in different activities & functions
Examples of resource allocation:
Animals: foraging, breeding, allocating biomass to offspring, caring for offspring
Plants: allocating biomass and nutrients to different parts (roots, stems, leaves, flowers, seeds)
What is a Trade-off & what are the types of reproduction trade-offs?
A situation where investing in one activity limits the ability to invest in another
Resources invested in one function cannot be used for another (trade-off)
Size-number trade-off: Species can produce many small offspring or a few large offspring
Costs of reproduction: Investing heavily in reproduction one year may reduce the ability to reproduce in future years
What is Survivorship, and what are the different survivorship curve variations?
The proportion of individuals in a population that survive to a certain age
Survivorship measures the fraction of individuals surviving to a certain age. There are 3 main types:
Type I curve: most individuals reach old age (e.g., humans)
Type II curve: some individuals reach old age (e.g., squirrels)
Type III curve: very few individuals reach old age (e.g., plants)
Fast-slow continuum
A spectrum describing how species balance growth, reproduction, and survival, from “fast” (short-lived, early reproduction) to “slow” (long-lived, delayed reproduction)
Fast species:
Short lifespan
Early reproduction
Many offspring
Less parental care
Often small
Slow species:
Long lifespan
Late reproduction
Fewer offspring
More parental care
Often large
This continuum is a helpful guideline, but exceptions exist, & life histories can be more complex.
Explain the nested relationships among populations, species, communities, & ecosystems
Populations, species, communities, and ecosystems are nested levels of biological organization. Populations are groups of individuals of the same species living in an area. Multiple populations of different species form a community, and when a community interacts with its environment, it creates an ecosystem.
Interpret life history tables and survival curves, & compare & contrast key features of life histories
Life history tables and survival curves show how many individuals survive and reproduce at different ages. Type I curves have most individuals living to old age, Type II curves have constant survival, and Type III curves have high early mortality. Life histories vary: “fast” species live short lives, reproduce early, and have many offspring, while “slow” species live long, reproduce later, and have fewer offspring with more care.
Interpret examples of life history trade-offs resulting from variation in allocation of acquisition of resources, and explain how these lead to diversity in life history strategies in variable environments
Trade-offs occur because organisms have limited resources. Investing more in one function, like reproduction, means less for others, like survival or growth. These trade-offs create diverse life history strategies that allow species to succeed in different environments.
What is immigration and emigration?
Immigration - Individuals moving into a population
Emigration - Individuals moving out of a population
B-D Model
B-D model - Population model considering ONLY births & deaths
(Birth–Death Model)
The B–D model is a simpler version used when migration is ignored. It assumes the population is closed, meaning no individuals move in or out.
It only considers:
B – Births
D – Deaths
Population change is therefore:
Population change = Births − Deaths
ΔN = change in population size
Nₜ = population size at the current time
Nₜ₊₁ = population size at the next time step
Example:
If N = 100, with
12 births
7 deaths
Then:
ΔN = 12 − 7 = 5
New population = 105.

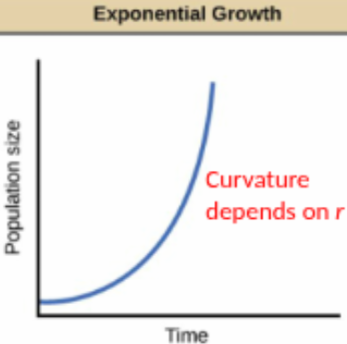
Exponential Model. What are the 2 equations and what do they mean? What do the different r options mean?
Population grows continuously at a constant per-capita rate (r) with no density limits.
Assumptions
Every individual has the same chance of reproducing or dying.
Birth and death rates are constant over time.
These rates do not depend on population size (no density dependence).
Intrinsic Growth Rate (r)
r = birth rate − death rate
Units: time⁻¹
r > 0 → population increases
r = 0 → population stays constant
r < 0 → population decreases
Each individual contributes r new individuals per unit time on average, regardless of population size.
Example: E. coli reproducing by binary fission.
Limitation
Exponential growth cannot continue forever because in real populations:
Resources become limited
Competition increases
Disease spreads more easily
As population density increases, growth eventually slows.
Exponential Growth Equations:
1. Instantaneous Growth Equation (Rate of Change) is dN/dt = rN
This equation describes how fast the population size is changing at a specific moment in time.
Variables:
N = population size
r = intrinsic growth rate (birth rate − death rate)
dN/dt = rate of population change over time
The larger the population (N), the faster it grows, because more individuals are reproducing.
2. Population Size Over Time is Nₜ = N₀ eʳᵗ
This equation predicts the population size after a certain amount of time.
Variables:
Nₜ = population size at time t
N₀ = initial population size
r = intrinsic growth rate
t = time
e = Euler’s number (~2.718)
Relationship Between the Two
dN/dt = rN → describes the rate of growth at a moment in time
Nₜ = N₀ eʳᵗ → describes the population size after time t
Both describe exponential population growth when r is constant and there are no density limits.
For exponential growth, the slope of the line (on a logged y-axis scale) is the value of r.
So, these are NOT included in the exponential model: Immigration, Emigration, Negative density dependence, & Positive density dependence
Birth and death occur continuously, rather than in discrete units of time
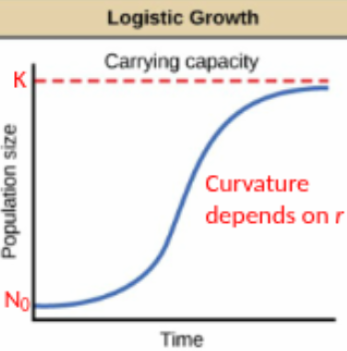
Logistic Model
Logistic growth = population grows fast when small, slows as resources limit growth, and stops at carrying capacity K, producing an S-shaped curve.
Key Parameters
r = intrinsic growth rate
Determines how fast the population grows when it’s very small
Constant
K = carrying capacity
Maximum population size the environment can sustain
Population equilibrium occurs at N = K
How It Works
Small population (N ≪ K): growth is fast, similar to exponential growth
Population grows: growth rate slows because of density dependence
Population reaches K: growth stops (dN/dt = 0), population at equilibrium
Shape: S-shaped growth curve
Equation
dN/dt = rN (1 − N/K)
Where:
N = population size at time t
dN/dt = rate of population change
r = intrinsic growth rate
K = carrying capacity
(1 − N/K) represents density dependence: growth slows as N approaches K.
Per capita population growth rate
The per capita population growth rate tells you how much each individual contributes to population growth on average.
So it standardizes growth, allowing you to compare populations of different sizes.
Example:
Population A grows by 100 individuals
Population B grows by 100 individuals
That sounds the same — but if:
Population A has 10,000 individuals
Population B has 200 individuals
then Population B is growing much faster per individual.
The formula is:
Per capita growth rate = (1/N)(dN/dt)
N = population size
dN/dt = total population growth rate (how fast the population is changing)
(1/N) = dividing by the population size to get growth per individual
So the equation means:
population growth per individual = total growth ÷ population size
You use per capita growth rate when:
Describing exponential growth
In exponential growth:
(1/N)(dN/dt) = r
meaning the per capita growth rate equals r, and it stays constant.
Comparing populations of different sizes
Understanding density effects
In logistic growth, the per capita growth rate decreases as population size increases.
Quick Example
Population size: N = 100
Population increases by 20 individuals per year
So:
dN/dt = 20
Per capita growth rate:
(1/N)(dN/dt) = 20 / 100 = 0.2
Meaning each individual contributes 0.2 individuals per year on average.
✅ The key exam takeaway:
In exponential growth, per capita growth rate = r (constant).
In logistic growth, per capita growth rate decreases as N increases.
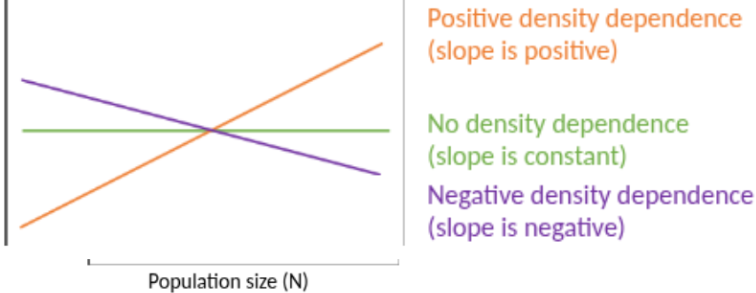
What is density dependence and the different types of it?
Density dependence - Population growth changes depending on population size. Density dependence occurs when the per capita population growth rate changes as population size (N) changes.
Step 1: Imagine a population
Say you have a forest with rabbits.
Few rabbits → lots of food, easy to find mates
Many rabbits → food is scarce, disease spreads, harder to survive
The way the population growth changes as the rabbits become more crowded is what we call density dependence.
Step 2: Three possible situations
Negative density dependence (most common)
When the population is bigger, growth slows down.
Negative density dependence = species grow faster when rare, helping them recover and coexist with others.
slope is negative
Crowding makes life harder: less food, more disease, more competition.
Example: 10 rabbits → grow fast, 100 rabbits → grow slower.
Positive density dependence
When the population is bigger, growth actually speeds up.
Small populations struggle to survive or reproduce.
Example: 2 wolves → hard to hunt and mate, 20 wolves → easier hunting and mating.
No density dependence
Crowding doesn’t matter.
Each individual contributes the same to growth no matter how many there are.
Example: bacteria in unlimited nutrients in a lab — growth is constant.
Step 3: Super simple visual
Type | Line shape | Growth trend |
|---|---|---|
Negative | Slopes downward | Growth slows as population grows |
Positive | Slopes upward | Growth faster as population grows |
None | Flat line | Growth stays the same |
✅ Key Idea:
Density dependence = does crowding affect how fast a population grows?
Negative: Yes, slows growth
Positive: Yes, speeds growth
None: No, doesn’t affect growth
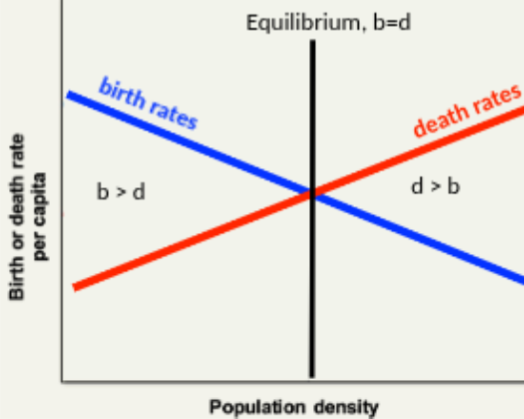
Equilibrium population size
Equilibrium population size - Population size where births = deaths. A population is at equilibrium when its size stops changing.
Key Idea
Population growth = 0
Occurs when per-capita birth rate = per-capita death rate
Equation
(1/N)(dN/dt) = 0
Where:
N = population size
dN/dt = total change in population
At equilibrium: growth per individual = 0
How It Happens
Birth rates usually decrease as population size increases (negative density dependence)
Death rates usually increase as population size increases (positive density dependence)
The intersection of these two rates determines the equilibrium population size.
A population is at equilibrium when births equal deaths, so per-capita growth is zero, usually due to density-dependent births and deaths.
Carrying capacity (K)
Carrying capacity (K) - Max population size the environment can support
A population is considered at equilibrium when N = K
K is NOT a variable
K is the largest population size that a population can maintain over time
Intrinsic growth rate (r)
Intrinsic growth rate (r) - The population’s maximum possible growth rate when there are no limiting factors
Key Notes
r > 0 → population growing
r = 0 → population stable
r < 0 → population shrinking
In logistic growth, r is still calculated the same way, but density dependence reduces actual growth as N approaches K.
✅ Shortcut to remember:
r = b − d if you know births and deaths per individual
r = ln(Nt / N0) / t if you know population sizes over time
Population fluctuation
Population fluctuation - Population size rises & falls over time due to environmental variation
Real populations often do not follow perfect models
They can rise & fall over time due to changing conditions
BIDE Model & what are the 4 processes that affect population size?
The BIDE model explains how the size of a population changes over time. The name comes from the four processes that affect population size:
B – Births: new individuals are born into the population
I – Immigration: individuals move into the population from elsewhere
D – Deaths: individuals die
E – Emigration: individuals leave the population
Population change is calculated as:
Population change = Births + Immigration − Deaths − Emigration
So the BIDE model tracks all ways individuals can enter or leave a population.
ΔN = change in population size
Nₜ = population size at the current time
Nₜ₊₁ = population size at the next time step
Example:
If a population starts with N = 100, with
10 births
5 immigrants
8 deaths
2 emigrants
Then:
ΔN = 10 + 5 − 8 − 2 = 5
New population = 105.
Density-Independent Effects
N is limited by something unrelated to the size of the population
Population changes happen regardless of population size
Examples:
Natural disasters
Extreme weather
Volcanic eruptions
The Chaitén volcano eruption damaged forest tree populations.
Competition & the Types of competition
Competition - A & B both try to acquire the same limited resource
Competition = when 2 or more individuals share a resource, & consumption by 1 reduces its availability for others, causing reduced growth, survival or fecundity
Intraspecific competition = competition between individuals of the same species
The mechanism behind density-dependent population growth
Ex: Southern elephant seal males competing with each other for scarce mates
Interspecific competition: competition between individuals of different species
Ex: Lions competing with hyenas for scarce prey
Exploitation competition (a type of Indirect interaction): 2 predators share the same prey → better predator harms the other
Ex: fox & coyote competing for rabbits.
What is predation? How does predation impact prey? What are some prey defence mechanisms?
Predation - A kills B
Predators often reduce prey abundance
Prey strategies:
Defend physically:
Ex: turtle shell, plant thorns, porcupine spikes
Defend chemically:
Ex: posin dart frogs, skunks, coffee caffeine, tobacco nicotine
Escape:
Ex: Some moths avoid bat predators by evolving ears to detect bats’ ultrasonic echolocation and drop to the ground, or by developing organs or wing scales that jam or absorb bat sonar
Avoid by mimicry:
Dishonest mimicry - A palatable (edible) species evolves to look like an unpalatable or harmful species to avoid being eaten
Honest mimicry - An unpalatable or harmful species has warning signals (like bright colors) that truthfully indicate it is dangerous or bad to eat
Fight back
Herbivory. Pros & cons?
Herbivory - A eats B (a plant), may or may not kill B
1 species eats part (or all) of another species, which is a plant
Plant may or may not die, so herbivory is sometimes but not always predation
Herbivores eating plants typically harms the plants
BUT sometimes beneficial…
Animals eat seeds but also disperse them
Removes dead tissue: grazing can reduce disease
Stimulates growth: damage can trigger regrowth/reproduction
Parasitism
Parasitism - A lives on/in B, may or may not kill B
REMEMBER: “all parasites are pathogens, but not all pathogens are parasites”
Pathogen = disease-causing organism or agent (bacteria, virus, fungus, parasite).
Fungal interactions can shift from mutualism to parasitism depending on resources
Ex: Soybean gives carbon to fungi; fungi provide nutrients only if needed. With fertilizer, fungi may take carbon without benefit → parasitism
Mutualism
Mutualism - A and B help each other
Can pollinate plants, disperse seeds, defend partners, gather nutrients, help digest food, photosynthesize, or provide habitat
Ex: Acacia (a tree) that gets protection from herbivores because ants attack intruders, & ants get a home & food
Commensalism
Commensalism - B helps A, no impact on B
Some apparently commensal relationships may actually be mutualistic/competitive/etc.
Ex: a remora & its host, a zebra shark; remora benefits by not having to swim & hark does not seem to be affected
Facilitation
Facilitation - General term for either mutualism or commensalism
Typically not specified if the 2nd species is impacted, but often the impact is positive
Ex: In harsh environments, some plants create shade & keep soil moist, allowing other plants to grow nearby
At low stress (low elevation) → plants may compete for resources
At high stress (high elevation) → plants may help each other survive (facilitation/mutualism)
Defense
Prey strategies:
Defend physically:
Ex: turtle shell, plant thorns, porcupine spikes
Defend chemically:
Ex: posin dart frogs, skunks, coffee caffeine, tobacco nicotine
Escape:
Ex: Some moths avoid bat predators by evolving ears to detect bats’ ultrasonic echolocation and drop to the ground, or by developing organs or wing scales that jam or absorb bat sonar
Avoid by mimicry:
Dishonest mimicry - A palatable (edible) species evolves to look like an unpalatable or harmful species to avoid being eaten
Honest mimicry - An unpalatable or harmful species has warning signals (like bright colors) that truthfully indicate it is dangerous or bad to eat
Fight back
Dishonest/honest mimicry
Dishonest mimicry - A palatable (edible) species evolves to look like an unpalatable or harmful species to avoid being eaten
Honest mimicry - An unpalatable or harmful species has warning signals (like bright colors) that truthfully indicate it is dangerous or bad to eat
Exploitation competition
A type of indirect competition where organisms compete by using up the same limited resources, without directly interacting or fighting.
How it works
Each individual reduces the availability of a resource (e.g., food, water, nutrients).
Other individuals get less of that resource, even if they never directly encounter each other.
Example:
Two plants growing near each other absorb the same soil nutrients.
One plant doesn’t physically attack the other, but by taking nutrients, it reduces the growth of its neighbor.
Why it’s an indirect interaction
The effect on one species occurs through the shared resource, not through direct contact.
In contrast, direct competition (interference competition) involves fighting, blocking, or aggressive behavior.
Indirect mutualism
A type of indirect positive interaction where species benefit each other through a shared predator or herbivore.
How it works
Some species are less tasty to the predator.
Predator eats a mix of tasty and less tasty species.
This reduces the number of tastier species eaten, helping them survive.
The less tasty species also survive because they aren’t completely eaten.
Example:
Three wildflower species eaten by deer
Less tasty flowers reduce how much deer eat the tastier ones
All species benefit indirectly
Indirect mutualism = species help each other survive by sharing a predator, where less tasty species reduce predation on tastier species.
Interaction network
Species interact in networks, not just in pairs
Interaction network: diagram showing arrows between species with direct pairwise interactions
Complex networks: multiple species interact directly & indirectly
Ex: Milkweeds & monarchs:
Milkweeds produce toxic cardiac glycosides → most herbivores avoid it
Monarchs sequester toxins, specialize on milkweeds, pass toxins into adult stage
Milkweeds are mostly pollinated by bumblebees, partially by monarchs
Bumblebees are prey for birds and mammals
What are species interactions?
Definition 1: an individual of species A influences the behavior or life events of an individual of species B
Definition 2: an individual of species A influences the growth, survival, or reproduction of an individual of species B
Definition 3: a population of species A influences the growth rate (dN/dt) of a population of species B
What are all of the Types of Pairwise interactions?
Competition, predation, Herbivory, mutualism, Commensalism, Facilitation, & Parasitism
What kinds of interactions can be + for one species and – for the other species?
Predation, herbivory, & parasitism
Community & the outcomes
Community: multiple species living in the same place at the same time and potentially interacting.
Does not include the abiotic environment (that would be an ecosystem).
Often restricted to a single type of organism, e.g. ‘the plant community’ or ‘the microbial community’ but could include many different types of organisms
The spatial extent of a community can be clear (a pond, for fish)) or unclear (how big is a tree community in a forest?)
Outcomes: coexistence or extinction
Coexistence
When several species live together in the same area over time, even if their populations fluctuate.
Key Points
Populations can vary in abundance (some common, some rare).
Coexistence ≠ perfect stability; species numbers can rise and fall.
Example: Hutchinson’s “paradox of the plankton”
Many plankton species coexist in lakes and oceans
Surprising because competition should favor only the best species
Coexistence = multiple species live together over time, even if populations fluctuate; not necessarily stable.
Scarcity
When a resource is limited in an environment, meaning there is less available than what organisms need.
Key Points
Scarce resources limit population growth and survival.
Can be abiotic (water, sunlight, nutrients) or biotic (food, mates, territory).
Leads to competition between organisms.
Example:
Limited water in a desert means only some plants and animals can survive.
Few nesting sites can cause birds to compete for space.
Scarcity = a resource is limited, causing competition and affecting survival or growth.
Fundamental / realized niche
Ecological Niches:
Species coexist when they use different ecological niches
Fundamental Niche:
The full range of conditions/resources where a species could maintain a stable population in the absence of other species; niche limits are based on physiological tolerance limits and resource needs
Realized Niche:
The real/actual niche
The actual conditions/resources a species uses when other species are present
Usually smaller than the fundamental niche because of competition or predation
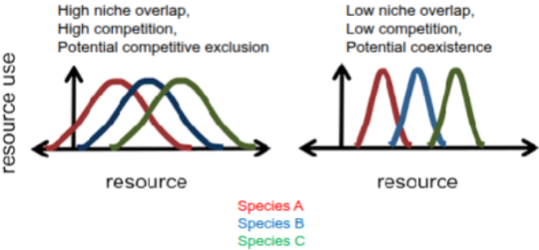
High niche overlap → high competition
Low niche overlap → low competition
When can a realized niche be larger than a fundamental niche?
A realized niche is usually smaller than the fundamental niche, but it can be larger if interactions with other species (like mutualism) or release from predators allow the species to use more resources than it normally could.
for example for organisms that depend on others to exist (e.g. symbionts), or that are able to use more habitats than they would otherwise (e.g. plants in the desert that rely on other larger plants for shade/cooling)
Niche partitioning / overlap
Species reduce competition by using different parts of the environment or resources
More niche partitioning → less competition → greater coexistence (usually)
Ex: Warblers (Robert MacArthur)
5 bird species forage in the same trees
Fundamental niche: all could forage anywhere in the tree
Realized niche: each species feeds in different tree sections
This reduces competition and allows coexistence
Niche overlap can indicate the strength of resource competition.
Niches can include environmental or resource variables.
Under the competitive exclusion principle, two species occupying the same niche cannot coexist over time in the same community.
Predator/prey system. What are the 3 possible outcomes?
Species do not share a resource – one is the resource for the other!
3 Possible Outcomes:
Predator eats all prey → prey goes extinct → predator goes extinct (0 species).
Predator cannot find enough prey → predator goes extinct → prey increase (1 species)
Predator and prey coexist (2 species)
Ex: Lynx & Snowshoe Hare
Populations show cycles: Prey increases → Predator increases later → Prey decreases → Predator decreases
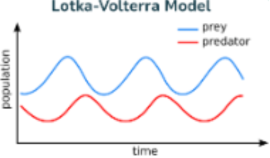
Lotka–Volterra Predator–Prey Model & Cycles
Explains predator-prey cycles
Pattern:
Low prey → predators decline
Low predators → prey increase
High prey → predators increase
High predators → prey decline
This repeating pattern allows coexistence
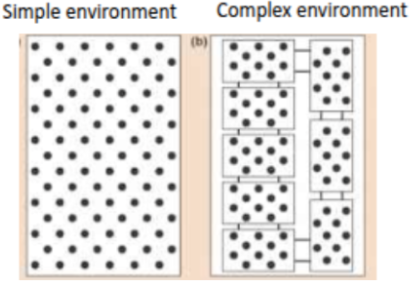
Spatial refuge. What are simple & complex environments?
Spatial refuges: A physical place where a species can escape predators or competitors
Allow rare species to recover; enable prey to ‘bounce back’ from rarity & increase their population size
Carl Huffaker’s Mite Experiment:
Predatory mites & prey mites lived on oranges
Simple environment:
Few oranges
No hiding places
Predator kills prey → predator later goes extinct
Complex environment:
Many oranges
Prey can disperse & escape
Both predator & prey coexist
Disturbance
Disturbance: A change in biotic or abiotic conditions that alters a community. Occur constantly.
Ex: wildfire, weather changes, species introductions, extinctions, doctors prescribing antibiotics
Succession follows disturbance
What is succession & primary/secondary succession
Succession: Predictable changes in species composition after disturbance
Primary Succession: following a disturbance, the community becomes empty, or approximately empty; killing every one
Species must immigrate from elsewhere to repopulate area
Ex: volcanic eruptions, glacial retreat
Agriculture mimics human-controlled primary succession.
Farmers: Disturb fields regularly, Plant desired crops, Prevent other species with herbicides/pesticides, Repeat yearly to prevent competition
Secondary Succession: following disturbance to an existing community, populations decline or only individuals of some life stages survive (e.g. seeds, spores). Much more common.
Initially-arriving species (early-successional) are outcompeted by later-arriving (late-successional) species
Early species may facilitate late species by improving soil nutrients
Like people got to a party early & called their friends to come because it’s a good party; changing the process
Character Displacement
Character Displacement: 2 species occurring in sympatry ending up with different phenotypes; species evolve different traits when living together to reduce competition.
Ex: Darwin’s finches evolving different beak sizes.
Evolutionary response driving a reduction in competition.
Immigration impact on coexistence
Immigration Can Promote Coexistence:
New species entering a community can help maintain diversity
Ex: Tropical forests with 1000+ tree species coexist partly due to constant immigration
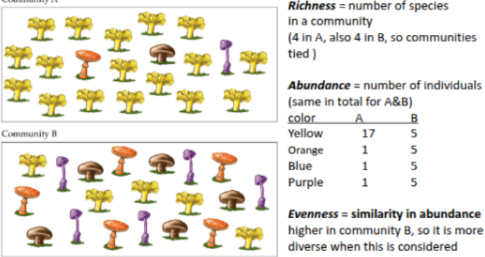
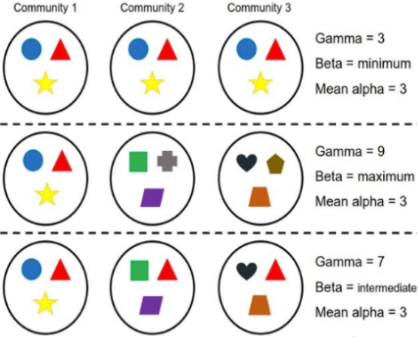
Species richness / evenness / composition
1. Species Richness
Definition: Total number of species in a given area.
Scale examples:
Alpha (α): Local site
Beta (β): Difference between sites
Gamma (γ): Entire region
2. Species Evenness
Definition: How similar the abundances (# of individuals (either total, or per species)) of different species are.
High evenness: Species are roughly equally common
Low evenness: A few species dominate
3. Species Composition
Definition: Which species are actually present in a community. (what it is composed of)
Focuses on identity, not number or abundance
Analogy:
Individuals = candies
Species = candy colors
Evenness = how many of each color
Composition = which colors are in the bowl
Richness = how many species, Evenness = how equally common they are, Composition = which species are present.
Alpha/beta/gamma diversity
Alpha (α) diversity: Number of species in a local site (think of alpha wolf; like a pack in one site)
Gamma (γ) diversity: Total number of species across all sites (think of Gram; like all of the species across the distance between us)
Beta (β) diversity: Difference between alpha & gamma; difference in species between local sites (shows species turnover across sites) (B in Beta like Between)
Spatial scale
Refers to the size of the area being studied when measuring biodiversity or ecological patterns.
Key Points
Spatial Grain: The smallest unit of measurement (like a 1×1 meter plot).
Spatial Extent: The total area covered in the study (like an entire forest, state, or region).
Patterns of diversity can change depending on grain and extent.
Analogy:
Grain = one pixel on your screen
Extent = your entire laptop screen
Spatial scale = the size of the area studied, with grain as the smallest unit and extent as the total area.
Species area relationship
Bigger areas usually have more species, but the increase slows down as area gets bigger.
Key Points
Sublinear = slower-than-proportional increase
Example: Doubling the area does NOT double the species; it only adds some more species.
Why bigger areas have more species:
More habitats and resources
Lower chance of extinction
Conservation tip:
One large protected area usually preserves more species than several small areas of the same total size.
Analogy:
Candy store: a bigger store has more candy types, but doubling the store size doesn’t double the types—it just adds a few more.
Species–area relationship = bigger areas have more species, but species increase slows down as area gets larger.
Island biogeography theory
Explains how the number of species on an “island” is determined by immigration and extinction rates.
Key Points
Distance from mainland:
Closer islands get more new species (higher immigration).
Island size:
Larger islands have lower extinction rates (more space and habitats).
Equilibrium richness:
Number of species stabilizes when immigration = extinction.
Note:
“Islands” don’t have to be actual islands — can be any isolated habitat (mountaintops, forest patches, lakes, urban green spaces).
Island biogeography = species richness on isolated areas depends on size, distance, and the balance of immigration & extinction.
Equilibrium richness
The stable number of species in an area when the rate of new species arriving (immigration) equals the rate of species going extinct.
Key Points
Determined by:
Immigration rate: how many new species arrive
Extinction rate: how many species disappear
Larger areas → lower extinction → higher equilibrium richness
Closer islands → higher immigration → higher equilibrium richness
Applies to islands and any isolated habitat (mountains, lakes, forest patches)
Equilibrium richness = the number of species where immigration balances extinction.
Luxury effect
Less poverty → higher alpha and gamma diversity (“luxury effect”)
Driven by redlining - Denial of mortgages/home-buying to non-white people in certain neighborhoods; subsequent inequality in public investment in urban neighborhoods
Latitudinal diversity gradient (LDG)
Species richness (# of species) is generally higher near the equator & lower near the North & South Poles
Observed across many groups of organisms
Explanations:
Tropics have more land area → more species can exist
Less stressful environments (warmer, wetter) → more species survive
More solar energy → more energy to support more species
Higher temperatures → faster mutation → more speciation
More time to evolve → no ice sheets in tropics
Historical note: LDG was absent in the deep past; diversity used to peak where land area was largest
Biodiversity patterns were very different in the Earth’s past
Antarctica had warm rainforests & no ice sheets
Longer evolutionary time → higher alpha diversity
Larger area → higher gamma diversity
Species distribution
Species Distribution (Species Range):
Species Range = the area where a species occurs.
Species distributions are shaped by multiple factors, all happening simultaneously, not step-by-step
Key Limits:
Dispersal – Can the species reach the location?
Abiotic environment – Are non-living conditions (temperature, precipitation, soil, water) suitable for survival, growth, and reproduction?
Biotic environment – Are living conditions (predators, competitors, food availability) suitable for survival, growth, and reproduction?
BTW: Humans can alter any limit & Behavior can influence dispersal & habitat use
Dispersal & Dispersal Limitations
Dispersal - Movement of individuals or gametes away from (and potentially back to) their original location
Mechanisms:
Wind (dandelion seeds)
Water (coral gametes)
Biotic vectors: ingested/excreted (birds eating seeds), stuck in fur
Limits: Behavioral avoidance (e.g., birds avoiding predators & whales avoiding ships)
Human activity can help or hinder dispersal (e.g., introducing crops or animals; colonizers bringing maize across the planet)
Ex: Cattle spread to the Americas from Europe/Africa in the 1800s, showing dispersal—not environment—limited their original range
Abiotic & Biotic & their limits
Abiotic = non-living environment (sun, water, soil)
Examples:
Temperature, sunlight, wind
Water, soil, nutrients
Rocks, pH, salinity
Abiotic Limits:
Set the extremes of a species niche (e.g., the lowest/highest temperatures a species can tolerate)
Define the fundamental niche (all conditions a species can survive).
Ex: California mussels die at high temps; temperature sets their range
Biotic = living components (plants, animals, etc.; predators, competitors, herbivores)
Biotic Limits:
Define the realized niche (where a species actually exists due to interactions)
Examples:
Herbivory: cattle reduce some plants’ distribution
Competition: 2 similar hedgehog species do not overlap in range
Mixed examples: Soil and natural waters include both living & non-living elements
Environmental gradient & the 2 types
A gradient is a gradual change in an environmental condition across space.
Species distributions change along gradients of environmental factors:
Temperature
Elevation
Storm or hurricane risk
Predation risk
Types of Gradients:
Continuous: e.g., temperature from bottom to top of a mountain
Patchy: e.g., lake edges or fragmented habitats
Biome & what largely defines biomes
Biome: a region experiencing similar environmental conditions, & therefore containing a similar ‘core’ set of species.
Species distributions overlap, creating biomes
Largely defined by climate; the Mojave and Sonoran deserts are both desert biomes
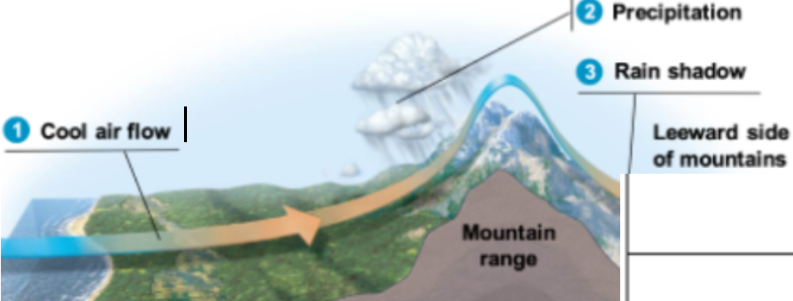
How does Elevation impact biomes?
Elevation:
Temperature decreases at higher elevations.
Low elevation has higher temperatures
Precipitation increases at high elevations on the windward side of mountains because rising air cools, causing water vapor to condense & fall as rain. After crossing the mountain, the air descends on the leeward side, becomes drier, & creates a rain shadow with little precipitation.
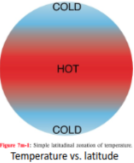
How does Latitude impact biomes?
Latitude (distance from the equator) affects climate, which helps determine which biomes occur in different regions of Earth.
Key Points
Low latitudes (near the equator):
Receive more solar radiation
Warmer temperatures and often more rainfall
Example biomes: tropical rainforests
Mid-latitudes:
Moderate temperatures and seasonal climates
Example biomes: temperate forests, grasslands, deserts
High latitudes (near the poles):
Less solar radiation
Colder temperatures and shorter growing seasons
Example biomes: tundra, polar regions
Latitude affects solar energy and climate, which determines what types of biomes occur in different parts of the Earth.
How do oceans impact biomes?… Maritime / continental climate
Oceans (Maritime vs. Continental):
Oceans buffer climate, so climate extremes are stronger in the interior of continents
Maritime climate: Oceans buffer climate → milder winters, cooler summers; less extreme temp. fluctuations
Continental climate: Interior of continents → more extreme temp. fluctuations
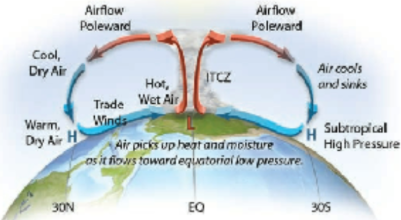
Hadley cell
A large-scale atmospheric circulation pattern near the equator that influences global temperature and precipitation patterns.
Key Points
Warm air rises at the equator, carrying moisture.
As the air rises and cools, moisture falls as heavy rainfall (tropical climates).
The air then moves north and south at high altitude.
It sinks in the mid-latitudes, becoming dry and creating many desert regions.
Hadley cells move warm, moist air upward at the equator (causing rain) and bring dry air downward in the mid-latitudes (often causing deserts).
Hadley cells form because the equator receives the most sunlight, heating the air and causing warm, moist air to rise. As the air rises, it cools and releases moisture as rain in the tropics. The air then moves north and south at high altitude, eventually cooling and sinking around the mid-latitudes (~30°). As the air sinks it warms and becomes dry, creating desert climates. This circulation pattern creates two Hadley cells (one in each hemisphere) and causes wet climates near the equator and dry climates in the subtropics.
Photosynthesis
Photosynthesis is the process where plants, algae, and some bacteria use sunlight to convert carbon dioxide and water into sugars, storing the energy in chemical bonds that organisms can later use.
Photosynthesis: sunlight is captured & stored in chemical bonds (carbon compounds) inside organisms
Photosynthesizing organisms include:
Land plants
Kelp
Phytoplankton
Autotrophic bacteria
Respiration
Respiration is the process where organisms break down sugars and other molecules to release energy for metabolism (all chemical reactions in an organism that provide energy and build/break down molecules), returning carbon to the environment and releasing some energy as heat.
Respiration: organisms break down carbon compounds to release energy for metabolism
This process:
returns carbon to the environment
releases heat energy
Gross / net primary productivity (GPP & NPP)
Gross Primary Production (GPP) - Growth; Total energy captured by photosynthesis
Respiration (R) - Energy available; Energy plants use for their own metabolism
Net Primary Production (NPP) - Ecological efficiency; Energy left over after respiration → This becomes plant biomass → Energy available to herbavors
Highest on land because NPP depends on temperature & water availability
Warm + wet → high NPP
Cold + dry + low nutrients → very low NPP
Ex: Tropical rainforests are a small area but have very high productivity
Lowest in the ocean
BUT Important Note: The ocean overall contributes a lot to global NPP because it covers so much area
BUT Ecosystems like: algal beds & coral reefs have very high NPP but are rare
Formula: NPP = GPP − R
Ecological efficiency = growth / energy available
Measurements:
biomass per area per time (example: kg/m²/year)
What happens to NPP?... Energy flow
Energy moves through ecosystems via trophic levels
Ecological efficiency
Ecological efficiency: fraction of energy later available to other organisms as growth (efficiency = growth / energy available); fraction of energy from one trophic level that is passed on to the next; calculated as energy used for growth ÷ energy available
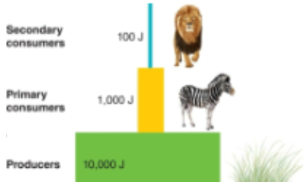
Rule of thumb: About 10% of energy moves to the next level
Example:
Plants capture 1000 units
Herbivores receive ~100
Carnivores receive ~10
Assimilation fraction
Assimilation fraction is the part of the food an organism eats that actually gets used by the organism for growth or metabolism.
Not all the food you eat goes into your body—some is wasted (like poop or uneaten parts).
The assimilation fraction is the energy that actually “counts” for the organism.
Example:
A caterpillar eats 10 calories of leaves.
It poops 4 calories, so only 6 calories are used for growth and energy.
Assimilation fraction = 6/10 = 0.6 or 60%
It’s different from ecological efficiency, which is about how much energy moves to the next trophic level.
Trophic pyramid & order
Because energy is lost at each step:
ecosystems usually form trophic pyramids
most energy at the producer level
less energy at higher trophic levels
producers → primary consumers → secondary consumers
Note:
Sometimes inverted pyramids occur, but scientists don’t understand them yet
Trophic cascade
Trophic cascade: when a change in one trophic level affects other levels
Example: More predators → fewer herbivores → more plants
Top-down / bottom-up control
Bottom-up control:
Ecosystem is controlled by resources available to producers
More nutrients → more plants → more herbivores → more predators
Top-down control:
Ecosystem is controlled by predators
Predators limit herbivores → herbivores affect plants
To know which one is happening ecologists must run experiments
Sociometabolism
Sociometabolism: metabolism of humans accounting for bodily energy use & also indirect consumption through appropriation of ecosystems (agriculture & animals) as well as other energy sources (burning biomass with fire, fossil fuels, etc.); total energy used by human society
Includes:
human metabolism
Agriculture
Livestock
burning biomass
fossil fuels
Slavery as a contributor to sociometabolism:
Human energy use can be unethically distributed, stolen from some people & taken by others
Black people’s labor as slaves enables some white people to accumulate fortunes that enable industrialization of Europe & U.S.
Industrialization & transition to fossil fuel use in turn influences shifts in those countries away from slavery
Stock / flux / equilibrium
Stock/Pool: Amount of an element in 1 compartment of the system (e.g., carbon in soil).
Units: mass or mass/area.
Flux: Rate at which the element moves between compartments (like moving groceries into/out of the fridge).
Units: mass/time or mass/area/time.
Equilibrium: Stock is stable if flux in = flux out.
NO net flux
Example analogy: Buying food = input, fridge = stock, cooking = output.
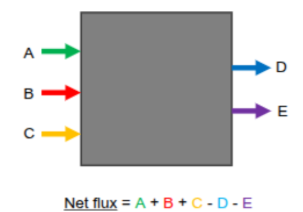
Net flux
Net flux = Sum of fluxes in minus fluxes out
= 0 at equilibrium
Residence time & formula
Residence Time: How long an element stays in a compartment at equilibrium.
Formula: Residence time = Stock / Flux
Residence time is defined only when the stock is at equilibrium; meaning the flux in = flux out
Example:
Lake Water
Stock: 10,000 m³ of water in a small lake
Flux: 1,000 m³ flows in/out per year
Residence time: 10,000 ÷ 1,000 = 10 years
On average, a water molecule stays in the lake for 10 years
Sink / source
Sinks & Sources:
Both occur when ‘fluxes in’ are not equal to ‘fluxes out’:
There is a net flux
Stocks change how much they store, so residence times are no longer defined
Source: Stock decreasing due to net flux out (e.g., burning fossil fuels).
Sink: Stock increasing due to net flux in (e.g., growing forests absorbing CO₂).
Net flux = Sum of fluxes in minus fluxes out
Haber-Bosch process
What it is: Industrial method for making nitrogen fertilizer. Mimics Nitrogen Fixation
How it works: Converts nitrogen gas (N₂) from the air into ammonia (NH₃) using high pressure, high temperature, and a catalyst.
Why it matters:
Adds nitrogen to soils, increasing crop yields (key part of the Green Revolution).
Human-made nitrogen now contributes ~51% of global nitrogen fluxes.
Energy use: Requires lots of fossil fuels (~1% of global energy production).
Simple analogy: Takes nitrogen from the air (which plants can’t use) and “fixes” it into a form plants can absorb.
Nitrogen fixation
Nitrogen fixation is how nitrogen gets into the soil/plant system from the atmosphere.
Microbes (like bacteria) do the actual conversion, turning N₂ gas into ammonium or nitrates.
Plants then get nitrogen from these compounds.
Humans mimic this with the Haber-Bosch process to make fertilizer.
Chemical fertilizer
Human-made nutrients added to soil to boost plant growth
Often contains nitrogen (from Haber-Bosch process), phosphorus, and potassium
Increases crop yields but can cause environmental problems like runoff to oceans
Acid rain
Rain, snow, or other precipitation with unusually low pH (more acidic than normal)
Adds nitrogen to ecosystems, increasing nitrogen inputs to soils and water
Caused by air pollution: sulfur dioxide (SO₂) and nitrogen oxides (NOₓ) from fossil fuel burning
Can damage plants, aquatic ecosystems, soils, and human-made structures
Crop rotation
Agricultural practice of planting different crops in the same field across seasons or years
Helps restore soil nutrients, especially nitrogen (via nitrogen-fixing crops like beans, peanuts, clover)
Reduces dependence on chemical fertilizers
Can reduce pests, diseases, and soil depletion
Rock weathering
The natural breakdown of rocks into smaller particles and minerals
Releases nutrients like phosphorus into the soil
Provides long-term nutrient supply for plants
Slower on older rocks; faster on younger rocks
Dust transport
Movement of dust particles (and the nutrients they carry) through the air over long distances
Can deposit nutrients like phosphorus onto soils far from their original source
Example: Phosphorus-rich dust from the Gobi Desert helps sustain forests on older Hawaiian islands
Greenhouse gas
Sunlight reaches Earth → absorbed by the surface → re-emitted as infrared radiation (heat)
Greenhouse gases (GHGs) absorb infrared radiation & re-emit infrared radiation, trapping more of it in the atmosphere instead of allowing it to radiate to space → act like a “planetary blanket.”
Carbon dioxide (CO₂)
Methane (CH₄)
Nitrous oxide (N₂O)
Ozone (O₃)
Water vapor (H₂O)
Global temps rise as CO₂ levels rise (positively correlated; increasing overtime)
Explain the human carbon cycle fluxes (Fossil fuel burning / land use change)
Human Impacts on the Carbon Cycle:
Fossil Fuel Burning
Direct emissions of carbon to the atmosphere (e.g., cars, factories, power plants).
Land Use Change
Deforestation: removes carbon sinks → increases atmospheric CO₂.
Reforestation: creates carbon sinks → absorbs CO₂.
Fossil fuels have a larger impact than land use
Climate models
Climate models link data to physical processes & enable predicting future climates
Simulation of all physical processes affecting radiation, mass, and heat, in the ocean, land surface, and atmosphere, calibrated with observational data
Uncertainty about human choices causes the biggest uncertainty for models of future climates
Representative Concentration Pathway (RCP) - scenarios of future emissions (like Carbon) based on population growth, economy development, and carbon efficiency of the economy
RCP scenarios reflect different trajectories of dif human activities
Positive / negative feedbacks in the climate system
Feedbacks: changes in 1 part of the system affect other parts.
Positive feedback loop: X changes, causing Y to change, causing X to change further – this is a ‘destabilizing’ feedback
Ice feedback: warming = polar ice melting = lower albedo = more sunlight absorbed = more warming
Vegetation feedback: warming = more tree mortality = more CO2 in atmosphere from decomposition = more warming
Cloud feedback #1: warming = more high altitude clouds = more infrared radiation absorbed = more warming
Negative feedback loop: X changes, causing Y to change, causing X to change back towards its original value – this is a ‘stabilizing’ feedback
Radiation feedback: warming = more infrared radiation (heat) emitted = more cooling
Cloud feedback #2: warming = more tropical atlitude clouds = more sunlight reflected to space = more cooling
Plant feedbacks on water cycle:
Deforestation disrupts water recycling → less rainfall inland → drier conditions downstream.
Ice / vegetation / cloud / radiation feedback
Positive feedback loop: X changes, causing Y to change, causing X to change further – this is a ‘destabilizing’ feedback
Ice feedback: warming = polar ice melting = lower albedo = more sunlight absorbed = more warming
Vegetation feedback: warming = more tree mortality = more CO2 in atmosphere from decomposition = more warming
Cloud feedback #1: warming = more high altitude clouds = more infrared radiation absorbed = more warming
Negative feedback loop: X changes, causing Y to change, causing X to change back towards its original value – this is a ‘stabilizing’ feedback
Radiation feedback: warming = more infrared radiation (heat) emitted = more cooling
Cloud feedback #2: warming = more tropical atlitude clouds = more sunlight reflected to space = more cooling
Representative concentration pathway
Representative Concentration Pathway (RCP) - scenarios of future emissions (like Carbon) based on population growth, economy development, and carbon efficiency of the economy
a type of climate model
Phenology
The timing of seasonal biological events in organisms
Examples: flowering, migration, breeding
Climate change can shift phenology (events happening earlier or later)
Disease
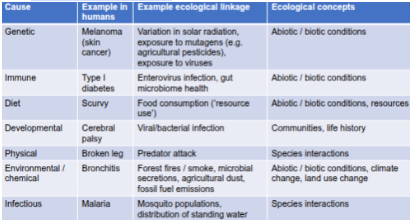
Disease: a harmful condition affecting an individual, sometimes reducing its growth, survival, or reproduction (or causing pain/suffering)
Major Types of Disease Causes:
Biological pest control
Using natural predators or parasites to control pest species instead of chemicals for crops
Example: Polistes wasps introduced to eat cotton bollworm caterpillars, reducing crop damage
Goal: reduce pests while avoiding heavy insecticide use
A hyperparasite is a parasite that infects another parasite. In biological pest control, if a specific parasite is destroying crops, scientists might introduce a hyperparasite to kill that primary parasite, thereby protecting the environment without using chemical pesticides
Infectious disease
A disease caused by pathogens (bacteria, viruses, fungi, or parasites) that can spread between organisms
Transmission can occur through vectors, contact, or environmental sources
Humans have many parasites that cause infectious disease
Parasite / host
Parasite: organism that lives on or inside another organism and takes resources from it
Host: the organism the parasite lives on or in
Parasites harm the host but usually do not kill it because they depend on it for survival
Parasite - An organism that feeds on cell contents/tissues/fluids of a host while in or on the host organism; harm but usually do not kill their host. Generally much smaller than the host, can also (sometimes) live outside of the host organism
Ex: worms & microbes living in cells
Most species host many parasites
Humans have many parasites that cause infectious disease