unit 1 ap psych terms
1/71
There's no tags or description
Looks like no tags are added yet.
Name | Mastery | Learn | Test | Matching | Spaced |
|---|
No study sessions yet.
72 Terms
APA - American Psychological Association
Responsible for setting the ethical guidelines for human and animal research.
The IRB - Institutional Review Board
Part of the APA responsible for reviewing research proposals for ethical violations and/or procedural errors.
Informed Consent
Participants must know that they are involved in research and give their consent.
Coercion
Participation in a research study must be voluntary.
Anonymity/Confidentiality
The participant's privacy must be protected. No identities and actions may be revealed. A researched must not share any results that could match a participant and their specific responses. A researcher will not identify the source of any data as well.
Risk
Participants cannot be placed at any significant mental or physical risk.
Debriefing Procedures
Participants must be told the purpose of the study and provided with ways to contact the researcher about the study results.
Quantitative Data
May involve things like experimentation or correlation studies, and the data produces numbers, measurements, deductive logic, statistics, etc.
Qualitative Data
Emphasizes natural settings and observation, and generates data in the form of written themes, verbal narratives, personalized comments, pictures, etc.
Naturalistic Observation
Researchers study spontaneous and natural behaviors in a subjects most familiar environment. There is no interaction with the subject during these observations.
Researcher Bias
Situation in which a personal factor unfairly increases the likelihood of a researcher reaching a particular conclusion
Participant Bias
The tendency of research subjects to respond in certain ways because they know they are being observed. The subjects might try to behave in ways they believe the researcher wants them to behave.
Case Study
A situation in which a single individual is studied in-depth by a researcher, often times due to their unique behaviors or situation.
Survey
Questionnaires/ interviews. Using a combination of forced and open response questions, it can be helpful in analyzing and predicting behaviors.
Correlation Study
Research study designed to determine the degree to which two variables are related to one another. This does not prove a cause and effect relationship; only that some relationship exists.
Positive Correlation
As the value of one variable increases or decreases, so does the value of the other variable. This indicates a direct relationship between the two variables, meaning they move in the same direction.
Negative Correlation
As the value of one variable increases, the value of the other variable decreases. This indicates an inverse relationship between the two variables, showing that they move in opposite directions.
Zero Correlation
There is no relationship whatsoever between the two variables.This means that changes in one variable do not predict changes in the other variable.
Illusory Correlation
A superstition; or, a belief that a relationship occurs between two variables when in fact there little or no relationship.
Experiment
An investigation seeking to understand relations of cause and effect.
Independent Variable
The manipulated variable.
Dependent Variable
The variable measured for change.
Operationalize
Explaining how you will measure your variables.
Extraneous Variables/Confounding Variables
Any factor or variable that causes an effect (or potential affects) other than the variable being studied.
Hypothesis
Expresses the type of relationship that you expect to find between the two chosen variables.
Test Population
The overall group from which a sample is selected.This population represents the larger group of individuals that researchers are interested in studying, from which samples are drawn for experiments or surveys.
Test Sample
The group selected from the overall population that participates in a study.
Rigorous Control Design
Designing an experiment with specific, hand-picked participants in mind.
Random Sample
Allows that every member of an overall population has an equal chance to be in the sample.
Systematic Sample
Happens when a random sample is selected from a larger population at a regular interval.
Experimental Group
Receives the independent variable and is manipulated throughout the experiment.
Control Group
Does not receive the independent variable. They are the used for comparative purposes group that is not exposed to the experimental treatment.
Single-Blind Design
The subjects do not know whether they have been randomly placed in the control or experiment group.
Double-Blind Design
Neither the subjects nor the researcher may know which is the control or the experiment group.
Placebo Effect
Phenomenon where a person's physical or psychological state improves because they believe they are receiving a beneficial treatment, even if the treatment is inactive or a sham
Mean
Average of the data set.
Median
The middle number of a data set.
Mode
The most frequent number of a data set.
Regression to the Mean
<span>A statistical phenomenon where extreme values in a data set tend to be closer to the mean upon repeated measurements or observations.</span>
Range
The difference between the highest and lowest values in a data set.
Standard Deviation
The comparative value of each number a data set to the mean.
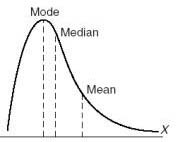
Positive skew
tail on the right side of the curve is longer than the tail on the left side
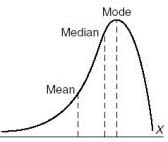
Negative skew
long left tail and a large area below the curve toward the right hand side of the distribution.
Scientific Inquiry
Curiosity, Skepticism, Humility
Hindsight Bias
The tendency to see events as having been predictable after they have already occurred, often leading to an oversimplification of the past.
Overconfidence
Being too confident and rushing to conclusions based on early success is an error-prone approach
Perceiving Order
Assuming there is always a predictable order and sequence might drive us to making incorrect assumptions and coming to incorrect conclusions
Sensation
The process of taking information in from the environment.
Transduction
This process is essential for converting stimuli from the environment into neural signals that can be interpreted by the nervous system.
Perception
How we recognize, interpret and organize our sensations.
Kinesthetic Sense
Monitors the position and movements of muscles, bones, and joints. Receptors in the joints and tendons send the brain information about the angle of your limbs
Vestibular Sense
Refers to the sense of balance and spatial orientation, helping to maintain equilibrium by monitoring the position of the head in relation to gravity.
Absolute Threshold
The minimum intensity of a stimulus that can be detected 50% of the time. It represents the point at which a person can detect a given stimulus half of the time, varying by individual and conditions.
Difference Threshold
The smallest change in stimulation that you can detect .It is also known as the just noticeable difference (JND) and varies depending on the initial intensity of the stimulus.
Weber’s Law
The principle stating that the difference threshold is a constant proportion of the original stimulus intensity, indicating that larger stimuli require larger changes to notice a difference. A small change in something big might be hard to detect
Sensory Adaptation
Is the process by which our sensitivity to a constant stimulus diminishes over time. For example, you may stop noticing the smell of a strong perfume after being exposed to it for a while.
Accommodation
This is the process through which the eye's lens changes shape to focus on objects at various distances, allowing for clear vision. I
t plays a crucial role in adjusting our focus for near and far objects.
If an object is very close is gets smaller and rounder; if an object is further away, it get larger and wider.
Retina
The inner lining of the back of the eyeball. The lens focuses an image from the outside world on the retina, and the retina in turn transduces the image.
Rods
Determine shades of light and dark and peripheral vision.
Cones
Determine color.
Colorblindness
A visual impairment that affects the ability to perceive colors accurately, often due to malfunctioning cones in the retina.
Proximity
The distance between objects.
Closure
The tendency to overlook incompleteness and to complete objects so that they fit into our mental preconceptions of what objects are supposed to look like
Binocular Cues
Depth cues that depend on having two eyes working in conjunction with each other
Monocular Cues
Depth cues that do not depend on having two eyes working in conjunction together and provide information through a single eye's perspective, such as size and interposition.
Binocular Disparity
Binocular disparity refers to the difference in image location of an object seen by the left and right eyes, resulting from the eyes' horizontal separation.
Bottom Up Processing
The entry of information through your five senses going up to the brain to create a perception of the environment.
Top Down Processing
The cognitive process where perception is constructed by the brain based on prior knowledge, expectations, and experiences, influencing how sensory information is interpreted.
Inattentive Blindness
Failing to see visible objects when our attention is directed elsewhere.
Change Blindness
Failing to notice changes in the environment after you've gotten used to it
Cocktail Party Phenomenon
A phenomenon in which people tune in one message even while they filter out others nearby.
Interposition
If one object partially blocks our view of another, we perceive it as closer