AP Psychology: Science Practices - Set D
1/10
There's no tags or description
Looks like no tags are added yet.
Name | Mastery | Learn | Test | Matching | Spaced | Call with Kai |
|---|

11 Terms
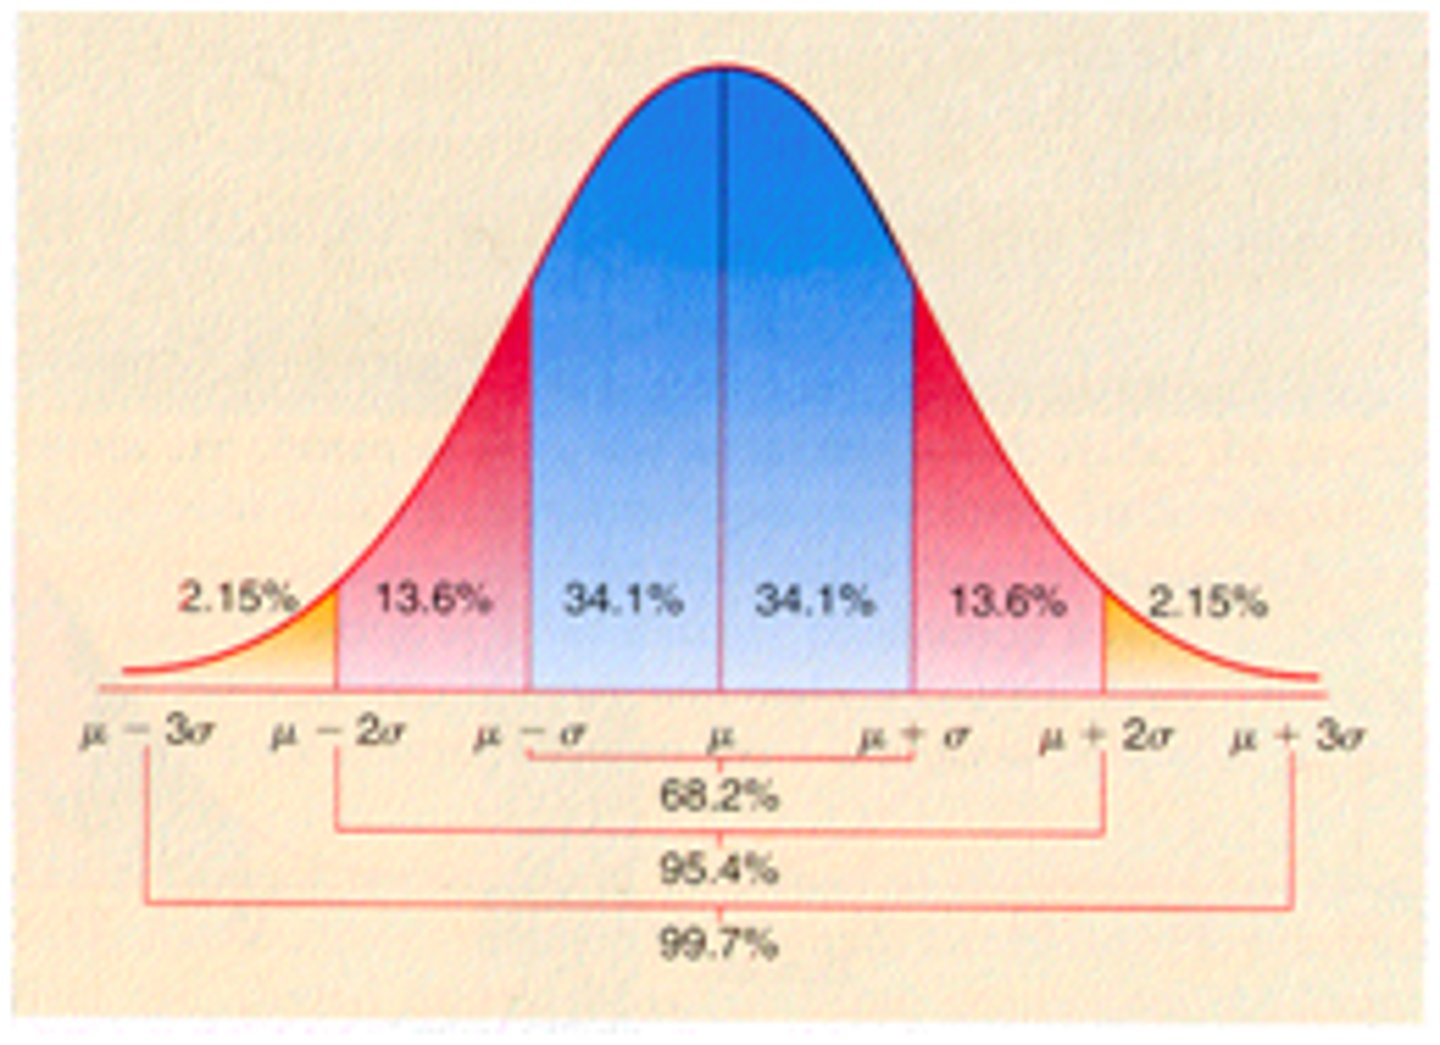
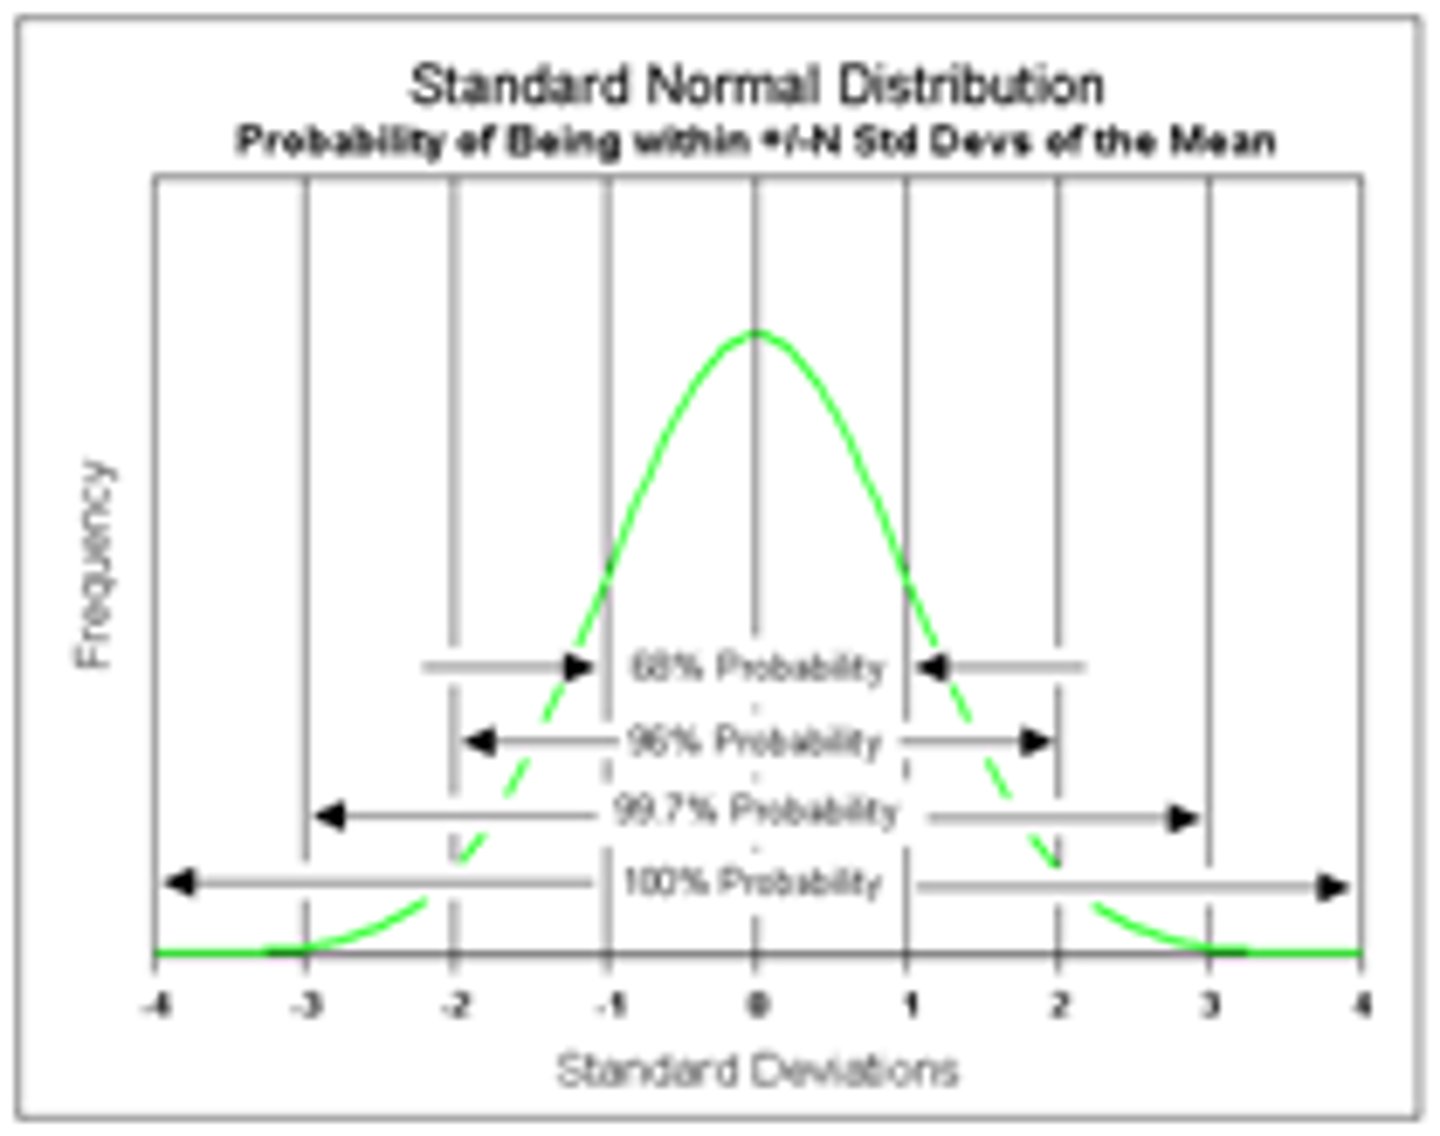
Normal curve
a symmetrical, bell-shape that describes the distribution of many types of data; most scores fall near the mean (68% fall within one standard deviation of it) and fewer and fewer near the extremes
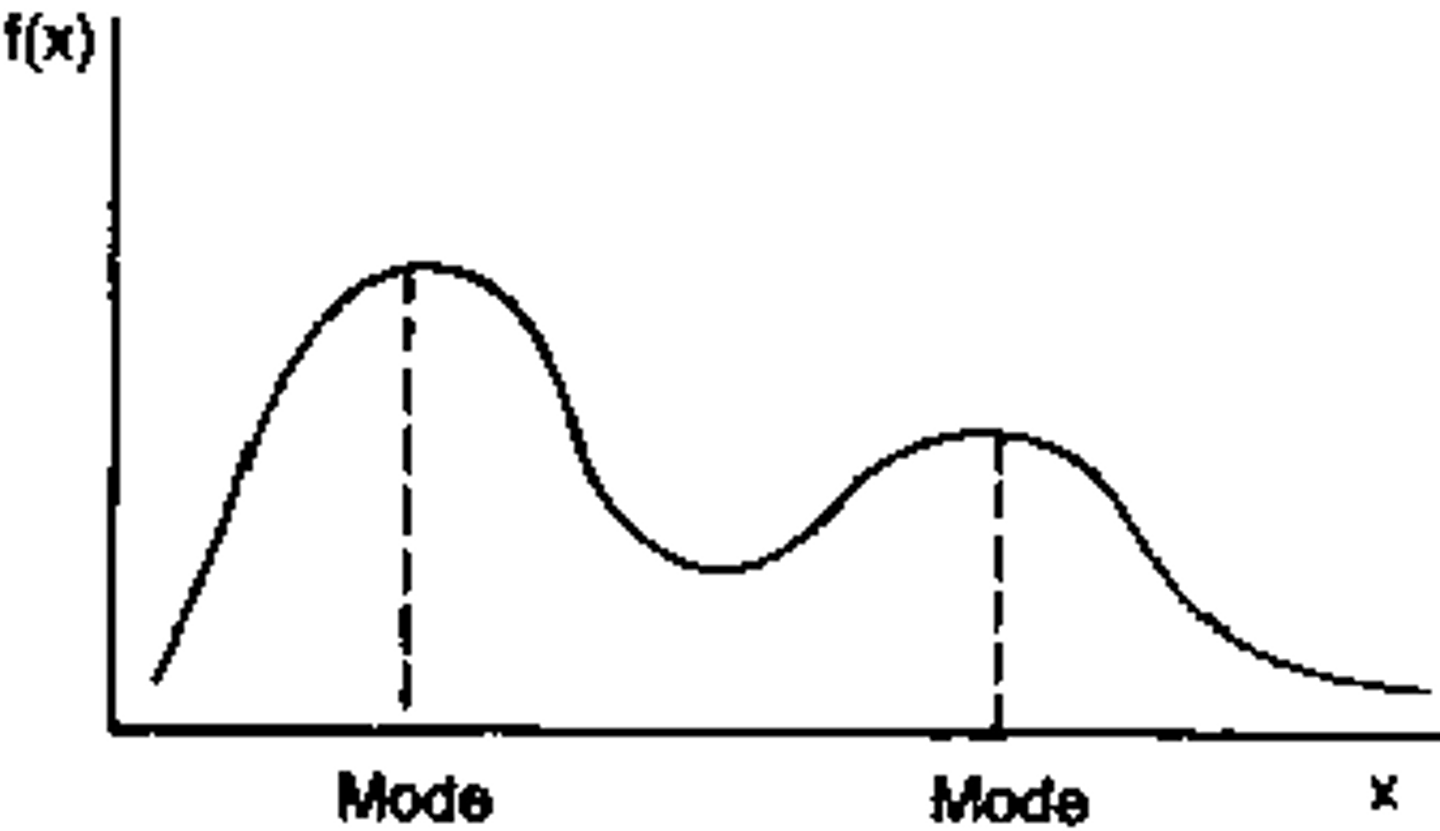
Bimodal distribution
a distribution with two peaks because the data set has two different modes
Standard deviation
a measure of variability that describes an average distance of every score from the mean; a small standard deviation indicates data are clustered tightly around the mean, and a high deviation indicates the results are more spread out
Regression toward the mean
the tendency of results that are extreme by chance on first measurement (i.e., extremely higher or lower than the average) to move closer to the average when measured a second time
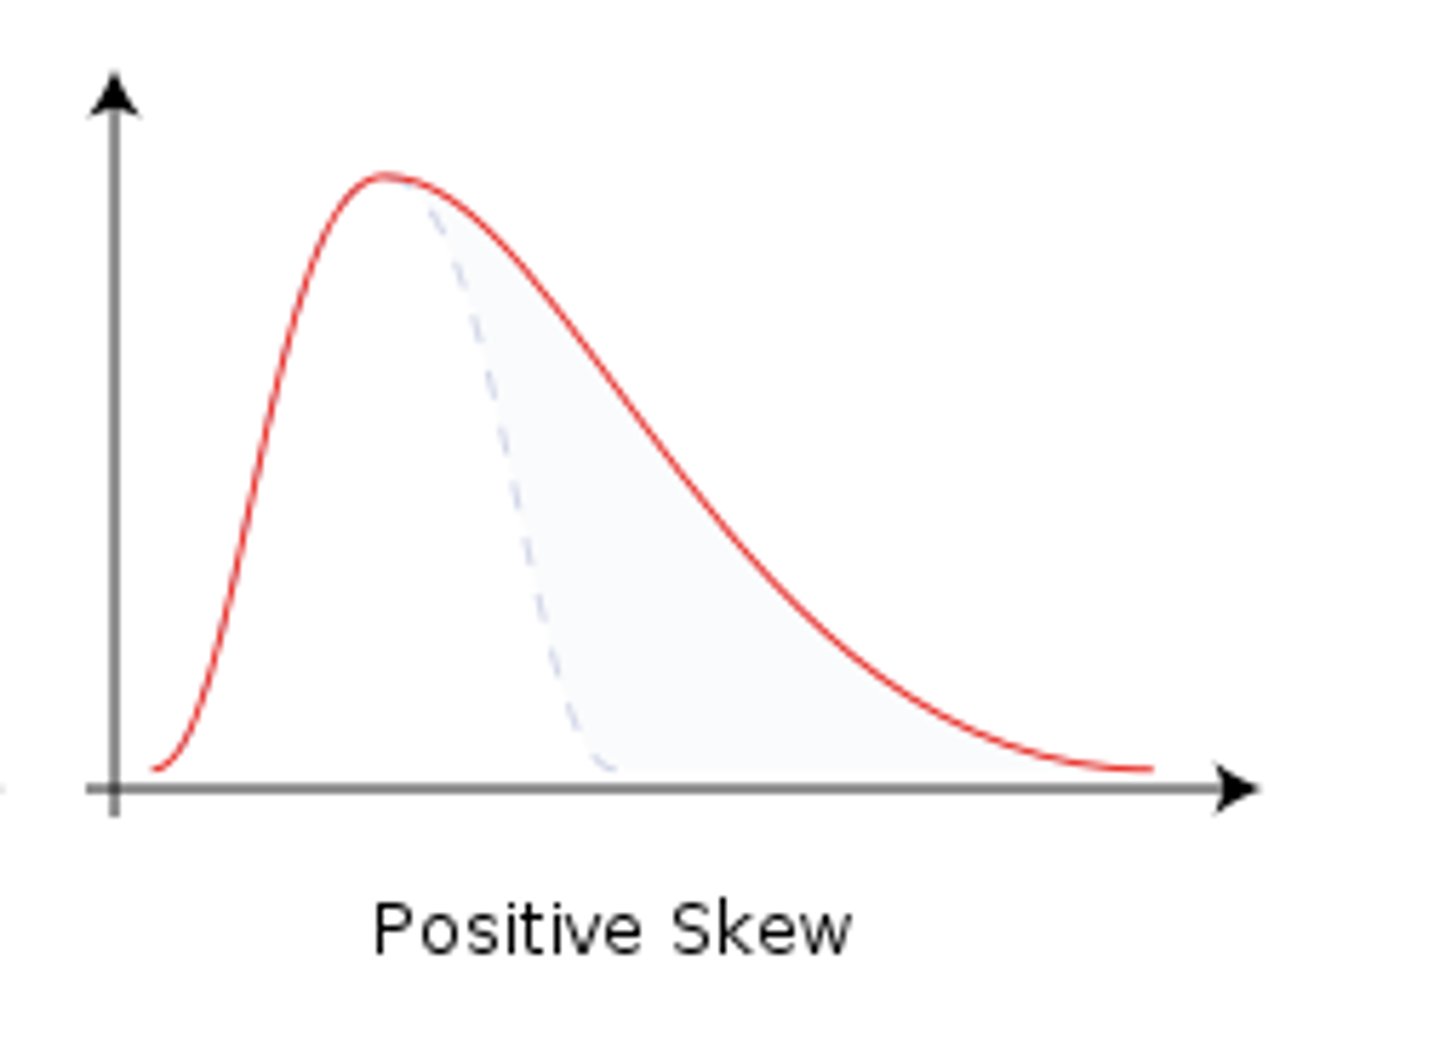
Positive skew
a type of distribution in which most values are clustered around the left tail of the distribution while the right tail of the distribution is longer
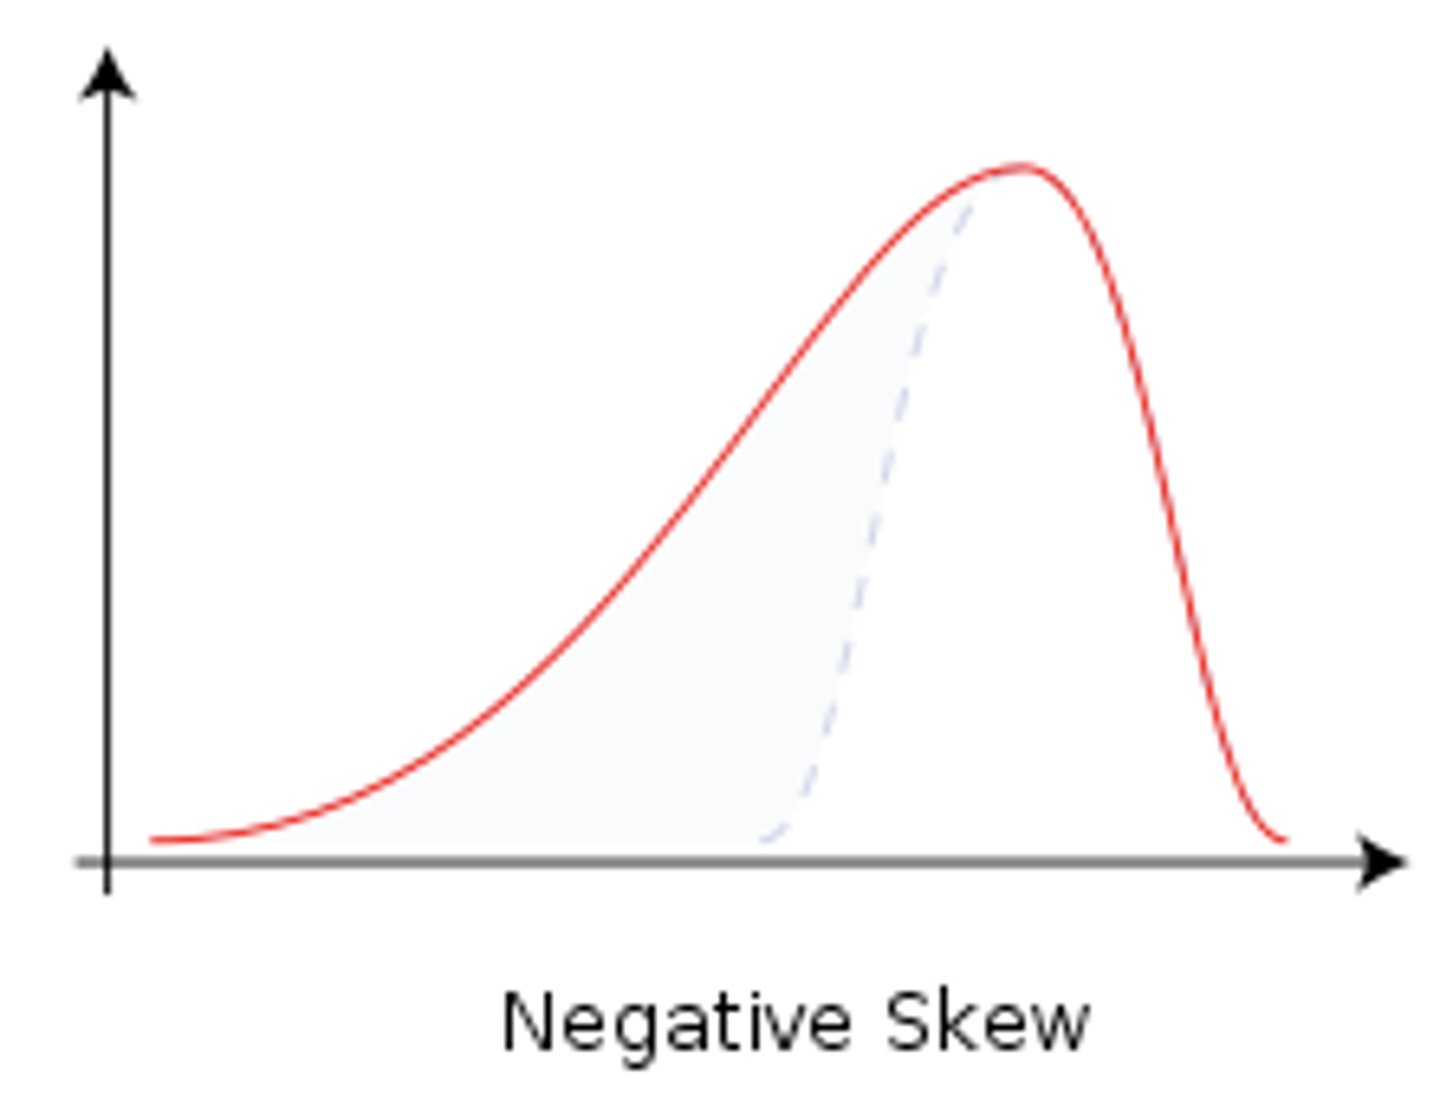
Negative skew
a type of distribution in which most values are clustered around the right tail of the distribution while the left tail of the distribution is longer
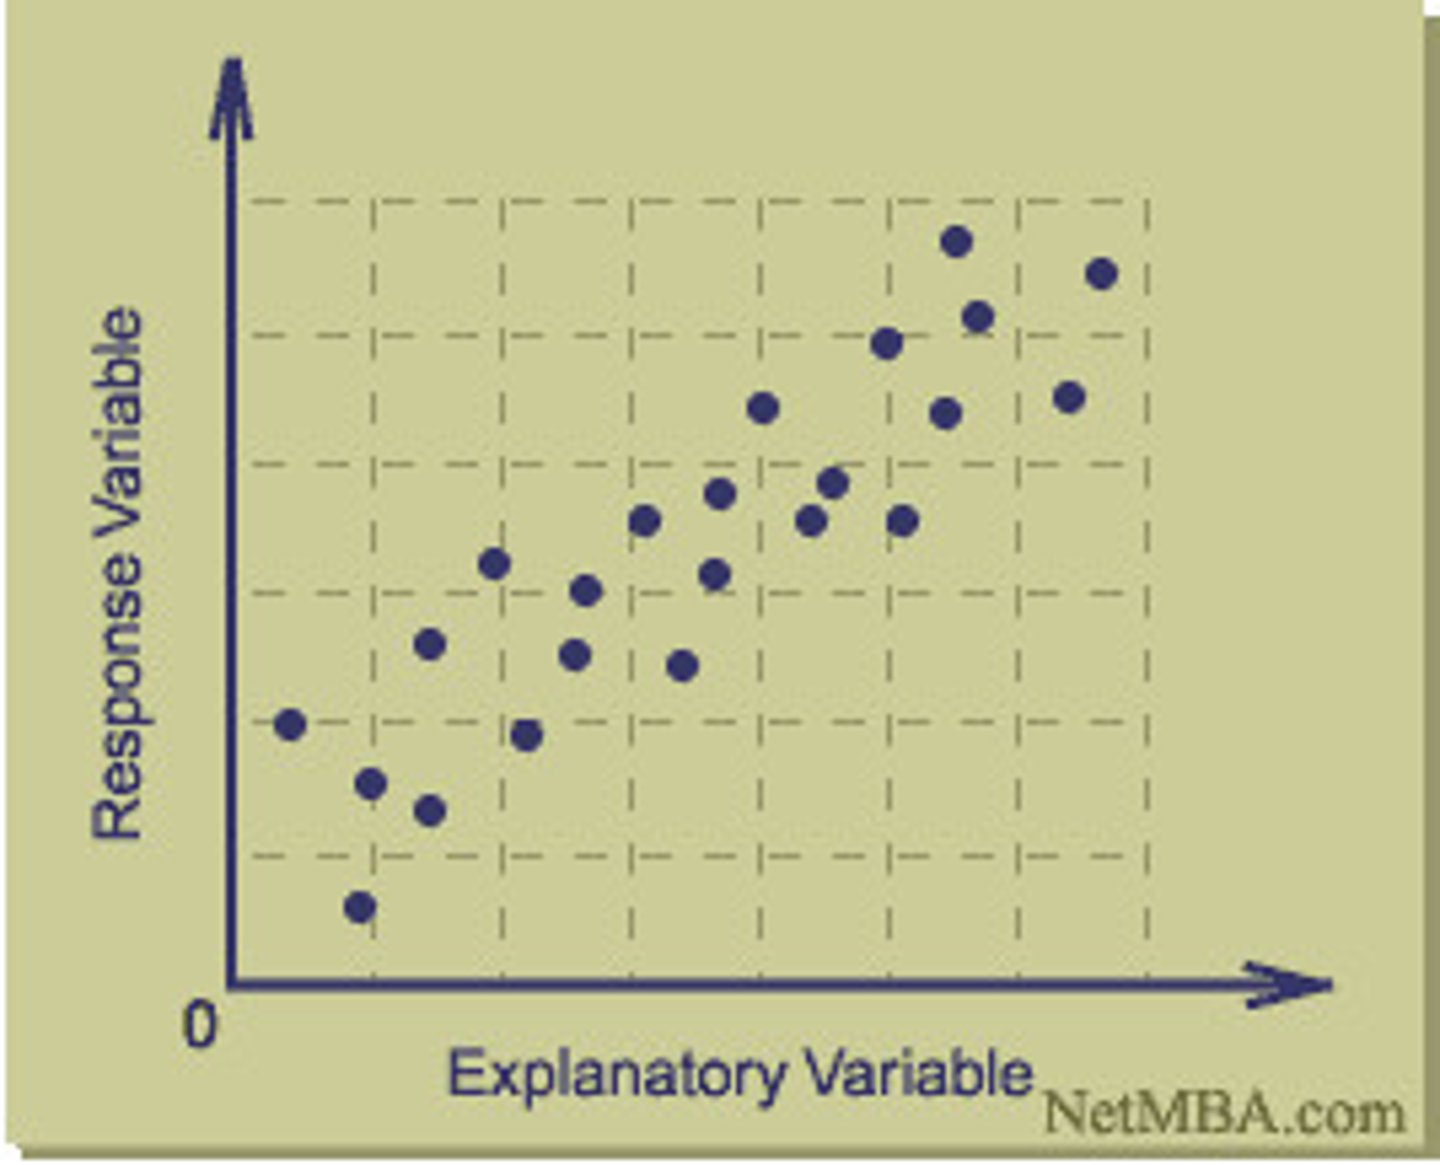
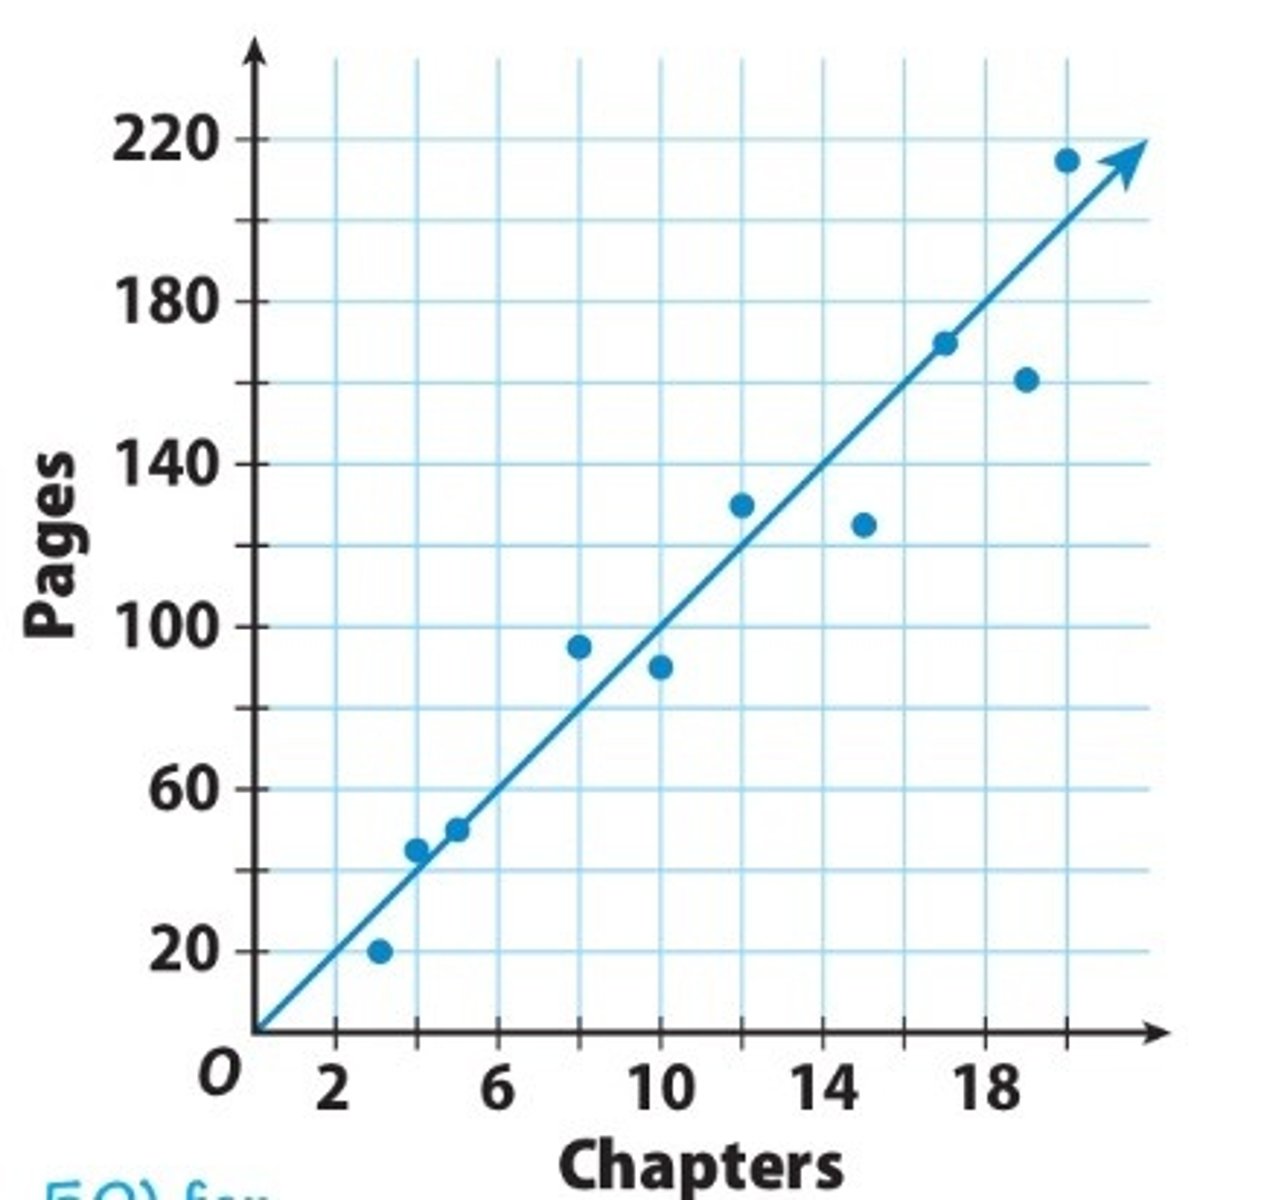
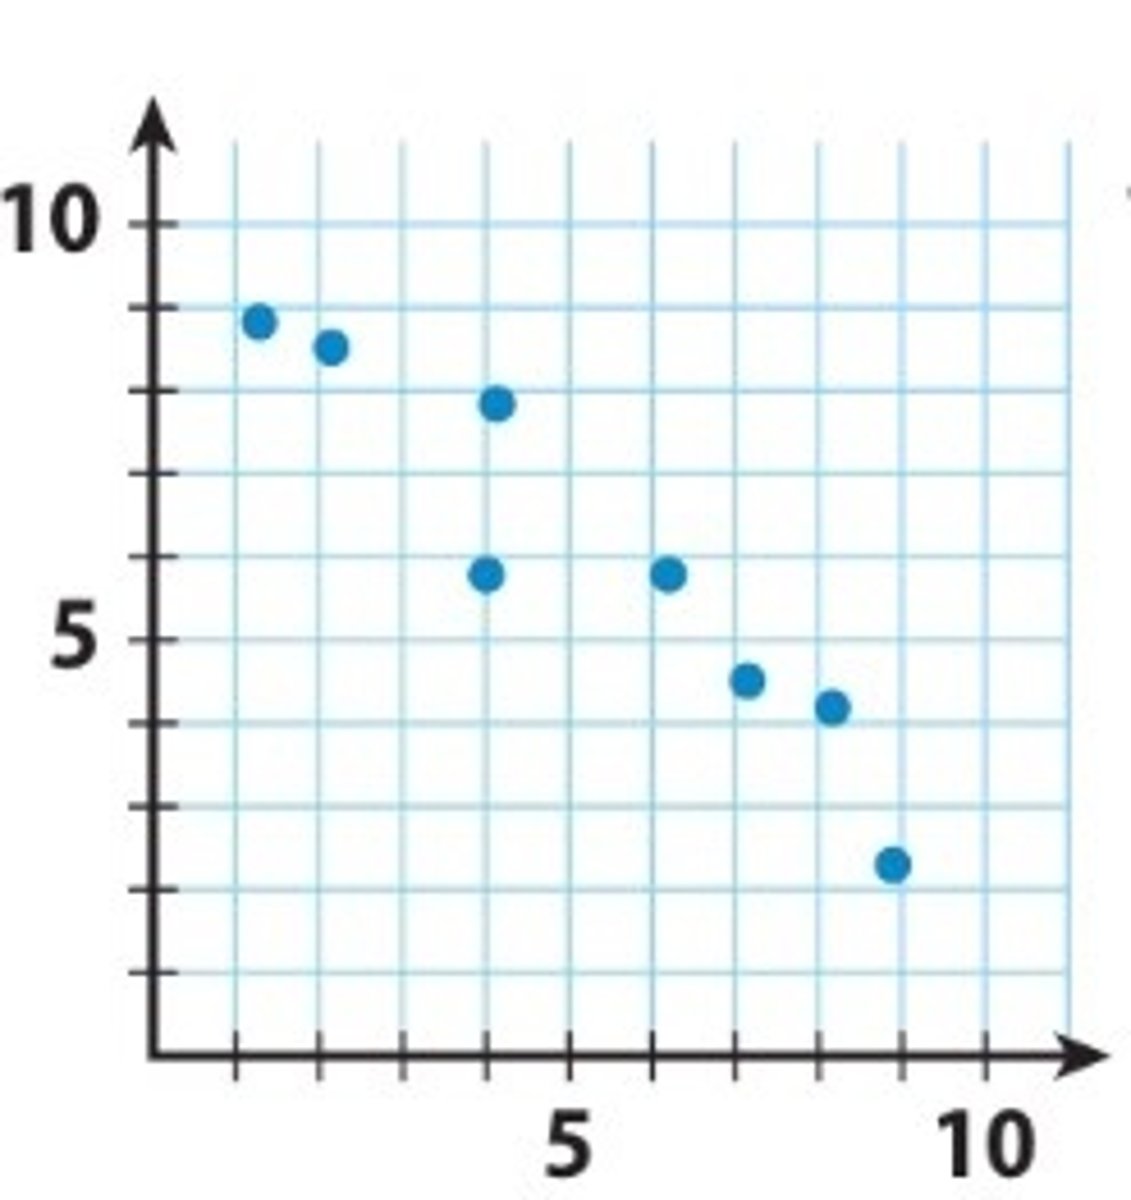
Scatterplot
a graphed cluster of dots, each of which represents the values of two variables
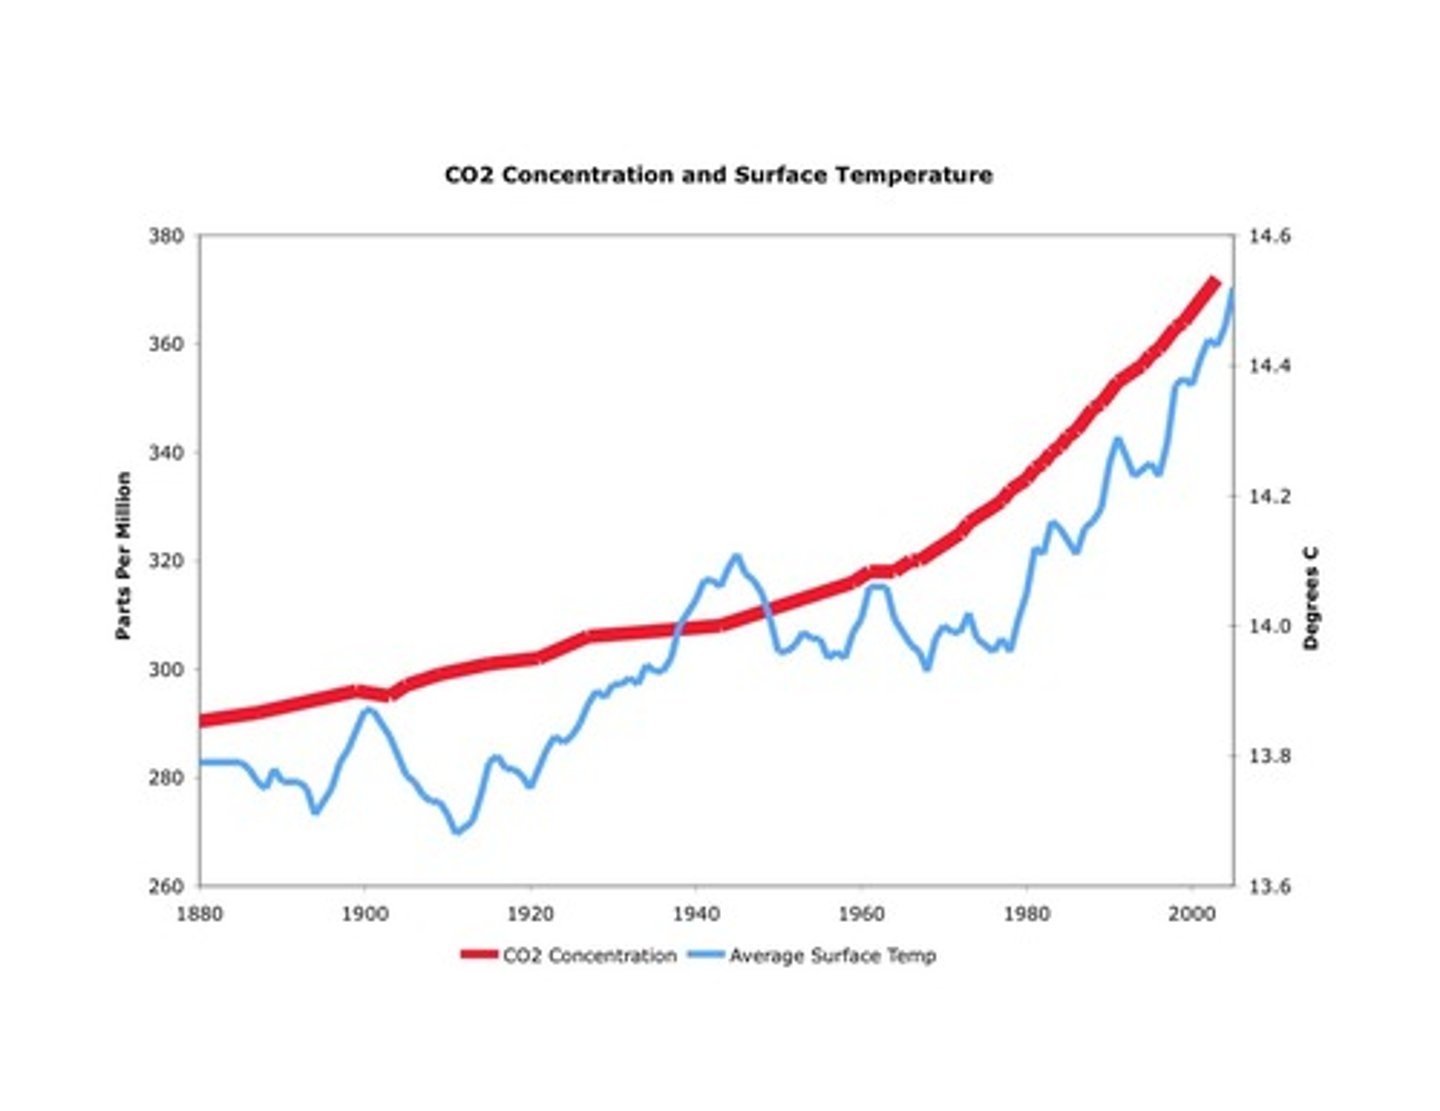
Correlation
a measure of the relationship between two variables (i.e., how two variables move in relation to one another)
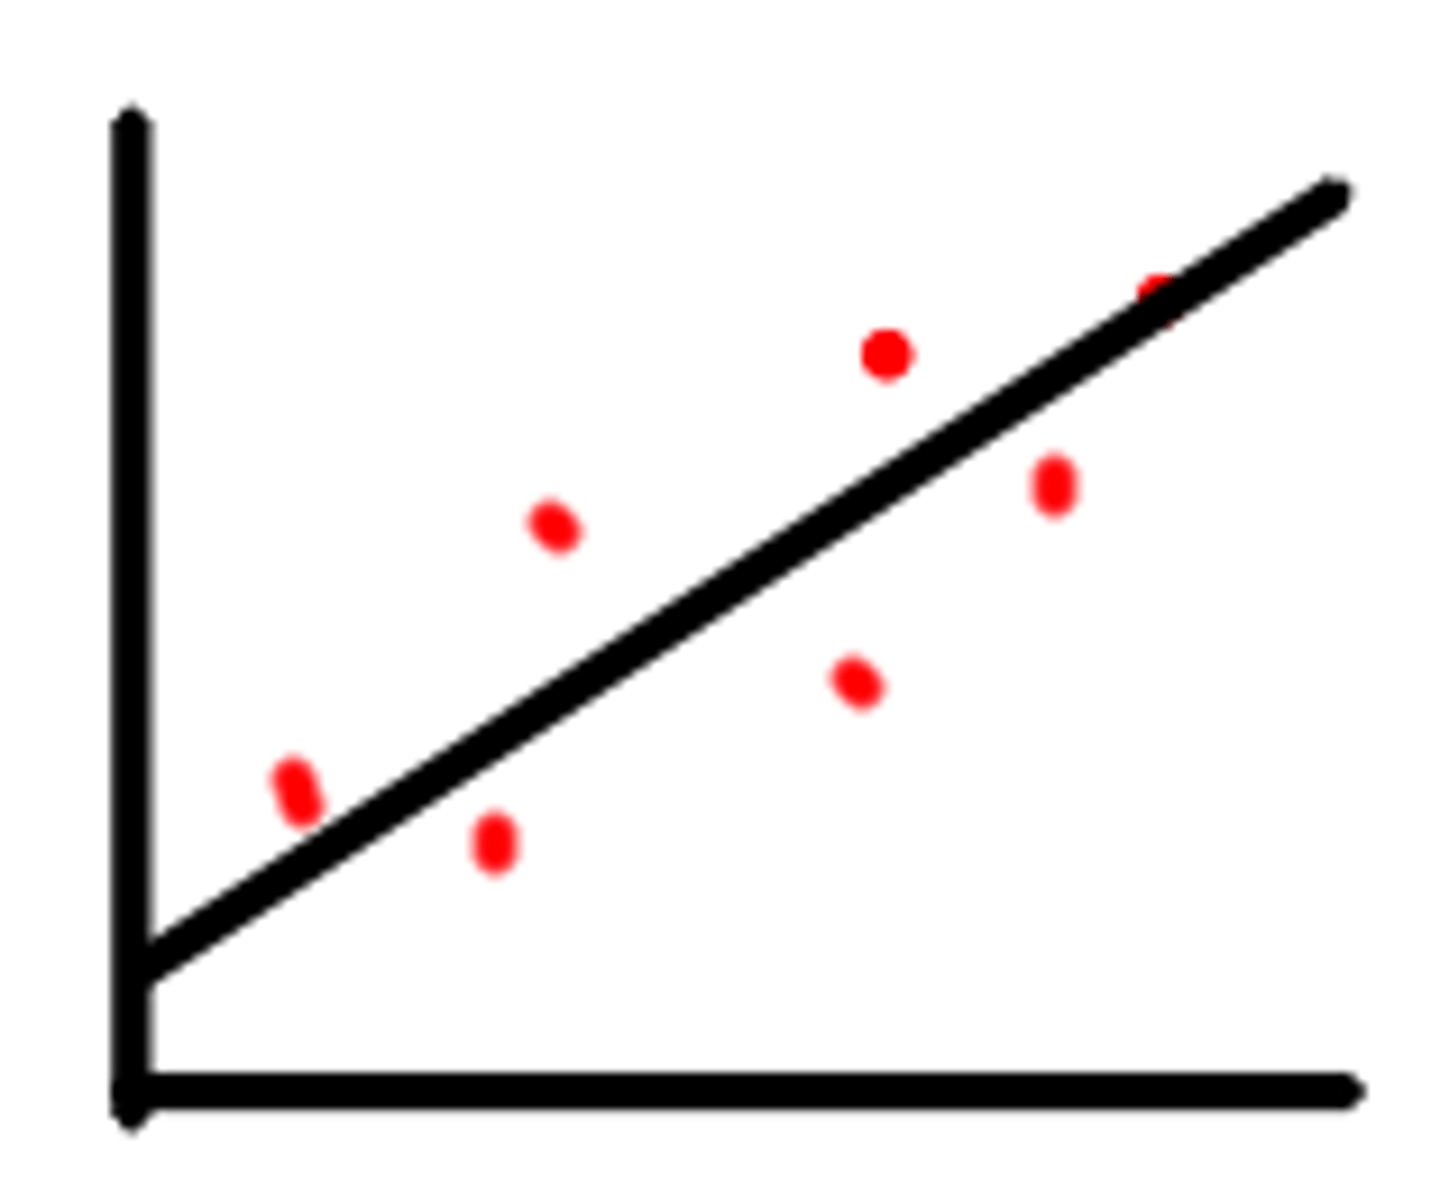
Positive Correlation
a relationship in which one variable decreases as the other variable decreases, or one variable increases while the other increases
Negative Correlation
a relationship in which two variables move in opposite directions (e.g., as variable A increases, variable B decreases)
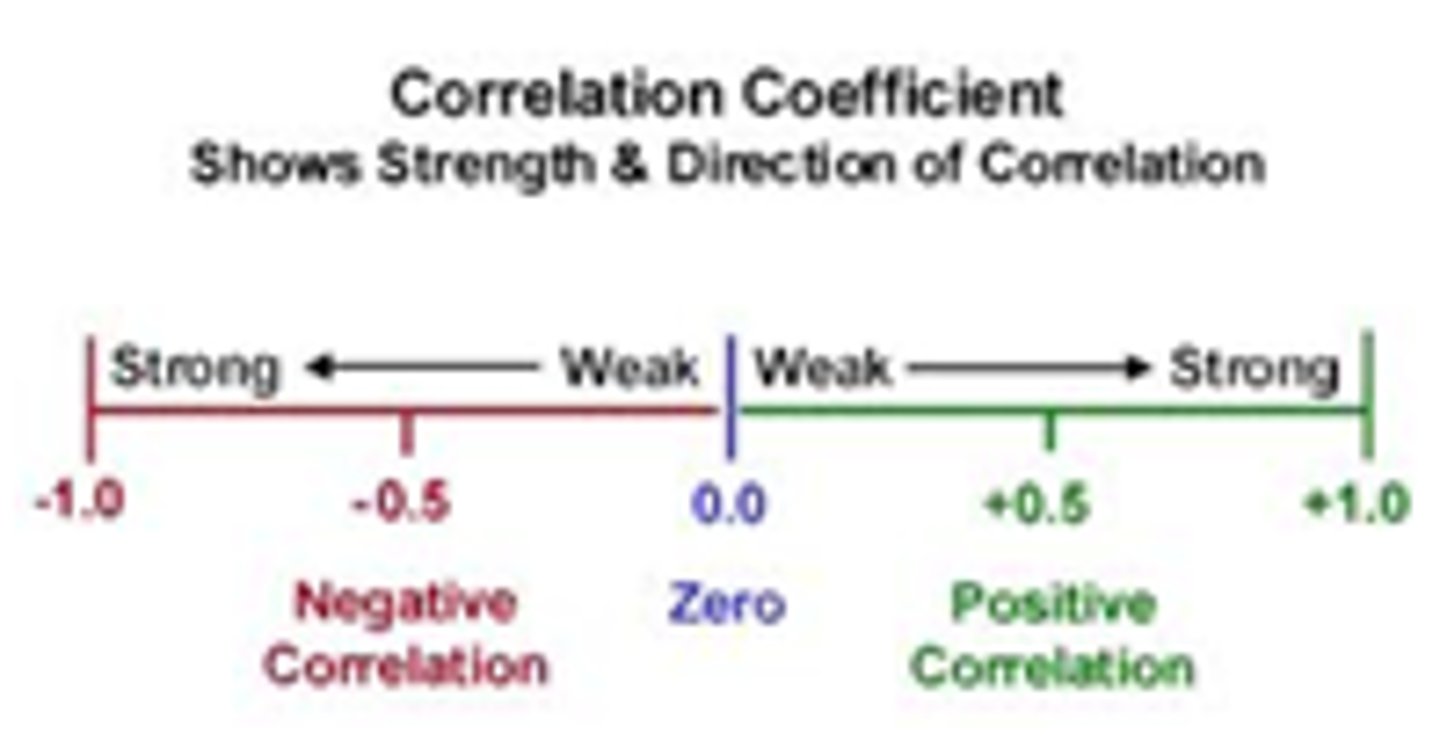
Correlation coefficient
a statistical measure between -1 and 1 that tells the strength and direction of a relationship between variables (i.e., it reflects how similar the measurements of two or more variables are across a dataset)