microecon
1/158
There's no tags or description
Looks like no tags are added yet.
Name | Mastery | Learn | Test | Matching | Spaced | Call with Kai |
|---|
No analytics yet
Send a link to your students to track their progress
159 Terms
Demand Formation
The consumption choices people make collectively form what we understand as demand
Rational Decision-Making (Assumption):
Demand analysis often rests on the assumption that individuals are rational decision makers who aim to maximize their well-being.
Behavioral economics
studies predictable ways in which people make irrational decisions
Utility Theory (Utilitarianism):
Explains choices based on maximizing happiness or satisfaction given limited income.
Indifference Curve Analysis
A more modern approach that does not require measuring utility but focuses on preferences between bundles of goods
budget line
illustrates the limits on consumption choices given a limited income (budget) and the prices of goods and services
Budget Constraint
combinations beyond the line are unattainable. This is similar to the production possibilities frontier (PPF), where resources and technology limit production.
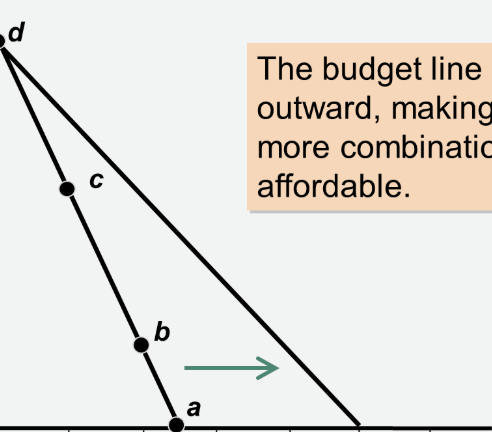
decrease in the price of a good causes the budget line to
rotate outward along the axis representing that good, increasing the affordable combinations.
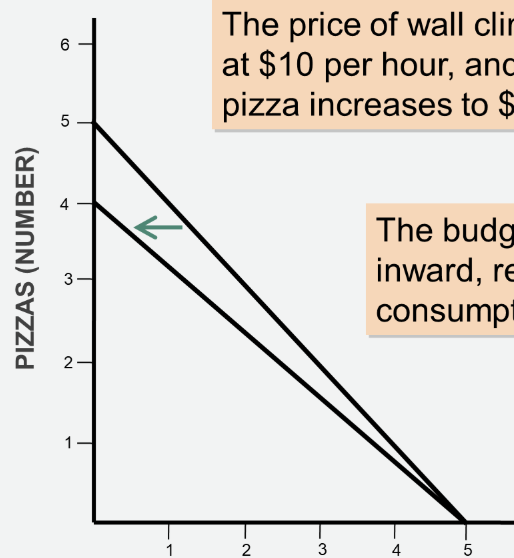
An increase in the price of a good causes the budget line to
rotate inward, reducing the affordable combinations.
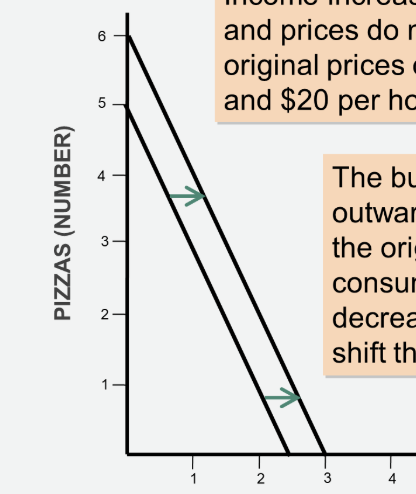
An increase in income causes a
parallel outward shift of the budget line, allowing the consumer to afford more of both goods at the same prices.
A decrease in income
causes a parallel inward shift of the budget line, reducing the affordable quantities of both goods.
Utility
A hypothetical measure of consumer satisfaction or happiness derived from consuming goods and services. Utils are the hypothetical units of utility.
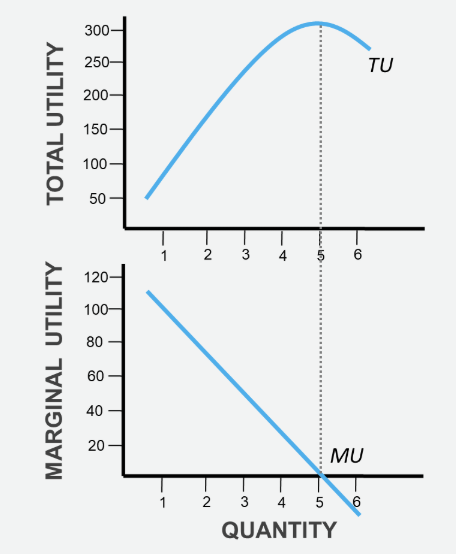
Total Utility:
The total satisfaction a person receives from consuming a given quantity of goods and services. It generally increases with consumption but at a decreasing rate.
Marginal Utility:
The additional satisfaction gained from consuming one more unit of a good or service. It is the change in total utility resulting from a one-unit increase in consumption.
Relationship
Total utility rises by an amount exactly equal to the marginal utility of the last unit consumed.
The Law of Diminishing Marginal Utility
as we consume additional amounts of a product, the rate at which our total satisfaction increases will decline
Marginal Utility per Dollar formula
(Marginal Utility of Good) / (Price of Good).
Utility-Maximizing Rule
Consumers maximize their total utility by allocating their budget such that the marginal utility per last dollar spent is the same for all go
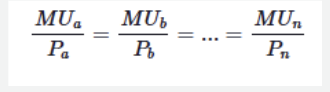
ods
Sunk Cost Fallacy
Occurs when individuals make decisions based on how much was already spent (a sunk cost that cannot be recovered) rather than on the potential future benefits and costs
Framing Bias
Occurs when individuals are steered toward one choice over another by how the choices are portrayed or presented.
Overconfidence
Feeling excessively confident about one's own abilities or judgments, leading to potentially suboptimal decisions
Overvaluing the Present Relative to the Future:
Placing a significantly higher value on immediate gratification compared to future rewards, leading to undersaving or excessive borrowing.
Altruism
Actions undertaken out of goodwill or generosity without expecting any material reward
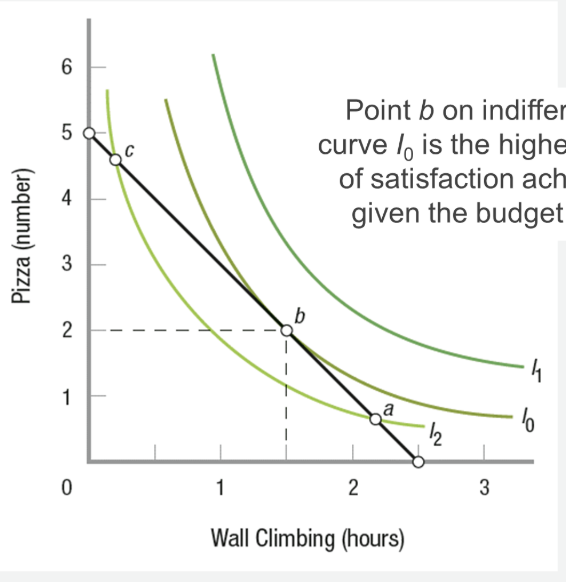
indifference curve
represents all combinations of two products that provide a consumer with the same level of satisfaction, meaning the consumer is indifferent among these combinations
Indifferent curves farther from the origin represent
higher levels of satisfaction because they represent larger quantities of both goods.
Consumer equilibrium occurs
at the point where the budget line is tangent to the highest attainable indifference curve. At this point, the marginal rate of substitution equals the ratio of the prices
Substitution Effect
The change in quantity demanded due to the change in the relative prices of goods, holding the level of satisfaction constant (movement along an indifference curve). Consumers substitute towards relatively cheaper goods.
Income Effect
The change in quantity demanded due to the change in the consumer's purchasing power resulting from the price change (movement to a different indifference curve). For normal goods, a price increase reduces real income and thus reduces quantity demanded.
Firms
economic institutions that transform inputs (factors of production) into outputs (products and services).
primary role of firms
manage production and costs to operate within an economy
Entrepreneurs
play a crucial role in organizing the production of goods and services by taking risks in the hopes of earning profit.
Sole Proprietorship
Easy to establish and manage with less paperwork.
Limited ability to raise capital.
Single owner bears all management responsibilities.
Owner faces unlimited liability: personal assets are at risk.
Partnership
Easier to raise capital and share management responsibilities.
Partners face unlimited liability for the entire business, not just their share.
The death of one partner can dissolve the partnership.
A legal entity with most of the legal rights of a person, owned by many shareholders
Able to issue stock to raise large amounts of capital.
Offers limited liability to owners: shareholders' liability is limited to their investment.
Earnings are distributed to shareholders as dividends.
Shareholders elect a board of directors, leading to less direct control over operations compared to sole proprietorships or partnerships.
Dominant form of business worldwide and in terms of sales in the U.S..
Profit
difference between total revenue (price per unit times the number of units sold) and total cost
Accounting Profit
considers only explicit costs or out-of-pocket expenses (wages, rent, raw materials).
Economic Profit
considers both explicit costs and implicit costs or opportunity costs
Implicit costs
represent real expenses to the firm but are not directly paid to another entity (e.g., forgone salary of the entrepreneur, forgone interest on invested capital).
Economic costs
sum of explicit and implicit costs
Normal Profit
occurs when economic profit equals zero. This represents a normal rate of return sufficient to keep investors satisfied in the long run. The firm is earning the same as its next best alternative
Short Run
A period where at least one factor of production is fixed (cannot be changed). Typically, plant capacity (size of the physical plant) is assumed to be fixed. Output can be varied by changing variable inputs like labor and raw materials.
Long Run
A period sufficient for a firm to adjust all factors of production, including plant capacity. Existing firms can close or expand, and new firms can enter the market.
Production
the process of turning inputs into outputs using a production function (the relationship between inputs and output).
Total Product (TP)
The total quantity of output produced with a given amount of variable input (e.g., labor), assuming fixed inputs are constant.
Marginal Product (MP):
The change in total output resulting from a one-unit change in a variable input (e.g., adding one more worker).
marginal product formula
change in quantity/change in labor
Average Product (AP):
Total output divided by the quantity of the variable input (e.g., output per worker).
average product formula
quantity/labor
Increasing Marginal Returns
The initial phase where the MP of each additional worker increases, allowing for greater specialization and efficiency.
Diminishing Marginal Returns
The phase where the MP of each additional worker decreases, even though total output may still be increasing. This occurs when increasing variable inputs are used with a fixed input, leading to overcrowding or less efficient use of fixed resources.
Negative Marginal Returns
Occurs when adding more of the variable input leads to a decrease in total output (e.g., too many workers in a fixed space).
MP curve intersects the AP curve at
its highest point
Fixed Costs (FC):
Costs that do not change as the firm's output changes (e.g., rent, insurance, administrative overhead, lease payments, sunk costs like licenses). These exist only in the short run.
Variable Costs (VC):
Costs that fluctuate directly with the level of output (e.g., wages, raw materials, utilities).
Total Cost (TC)
The sum of fixed costs and variable costs: .
Marginal Cost (MC)
The change in total cost resulting from producing one more unit of output
marginal cost formuka
change in total cost/change in quantity
Average Fixed Cost (AFC)
Fixed cost per unit of output, decrease continuously as output increases
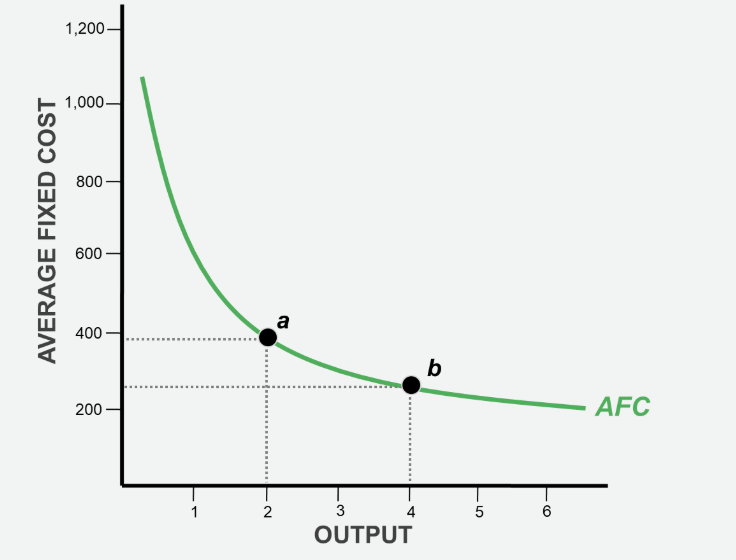
average fixed cost formula
fixed cost / quantity
Average Variable Cost (AVC)
typically U-shaped, initially falling due to increasing returns and then rising due to diminishing marginal returns
average variable cost formula
variable cost/quantity
Total cost per unit of output
ATC = TC/Q or AFC+AVC
The marginal cost (MC) curve intersects
both the average variable cost (AVC) and average total cost (ATC) curves at their minimum points
When MC is below average cost,
average cost falls
when MC is above average cost
average cost rises
Sunk Costs
Irrecoverable costs incurred by individuals and businesses when making decisions. Should not be considered
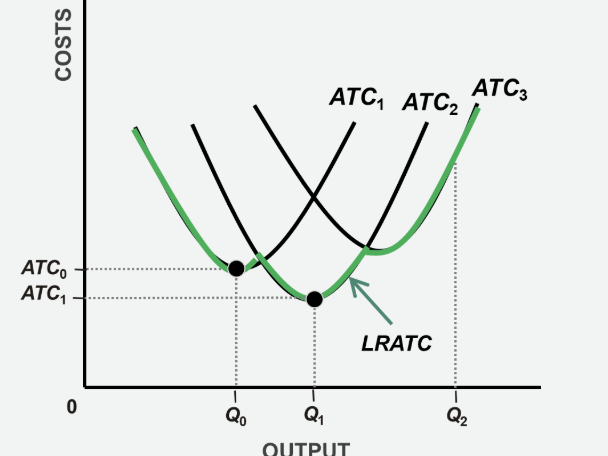
Long-Run Average Total Cost (LRATC) Curve
Shows the lowest unit cost at which a firm can produce any given level of output in the long run, when it has had time to adjust all its inputs. It is an envelope curve made up of segments of various short-run ATC curves, representing the optimal plant size for each output level.
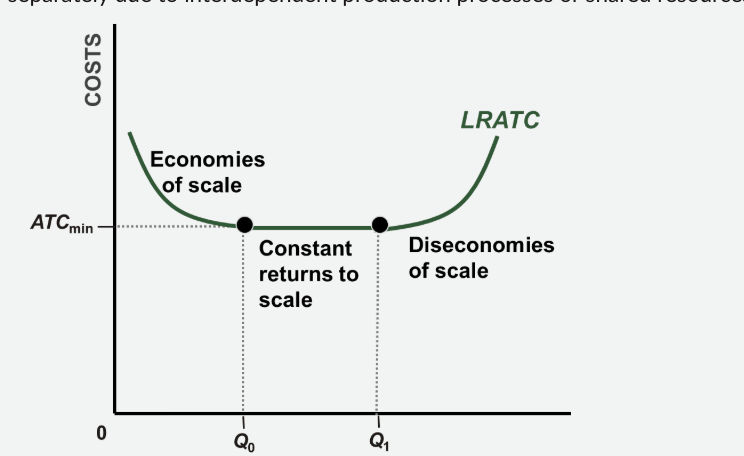
Economies of Scale
Occur when a firm's LRATC decreases as its output increases
Diseconomies of Scale
Occur when a firm's LRATC increases as its output increases
Constant Returns to Scale
Occur when a firm's LRATC remains constant as its output increases over a certain range
Economies of Scope
Occur when it is cheaper for a firm to produce multiple products together than to produce each product separately due to interdependent production processes or shared resources (e.g., marketing department, shared inputs
Role of Technology
Technological advancements can continuously expand the output level at which diseconomies of scale are reached by improving production techniques, communication, and cost control
Market Structures
Economists categorize industries based on their market structure, which influences firm behavior regarding pricing and sales
market structure characteristics
number of firms in the industry, nature of industries products, barriers to entry, extent of individual frims control over prices, potential for long-run economic profit
Perfect Competition
Many small firms selling homogeneous products with no barriers to entry or exit and no control over price (price takers). No long-run economic profit
Monopolistic Competition
Many sellers offering differentiated products with little to no barriers to entry or exit and some control over price (limited market power). No long-run economic profit.
Oligopoly
Few large firms making mutually interdependent decisions with substantial barriers to market entry and shared market power (considerable control over price). Potential for long-run economic profit.
Monopoly
One firm with no close substitutes for its product, nearly insurmountable barriers to entry, and substantial market power (control over price). Potential for long-run economic profit
Many Buyers and Sellers
Each individual buyer and seller is too small to influence the market-determined price. Actions of one firm do not affect another.
Homogeneous (Nearly Identical) Products
Products offered by different firms are virtually the same, making quality mostly indistinguishable. Consumers see no difference and will always choose the lowest price
No Barriers to Market Entry or Exit
New firms can freely enter the industry if it appears profitable, and existing firms can leave if they are incurring losses in the long run
Perfect Information
Buyers and sellers have complete information about prices and product quality to make informed decisions.
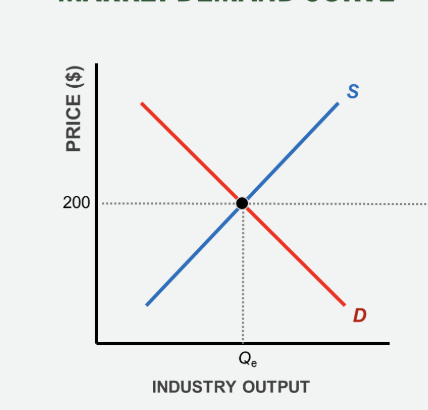
Price Takers:
Individual firms have no market power to set prices; they must accept the prevailing market price determined by overall market demand and supply. The firm's demand curve is perfectly elastic (horizontal) at the market price.
market demand curve of perfectly competitive markets
firm demand curve for perfectly competitive markets
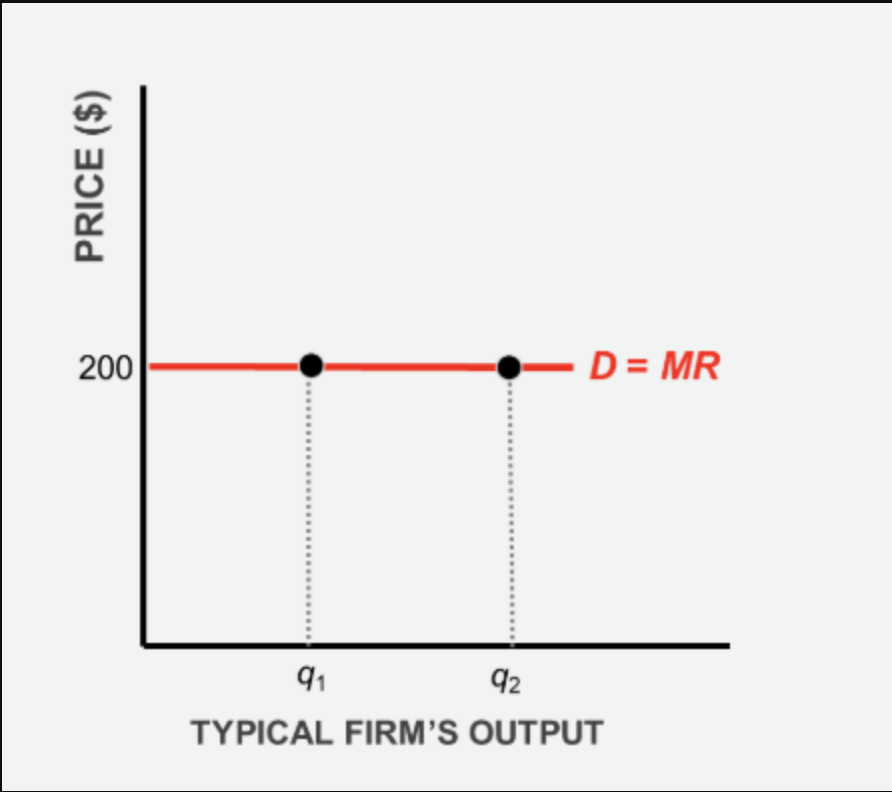
In perfect competition MR =
Price (P)
Profit-Maximizing Output
Firms aim to maximize economic profit (Total Revenue - Total Cost)
Profit-Maximizing
Marginal Revenue (MR) equals Marginal Cost (MC).
perfect competition - Forgoing potential profit
MR > MC
perfect competition - reducing profit
MC > ME
Economic Profit
Occurs when price (P) > Average Total Cost (ATC) at the profit-maximizing quantity
Total profit
(P - ATC) * Quantity.
Normal Profit (Zero Economic Profit):
Occurs when price (P) = minimum ATC. aka break even point
Loss Minimization
If price (P) < ATC,
Even when operating at a loss when should the firm continue to produce
in the short run if Price (P) ≥ Average Variable Cost (AVC).
Plant shutdown
If price (P) < minimum AVC
Calculate Maximum Profit
(Price - ATC) * Quantity
The Short-Run Supply
The portion of the firm's Marginal Cost (MC) curve that lies above the minimum point of the Average Variable Cost (AVC) curve
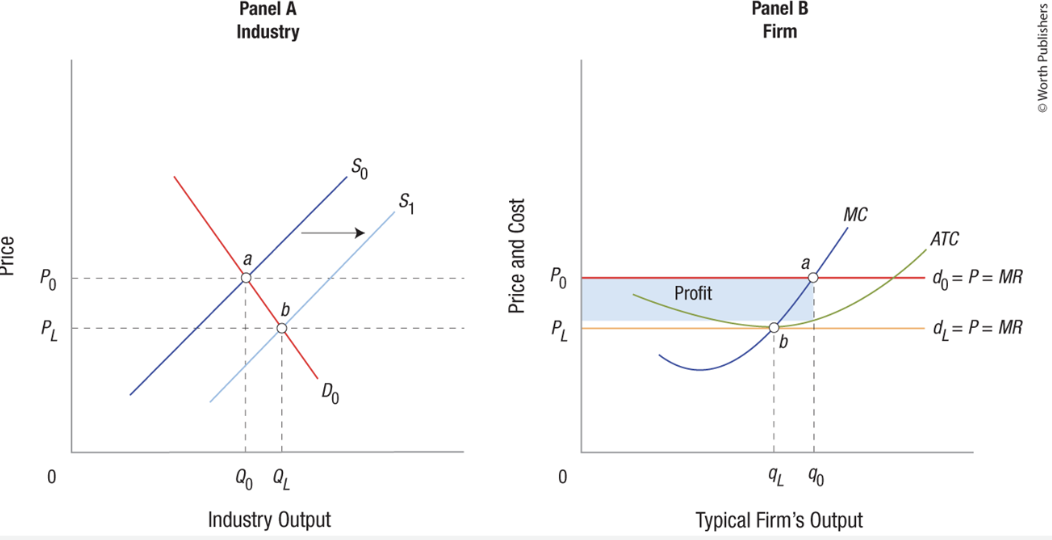
If firms are earning short-run economic profit
this attracts new firms to enter the industry because there are no barriers.
Increased entry shifts the industry supply curve
to the right, causing the market price to fall