Ch. 1 Stats Starts Here , Ch. 2 Summarizing Data & Describing Categorical Data (2.1)
1/42
There's no tags or description
Looks like no tags are added yet.
Name | Mastery | Learn | Test | Matching | Spaced | Call with Kai |
|---|
No study sessions yet.
43 Terms
What is statistics?
Way of reasoning, along with a collection of tools & methods designed to help us understand the world using data
What are the 3 different ways statistics can be used?
Describe and present a particular situation
Test competing claims/theories
Make future predictions, etc
In a dataset, what are the individual cases?
the objects described by a set of data (what you are observing)
What are 3 examples of possible individual cases?
people, animals,things, etc
What is a variable?
any characteristic of an individual case (or individual)
Fill in the blank.
Variables can take _______ values on __________
cases.
different, different
Where is data usually organized?
in tables
In a table, with dataset provided…
what do the rows represent?
cases
In a table, with dataset provided…
what do the columns represent?
variables
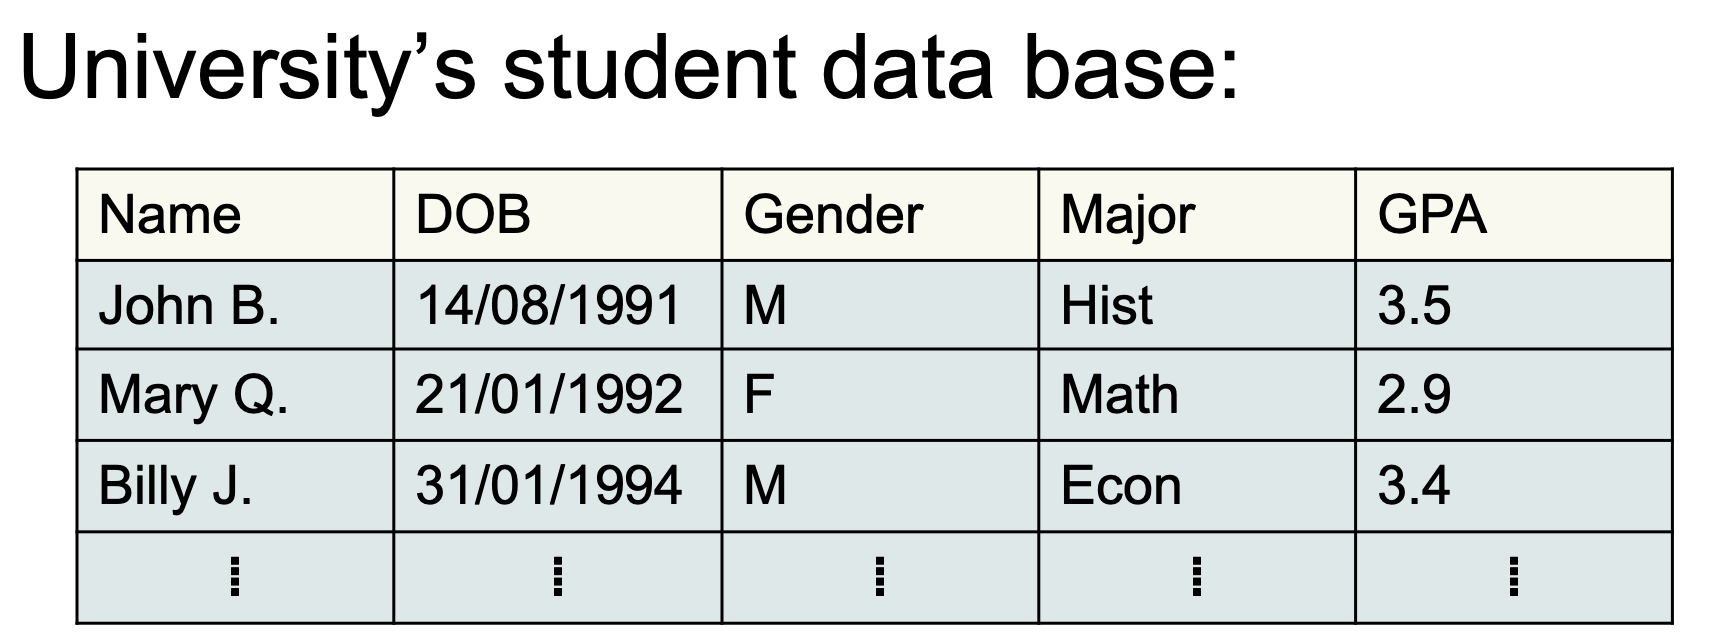
In this image of this particular dataset…
what are the individuals and variables?
individuals : university students
variables : Name (idenitifer variable), DOB, Gender, Major, GPA
When planning a statistical study or exploring
data from someone else’s work, what are the 6 types of questions you should ask yourself?
Why, Who, What and How (and if possible When & Where)
What are the 2 types of variables?
categorical variable
quantitative variable
When planning a statistical study or exploring
data from someone else’s work, what are the “what” type of questions you should ask?
How many variables do the data contain?
Exact definitions of these variables? In what units
of measurement is each variable recorded?
When planning a statistical study or exploring
data from someone else’s work, what are the “why” type of questions you should ask?
What purpose do the data have? Do we
hope to answer some specific questions? Do we
want to draw conclusions about individuals other
than the ones actually have data for?
When planning a statistical study or exploring
data from someone else’s work, what are the “who” type of questions you should ask?
What cases (or individuals) do the data
describe? How many individuals are in the data?
When planning a statistical study or exploring
data from someone else’s work, what are the “how” type of questions you should ask?
How the data collected?
When planning a statistical study or exploring
data from someone else’s work, what are the “where&when” type of questions you should ask?
At what location & time did they collect the data?
What would be classified as “categorical variable”?
A variable that can place an individual case into one of several groups or categories
What would be classified as “quantitative variable”?
A variable that takes numerical values for which arithmetic operations are defined
True or false.
Height & GPA are classified as categorical variable.
False.
True or false.
Gender & Collage Major are classified as quantitative variables.
False.
What are the two different types of categorical variables?
nominal - unordered categories
ordinal - ordered categories
True or false.
Patient condition: excellent, good, fair, poor is an example of an ordinal category variable.
True
What type of categorical variable does this example follow : Major: Mathematics, Statistics or Computer Science?
nominal
What are identifier variables?
categorical variables with exactly one individual in each category.
True or false.
You can analyze identifier variables.
False.
True or false.
Gender is a idenitifer variable.
False.
True or false.
SIN is an idenitifer variable.
True.
What are two ways, we can describe categorical data?
through using tables &charts
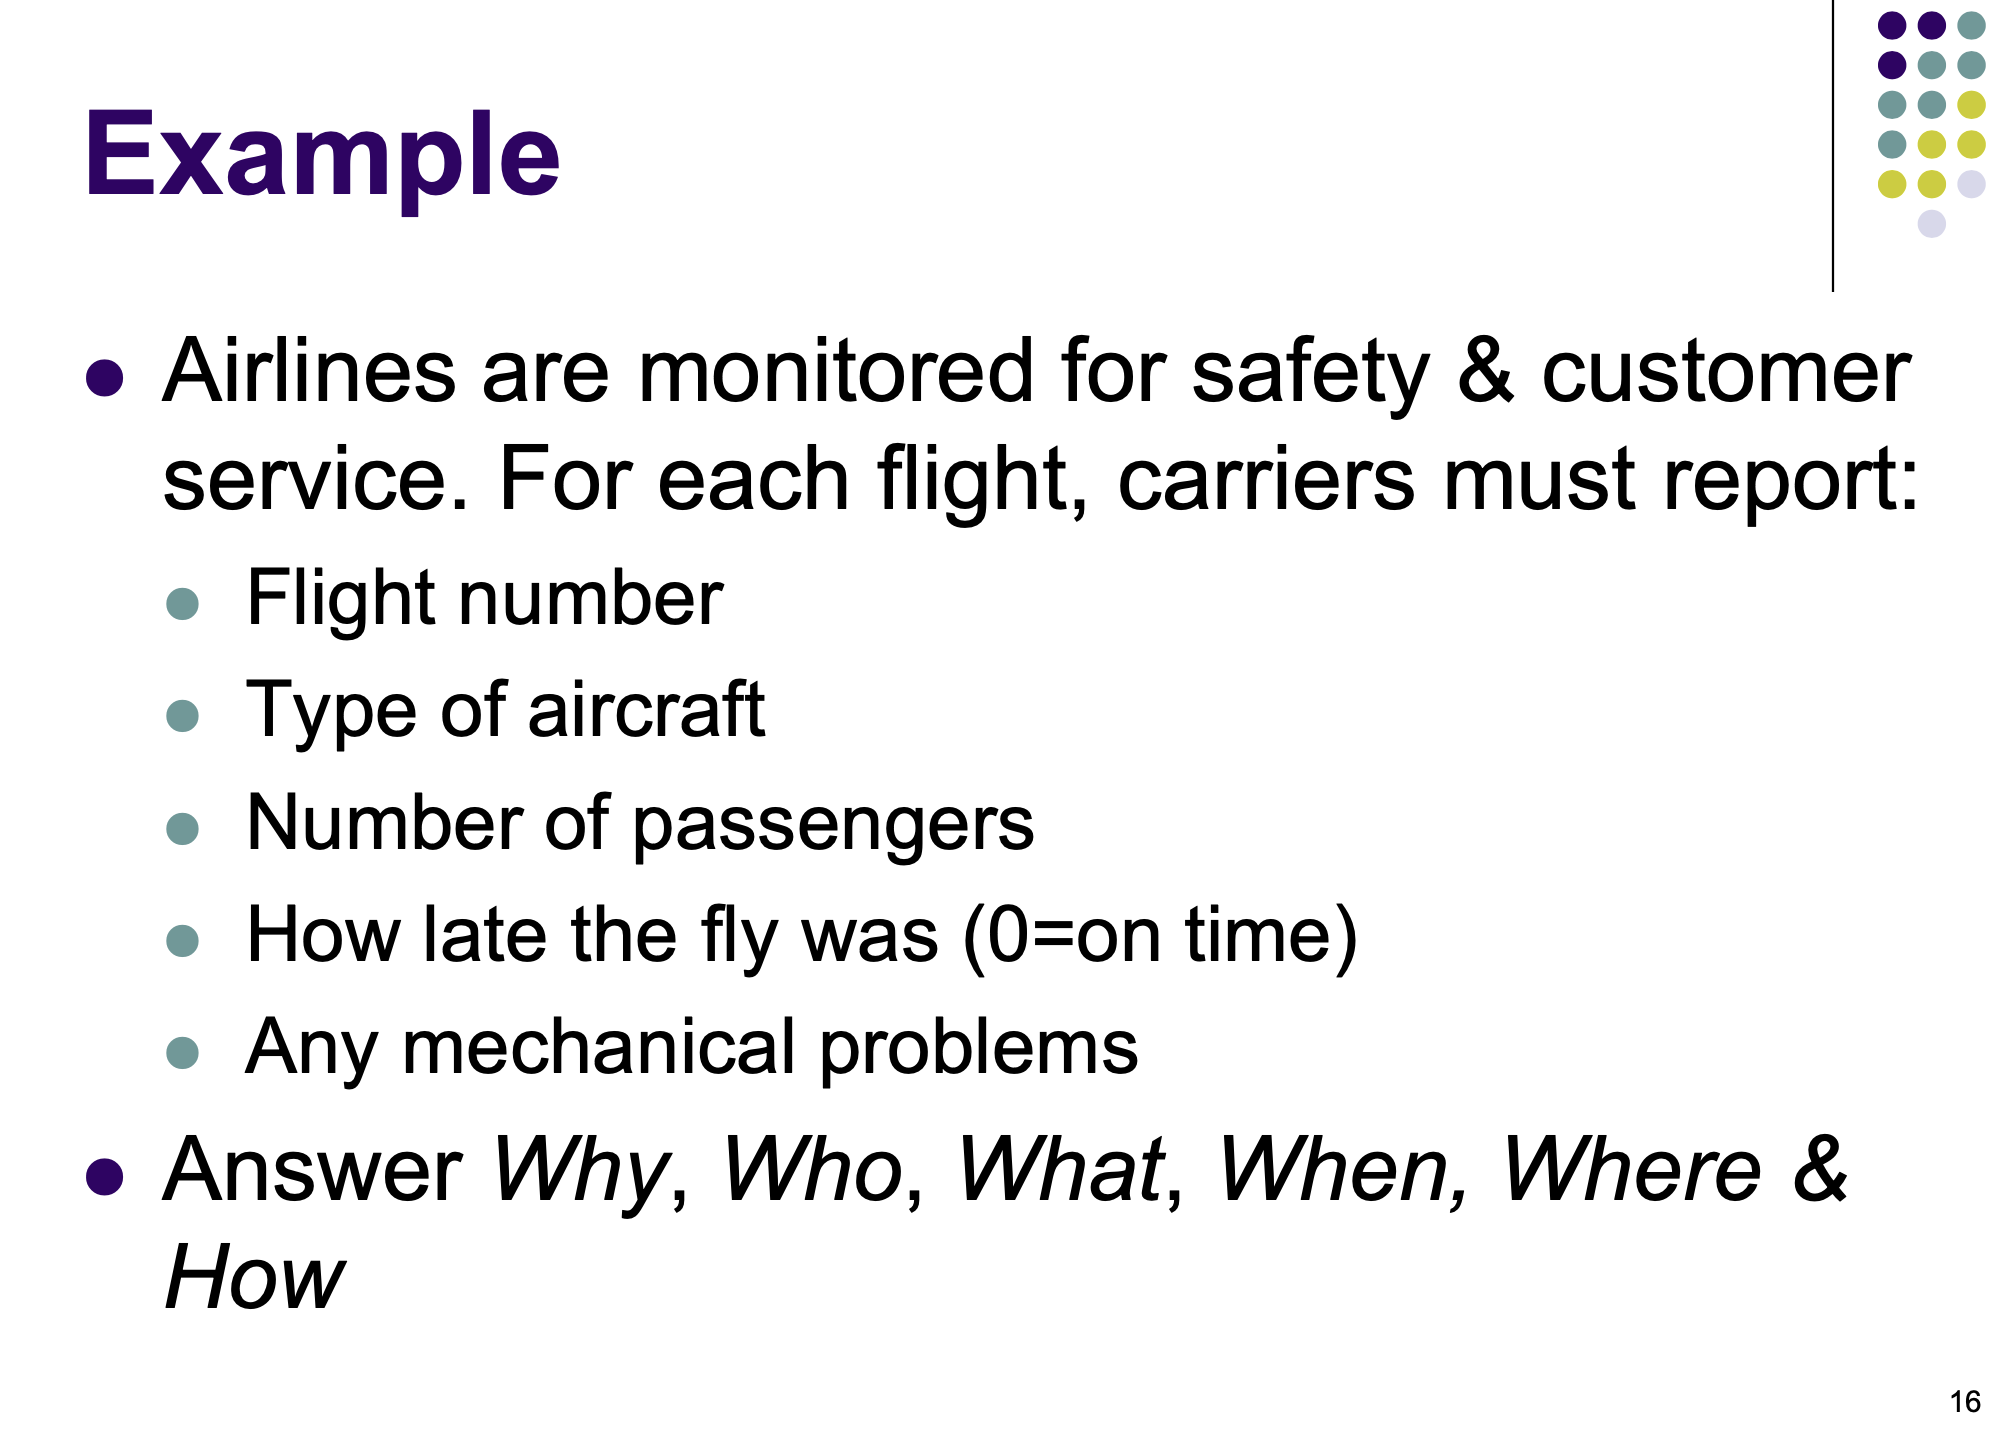
Answer the following :
who (individual cases):
what (variables):
categorical:
quantitative:
why:
when:
where:
how:
who (individual cases): aircraft (flights)
what (variables):
categorical: type of aircraft, any mechanical problems (nominal-type of categorical variable) , flight # (identifier)
quantitative: how late the flight was, # of passengers
why: monitor customer safety and service
when: ongoing
where: worldwide
how: all airlines report flights
What are 3 ways we can describe categorical data in tables?
frequency
relative frequency
contingency table
What are 3 ways we can describe categorical data in charts (visually)?
bar chart
pie chart
side-by-side chart
What are frequency table?
Tables that list all categories and their frequencies.
What do frequency tables describe?
Describes distribution of a categorical variable ( the values & how frequently they occur)

What kind of categorical table is this?
A frequncy table.
What is a relative frequency table?
A table that lists all categories and their relative frequencies.
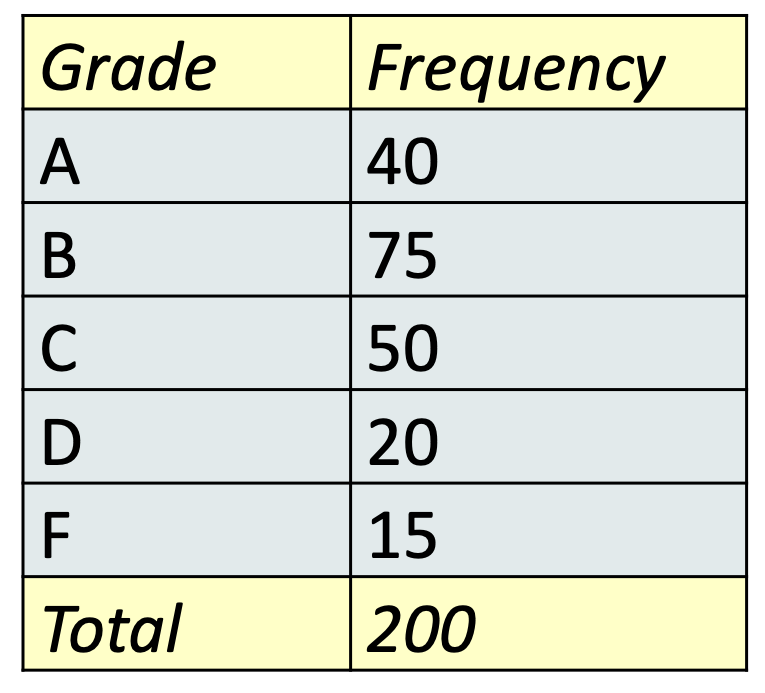
How would you calculate the relative frequency of A given the frequency table?
Rel. freq. (%) of A = 40(frequency) / 200(total) × 100(% ; percentage) = 20%
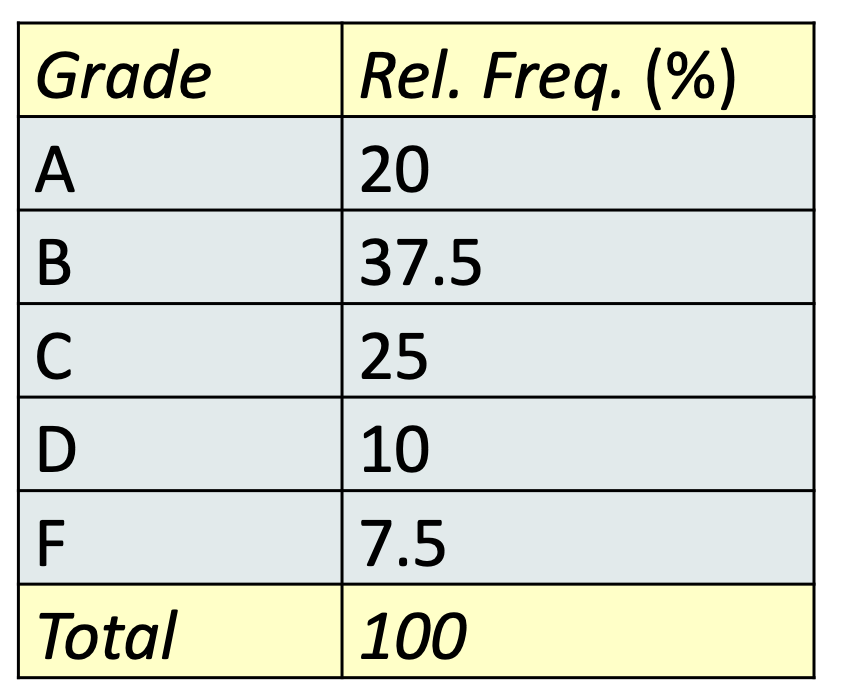
What type of categorical table is this?
Relative frequency table
What is a bar chart?
It’s a chart where each category is represented by bars, (the height of each bar is considered to be the relative frequency)
What is a pie chart?
It’s a chart where the categories ate represented by a pie slices, where the size of each slice is proportional to relative frequency
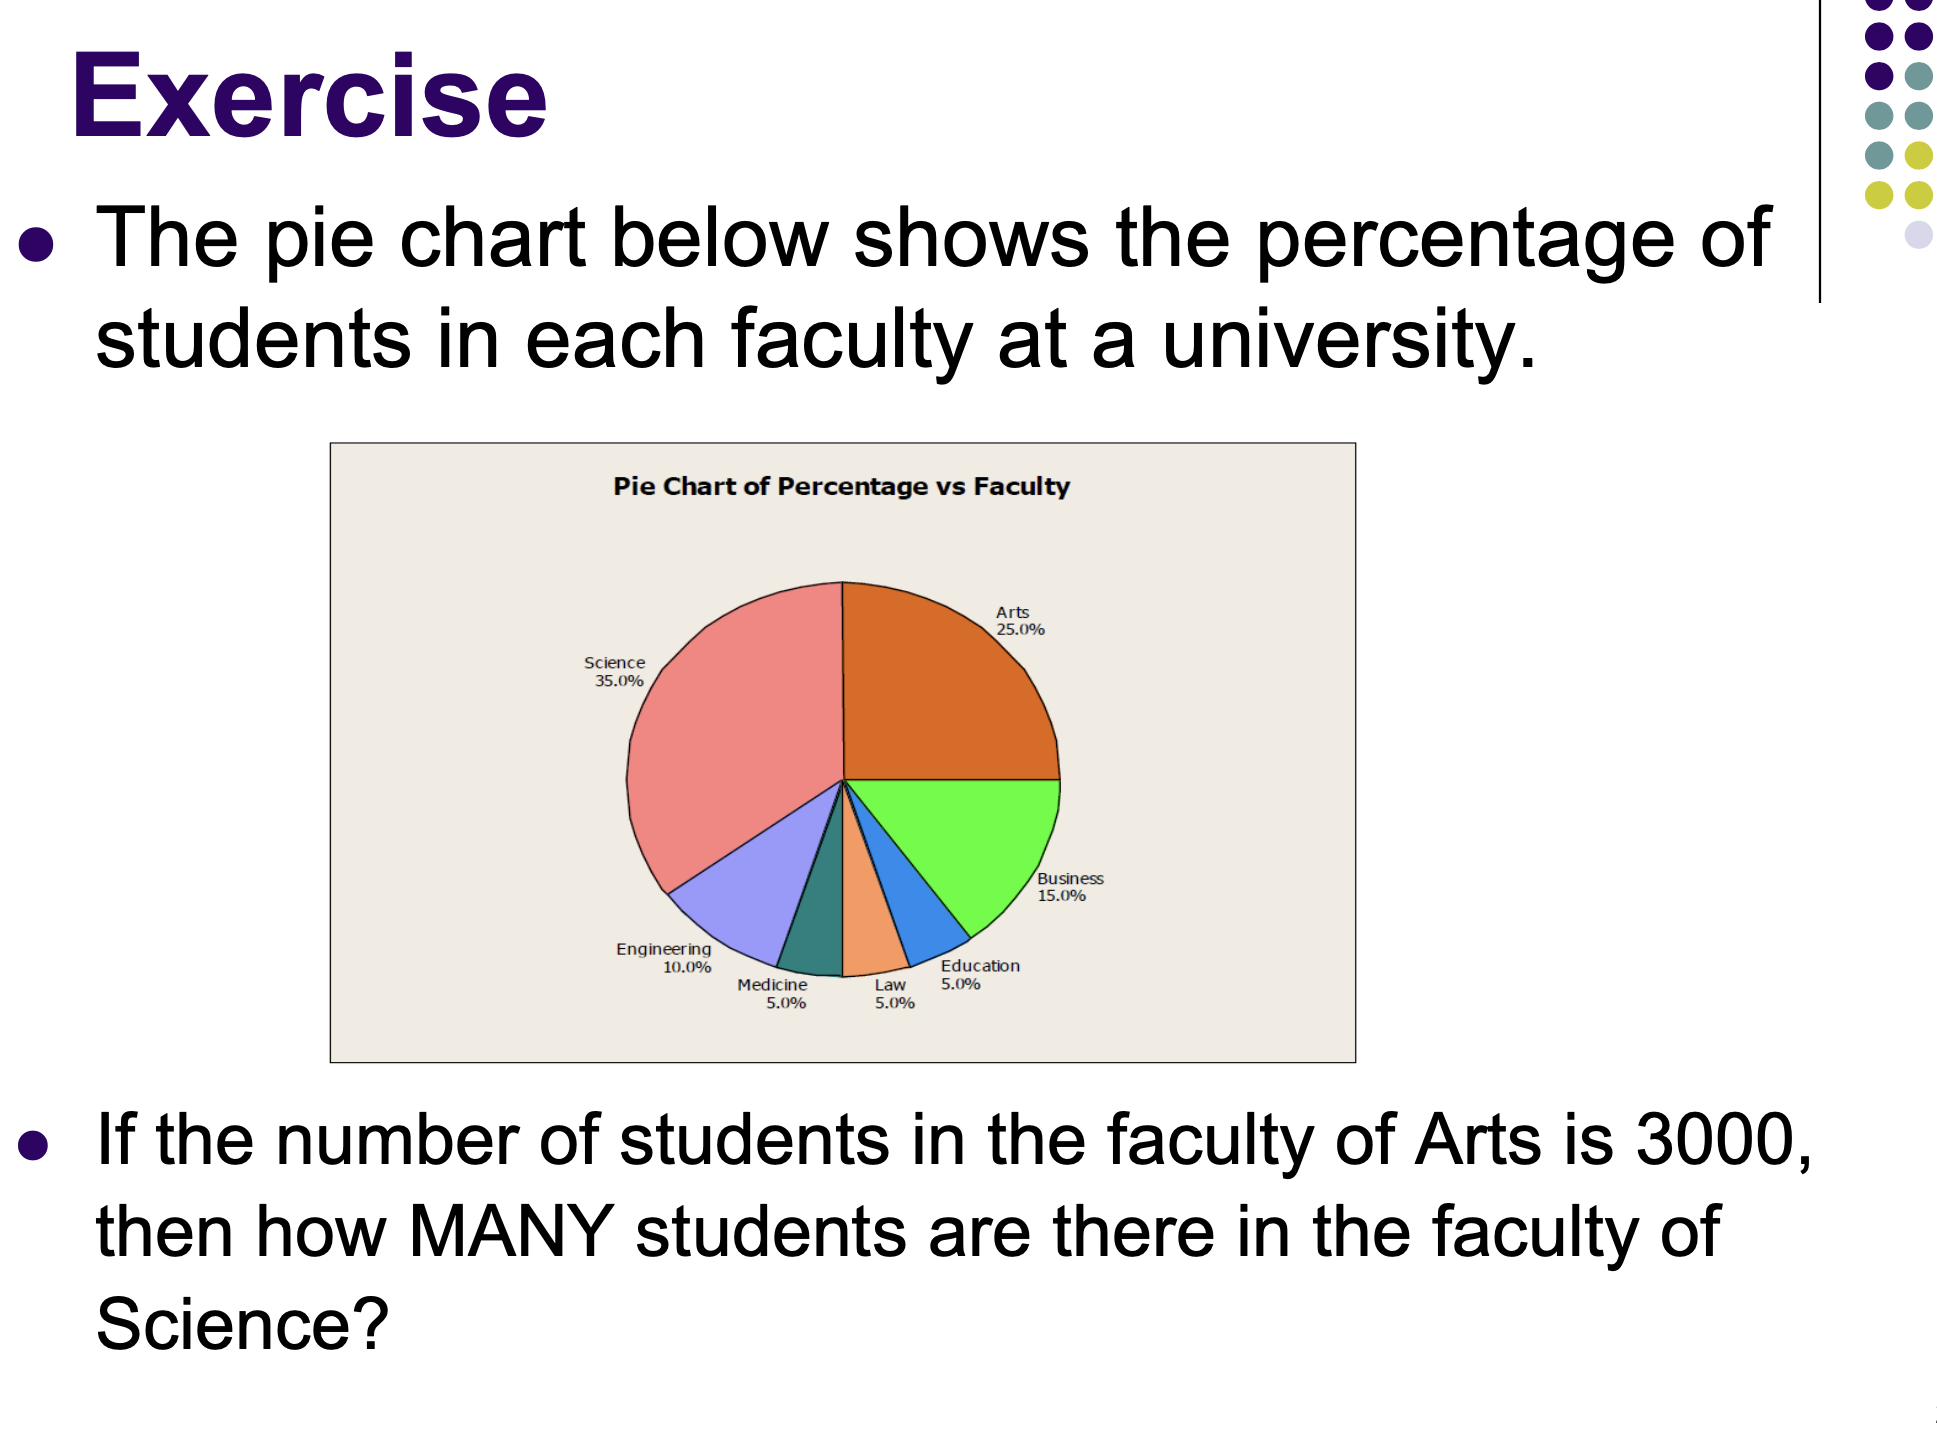
Answer the following question provided on the image.
4,200
What should the distribution of categorical variables always add up to?
100% or 1 in probablity
When adding all values of relative frequency, they should all give you?
100%