Chi-Square Analysis (11/1-11/4)
1/8
Earn XP
Description and Tags
Recommended: Learn mode but only with Flashcards
Name | Mastery | Learn | Test | Matching | Spaced | Call with Kai |
|---|
No analytics yet
Send a link to your students to track their progress
9 Terms
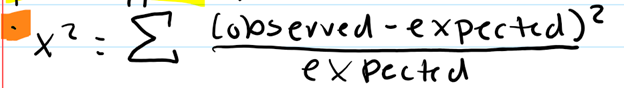
Chi-Square Test (Hint: 2)
Used to determine if the results are due to chance
x2 = the sum of ((observed – expected)2/expected)
Observed
The numbers of each phenotype resulting from an experimental cross
Expected
Predicted from the Mendelian ratios
Goodness-of-fit
How well does the data fit the expected hypothesis
Null Hypothesis (Hint: 2)
There is NO significant difference between the observed and expected results
Random chance alone is responsible for the deviation between the observed and expected phenotypic ratios
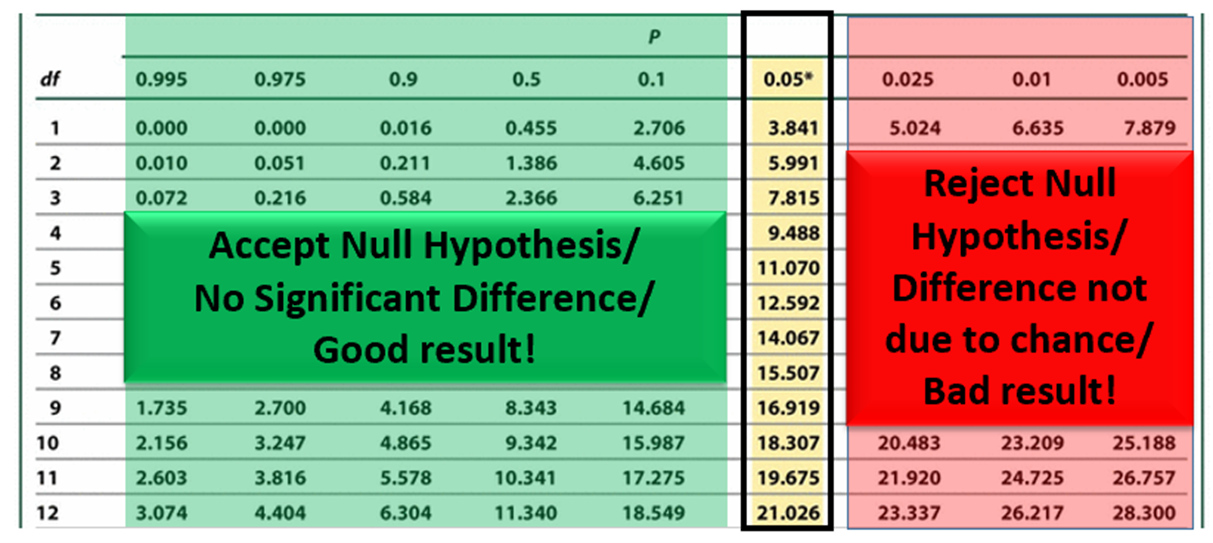
Chi-Square Table: Across the Top (Hint: 2)
The probability (p) that the deviation from the expected is due to chance
Example: At the left: p = 0.995: 99.5% chance that the result is due to random chance
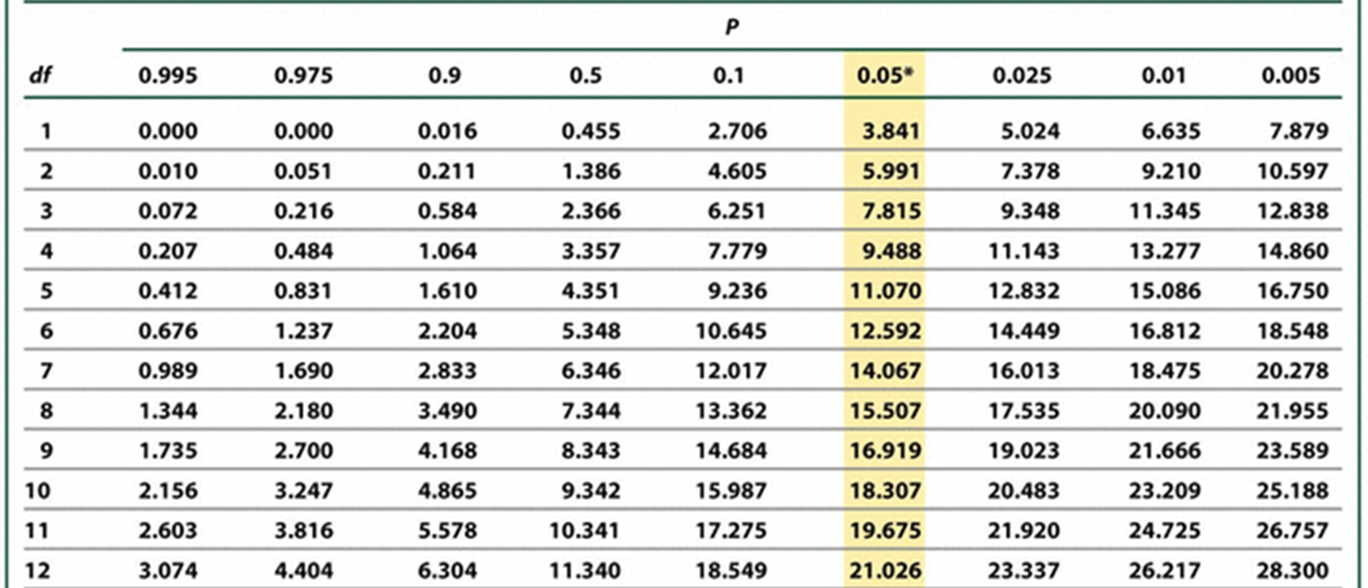
Chi-Square Table: In the Body (Hint: 3)
x2 values that correspond with different probabilities
Small numbers correspond with high probability on the left
Large numbers correspond with low probability on the right

Degrees of Freedom (df) (Hint: 2)
x2 tests have different numbers of components and will produce different numbers that correspond to the same probability
df = n-1 (n = number of categories (in this case the number of possible phenotypes))
What is the threshold for significance?
p < 0.05