Lecture 6 - Population Ecology
1/67
There's no tags or description
Looks like no tags are added yet.
Name | Mastery | Learn | Test | Matching | Spaced | Call with Kai |
|---|
No analytics yet
Send a link to your students to track their progress
68 Terms
Population ecology -
how the collective life histories of individuals collectively impact the ennvironment.
Population -
a group of individuals of a single species inhabiting a specific area
-interbreeding
Distribution -
geographical range of an organism
spatial arrangement of individuals in a local population
BALANCE OF PUSH/PULL
Density -
number of individuals in a population per unit area
-ex: population size/total land area
22 students/classroom
Abundance -
number of individuals of a species present in a particular ecosystem or area
Area based counts:
individuals in a given volume are counted
-SESSILE organisms
-plants, oysters, snails
Distance methods
distance of an individual from a line or point are converted into estimates of abundance
-detection function
-FAST MOVING SPECIES
-rabbits, falcons
Mark-recapture studies -
-subset of individuals captures and marked or tagged, then released and at a later date recaptures and ratio of marked:unmarked individuals is used to estimate population size
-MOBILE ORGANISMS
Geographic range -
entire geographic region over which a species is found
What are the abiotic factors of geographic range?
climate, topography, disturbance
What are the biotic factors of geographic range?
competition, predation, resources, etc.
What is the greatest limit to distribution and abundance?
Habitat sustainability.
Why do creosote bushes have a wider range than saguaro cacti?
because they are more tolerant of arid climates and cold temperatures
Why are saguaro cacti limited so much in their geographic range?
Because they can’t exist where it is ever freezing more than 36 hours.
What species is of least concern and why?
Coyotes because their distribution expanded with CC and human disturbance.
Dispersal and distribution
history of dispersal, (immigration and emigration)
-Polar bears happened to heat to the N pole when Pangea split.
Where species evolved and distribution
limits whre they are now (naturally) found, even when environments are similar.
Resource availibility and distribution
space and food is FINITE
competition repels species
Attractants
species will follow/cluster
Disturbance frequency
damage that may wipe out individuals
opens space for others that may be a mediator.
Random pattern of dispersal
all are relatively neutral
don’t help or hurt to be near each other.
Regular pattern of dispersal
uniformly spaced through environment
usually negative effects if too close to one another
antagonistic interactions between individuals or local depletion of resources.
Clumped pattern of dispersal
individuals live in area of high local abundance, separated by areas of low abundance
Seychelles warbler is an example of what?
Clumped populations towards center of island
because salt spray from ocean was killing the plants they needed as vegitation
Dispersal
can increase/decrease local populations with immigration/emigration
Meta populations
dispersal leading to group of spatially separated sub populations connected by active exchanges in individuals
Africanized honeybee is an example of what?
rate of population expansions being different by species.
-stopped in S as they were too hot, and N US in 2008 due to winters killing them off.
Climate change has variable effects on what?
the rate populations expand depending on species
Why are populations dynamic?
Because their abundance varies over time
Natality
Birth rate B
Mortalitiy
Death rate D
immigration
individuals going INTO a population I
emigration
individuals LEAVING a population E
What are eurasian collard doves an example of?
Logistical growth and how exponential isn’t realistic long ter
they were estimated to be exponentially growing, but numbers showed they were were 10 years behind.
N =
current population
-the higher this number, the lower the rate of increase
r =
rate of increase
the closer to k, the slower you can add to the popultion
K =
carrying capacity
Life Tables
sum of how survival and reproduction rates vary with the age of individuals in a population
used to predict future population trends and develop strategies for population management
Cohort -
individuals born during same time period
-longitudinal tracks actual mortalitiy experience of a specific group born in the same time period
With cohorts
survivorship is DIRECTLY OBSERVED
Age-at-death-observed time table
calculates parameters, with probability of dying and number of deaths
-estimated a cohort’s life table on known stages of death
Static life table
records number of living individuals of each age in a population at a specific time
sometimes uses age at death data
estimates cohort life table based on survival of individuals of different ageas during a single time period.
WE MUST KNOW THE AGES
ex: tree tings, dental wear
Survivorship curve
summarized pattern of survival in a population
Type I survivorship
high survivorship - with young and middle age individuals, high mortality rates with older individuals
humans, sheep, large mammals
Type 2 survivorship
constant rate of mortality and survivorship
songbirds, turtles, fish
Type 3 survivorship
high mortality rates when young
ex: insects, plants, marine invertebrates
fecundity
Fecundity in ecology is the measure of an individual's or population's biological capacity to produce offspring,
-u the number of female offspring produced per female over a specific timeframe
What are teds? What are they an example of
TURTLE EXCLUDER DEVICE - example of conservation management, since life tables revealed we needed to focus more on adult protection and not just hatchling protection
Age structure distribution -
the proportions of populations in each age class (interval)
Population momentum -
continuation of population grows as females reach reproductive age
Wide base in an age stucture =
high reproductive potentials and population growth POSITIVE GROWTH
-less developed countries ex: Guatemala
Narrow base in age structures =
low reproductive potentials and low population growth
NEGATIVE GRowTH
-more developed countries ex: Japan
Oak tables showed that
There was a high population of 50 year old individuals, which would go on to replace the older oak trees (positive growth
Rio grande tables showed that
there were very little younger individuals, meaning they weren’t there to replace the older ones, (40-50 years old) and they are unlikely to persist (negative growth)
Human population growth has been
FASTER than exponential in the last 2000 years
Why is human population growth so rapid?
agriculture, increased resources
modern medicine and lower death rates
expansion all over the globe
Ecological foot print -
estimate of the amount of land required to provide raw materials an individual or population consumes
fuel, water, shelter, waste disposal
NOT equally distributed across the planet
Carbon footprint -
total set of green house gas emissions cause by an individual, event, organization, or product
From 1950-2010 we saw what
population growth occured more in lesser developed countries
relatively steady
in more developed countries it was more static
Geometric pattern
J - shaped SET OF POINTS
synchronous repro at discrete time periods - “breeding periods”
To predict geometric population growth BEYOND one period at a time
N t+1 = 𝜆N t
pop size at time t!
geometric
𝜆
geometric population growth
t
time frame
exponential over ONE period of time
exponential growth beyond one period of time
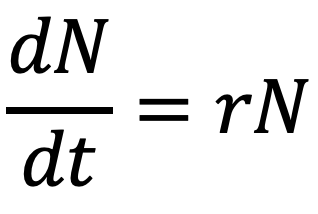
Exponential pattern
continuous repro pops change size by constant proportion at each instant time
J-shaped CURVE
dN/dt = rN(1-N/K)
Logistical growth is LOGICAL - and has k to keep things from getting out of hand.
occurs when increasing rapidly at first, then stabilizes at a carrying capacity.
Carrying capacity - (k)
maximum population size that can be supported indefinitely by the environment