Age & Growth
1/25
There's no tags or description
Looks like no tags are added yet.
Name | Mastery | Learn | Test | Matching | Spaced | Call with Kai |
|---|
No analytics yet
Send a link to your students to track their progress
26 Terms
Why are there so many studies on age & growth?
Conservation & management
Easier to study & more doable historically
General findings on Easmobrnch age & growth
hard part bands can be used to age elasmobranchs
Bands in hard parts represent an annual mark
Mature late (4-25 years) & grow slowly
Can live very long 5-over 70 years (Greenland sharks estimated 400+)
Important to know for management and conservation of a species or population
What does a population growth curve look like?
y-axis: # of individuals in a pop
X-axis: time
One showing several different lines with R values
Represents exponential growth- growth under most ideal conditions with unlimited resources, determined by how many offspring they can have, and generation time (avg age they reproduce at)
Shark pops can’t grow fast- not a lot of offspring, late sexual maturity, long generation time
#1 method for determining age and growth
Growth zones in calcified structures (Vertebral centra!!!, sometimes dorsal spines/caudal thorns)
wide opaque (not transparent bands) in summer, dark
Narrow translucent (semi, transparent bands) in winter, light
New growth is laid down on the outer edge of the centrum
How to actually look at vertebral centrum
section and stain bands to make more visible (silver nitrate, crystal violet)
Use 2 people to red the same centra and see if counts are consistent
Make an age bias plot with each reader # of bands on each axis and see how good line of fit is
What is plotted based on age estimates determined?
Growth curve
typically pot fish length as a function of age (or # of rings/bands)
Use one of three shark length measurements: PCL=precaudal length, FL= fork length, TL = total length
Typical growth curve strats off fast and then levels off when they reach sexual maturity because theyre not putting energy into growth anymore, rather reproduction
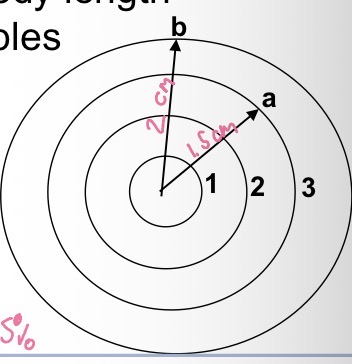
Back calculation
Radius a = 1.5 cm
Radius b = 2 cm
Shark toady = 4 m
For an individual shark you can determine what its length was at each previous age (each vertebral band) based on proportionate growth relationship of shark length and vertebral radius
the vertebral radius grows at the same rate as the body length
Ring radius/centrium radius = proportion, then %/ length of fish at that age= fish length
If radius to growth band 3 is 75% of the total vertebral radius then at age 3 the shark was 75% of its present length
1.5 cm/2cm =0.75 (75%), 0.75 × 4m = 3 m
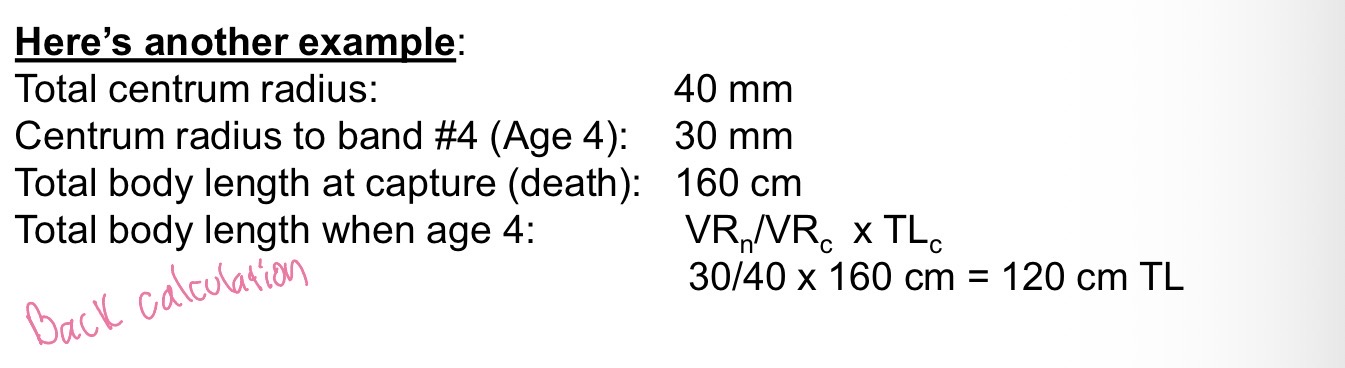
Back calculation method 1
TLn= VRn/VRc x TLc
Total length Typical growth= Vertebra radius (at age n (ring))/Vertebra radius (at captured) x Total length (captured)
Back Calculation method 2
plot a liner regression for shark eight against total centrum radius for sharks of a wide range of lengths, then for each individual shark product length at prior ages based on the radius to each band using regression equation
TL = 63.2 + (16.7)R → Y= b +mx
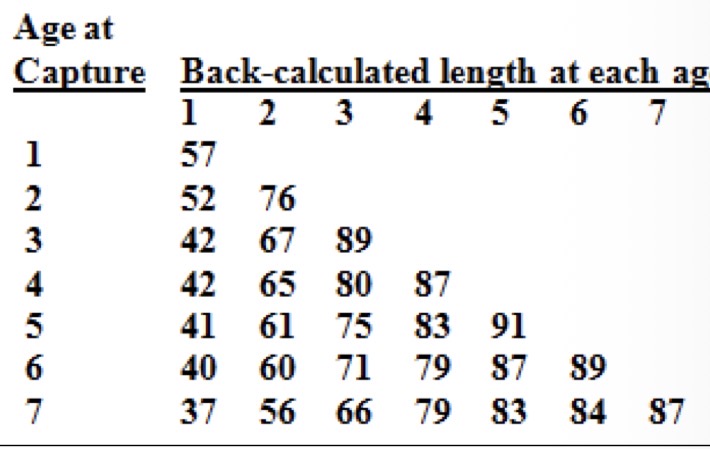
Back Calculation tables *what do you notice, what’s this called, give example
Shows back calculated length of each shark at each age of its life
The older the shark the smaller they are when they were 1 year old than the sharks captured at younger ages
Causes: smaller sharks are more successful when they are younger
Rosa Lee Phenomenon: for large (old) sharks, average back calculated sizes at young ages are smaller than average back calculated sizes to the same young ages for smaller sharks
lemon sharks that grew faster were more outgoing “bolder”→ ecologically they spend more time out in the open where theres more food but also more predators so don’t make it as much as the smaller “shyer” sharks that stay in the mangroves
2nd method for determine age & growth
Size frequency analysis:
examine size modes of cohorts by analyzing numerous cohorts at a point in time
following size distribution of n individual cohort through time
Cohort= group of individuals born t the same time
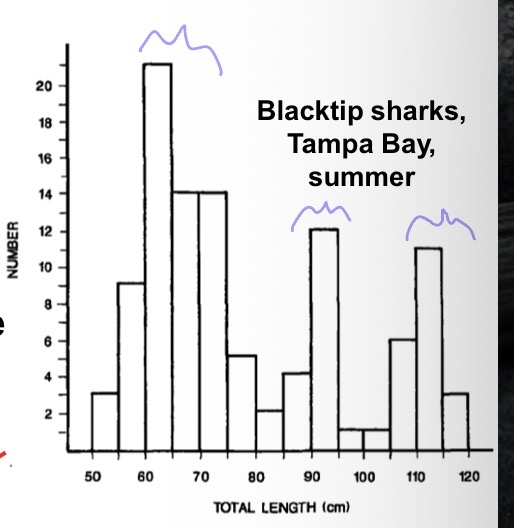

What do you notice about this figure?
This is an example of examining size modes of cohorts by analyzing numerous cohorts at a point in time
trimodal distribution of juvenile sharks→ indicates that they saw 3 different cohorts
Juvenile doesn’t mean all the same age, the study looked at individuals with 1, 2 or 3 vertebral rings
Peaks are distinct in first several years of life but then become too similar
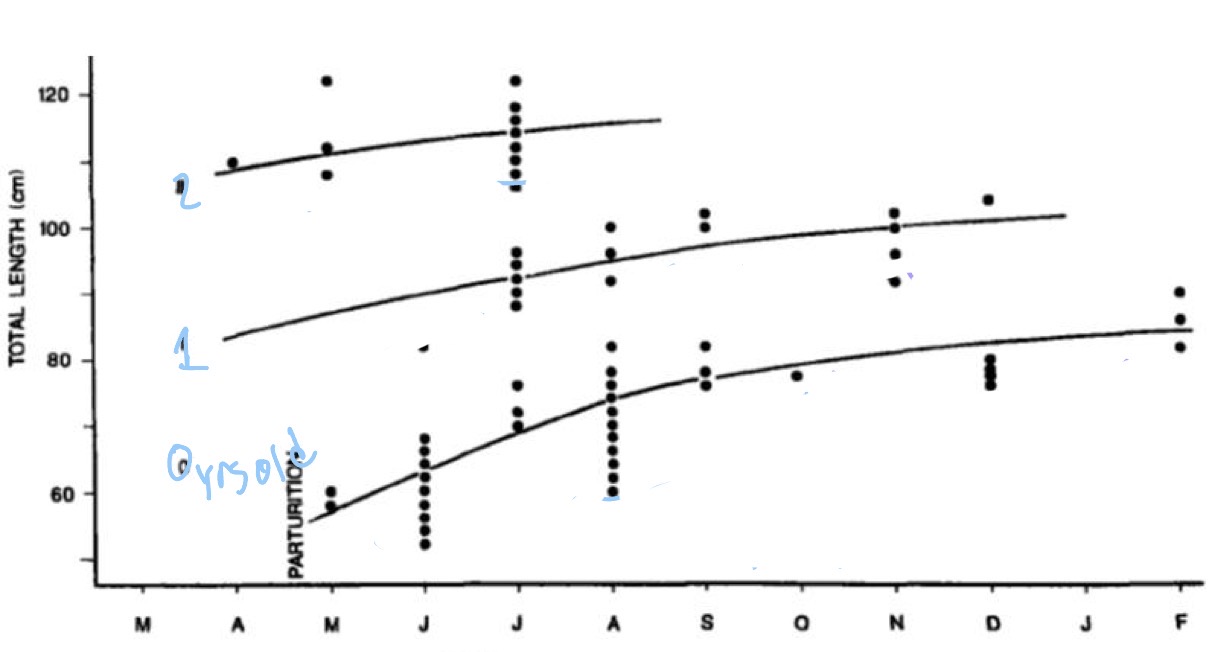
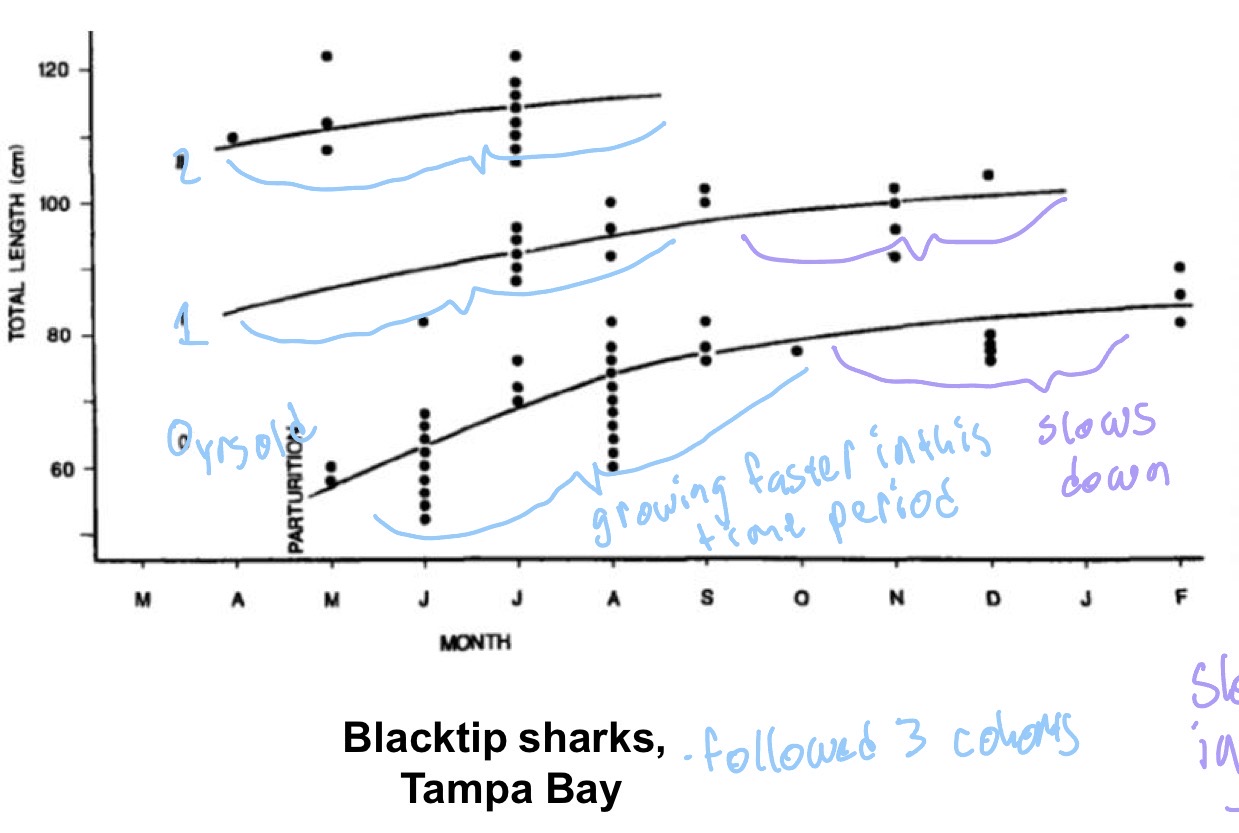
Explain what’s going on in this figure- what size frequencies analysis are they doing?
Following size distribution of an individual cohort through time- measure the growth by following a cohort every month
all the curves show faster growth at first and then level, even though there are 3 different ages and this is only over a 1 year period
Have fast growth in summer period and then slows down at winter time due to colder water & less prey
3rd method for determining age & growth
Mark & recapture:
measurement at initial capture
Recapture later and re-measure
Provides info on growth at specific intervals of time for sharks of different size
Have to tag a lot not ideal
4th method used to determine age & growth
Laboratory growth analysis
used for some species with poorly calcified vertebrae or to determine periodicity of growth zone formation
Periodicity of vertebral rings
How often are the bands laid down in vertebral rings, ie what time period does the band represent
1st method used to determine periodicity of vertebral rings?
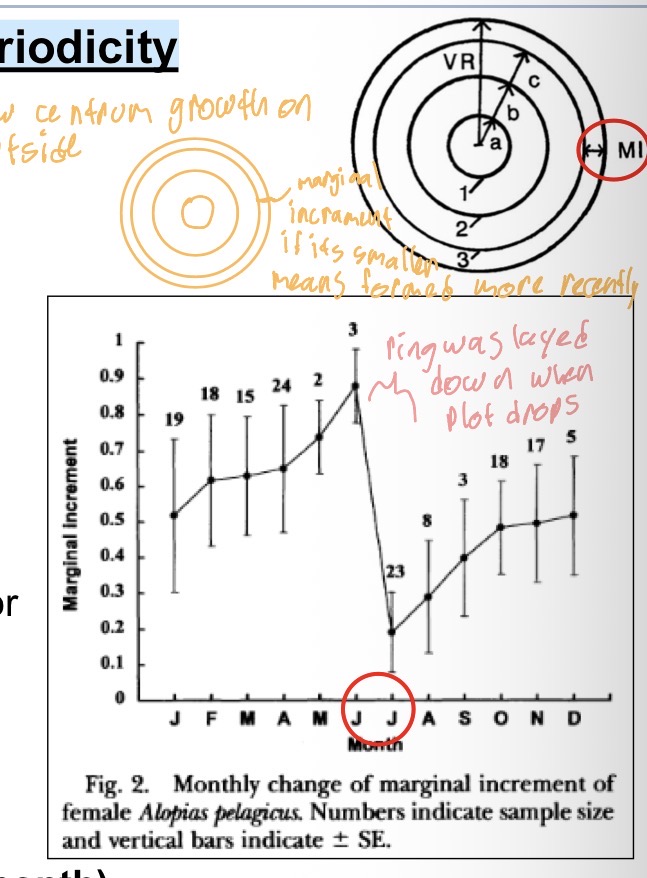
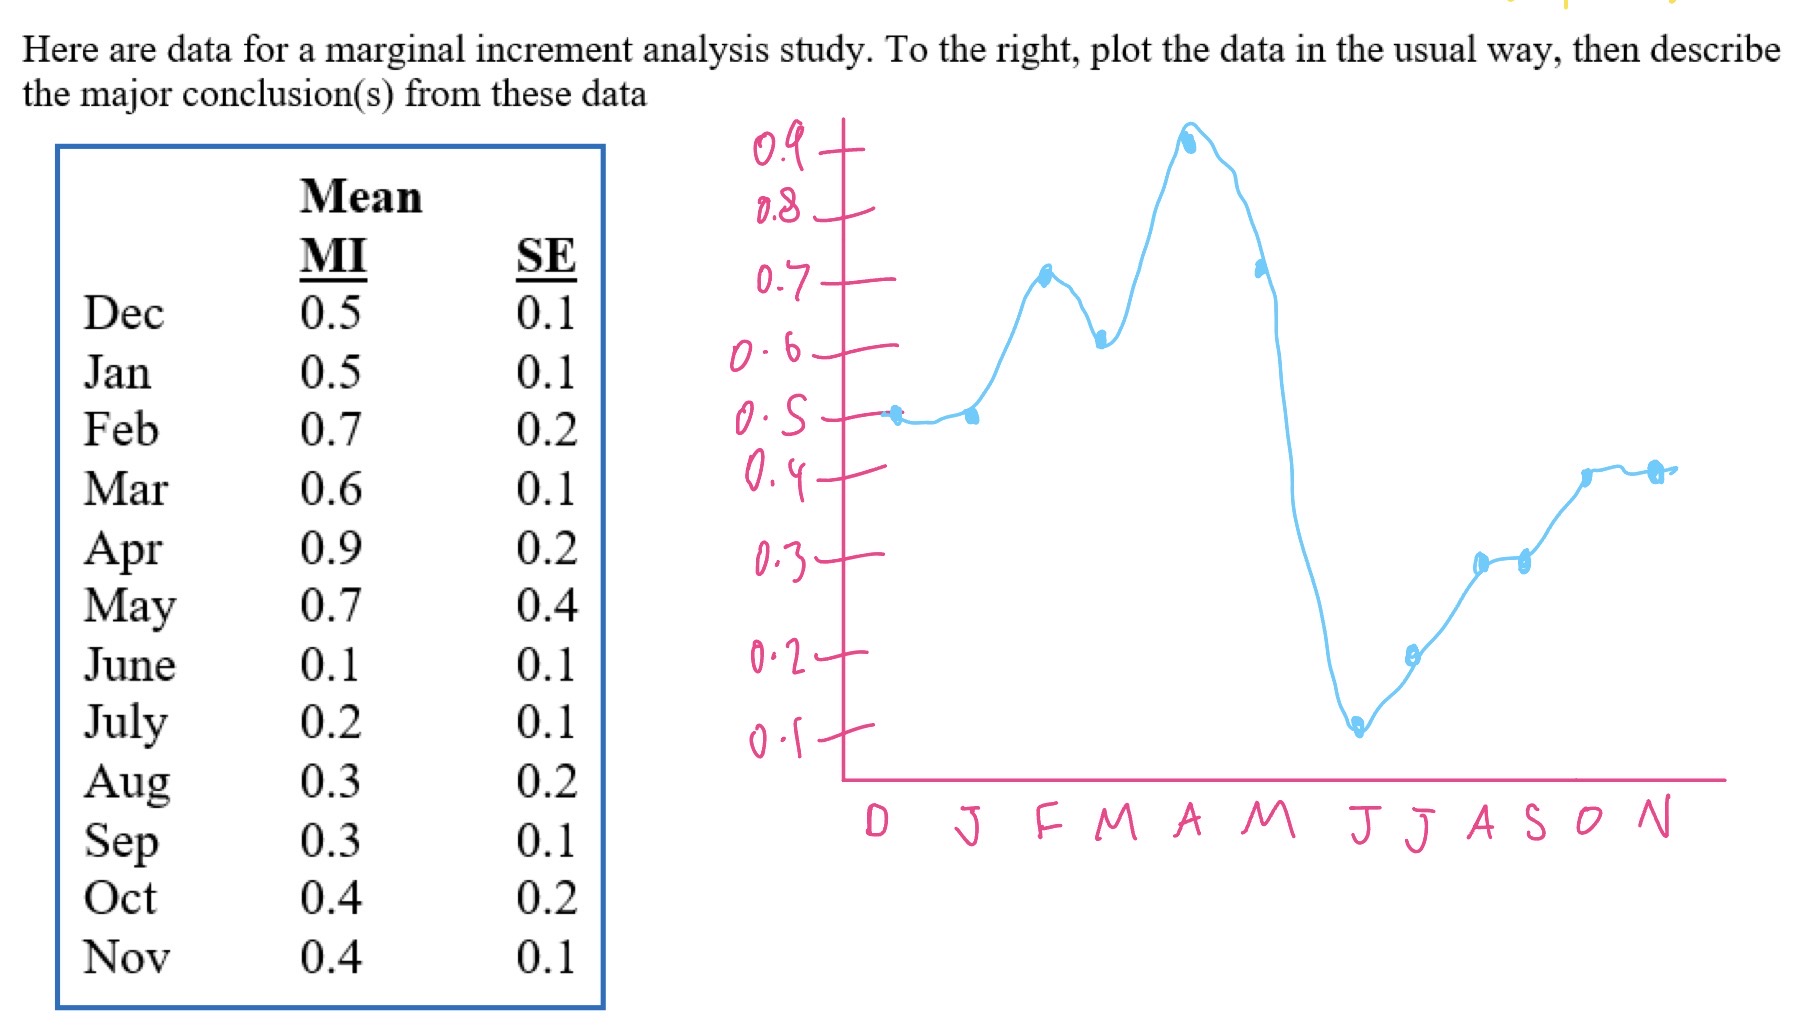
Relative Marginal Increment analysis RMI or Marginal Increment Ratio (MIR)
measurement of distance from last band to centrum edge for each month → bc new centrum growth is on outside edge of centrum
If distance is very small then last band was recently laid down
If distance is large then last band was laid down months ago
On marginal increment plot over time, the ring was layed down when the plot drops
Tells us that this ring was laid down between June & July, and theres one band per year
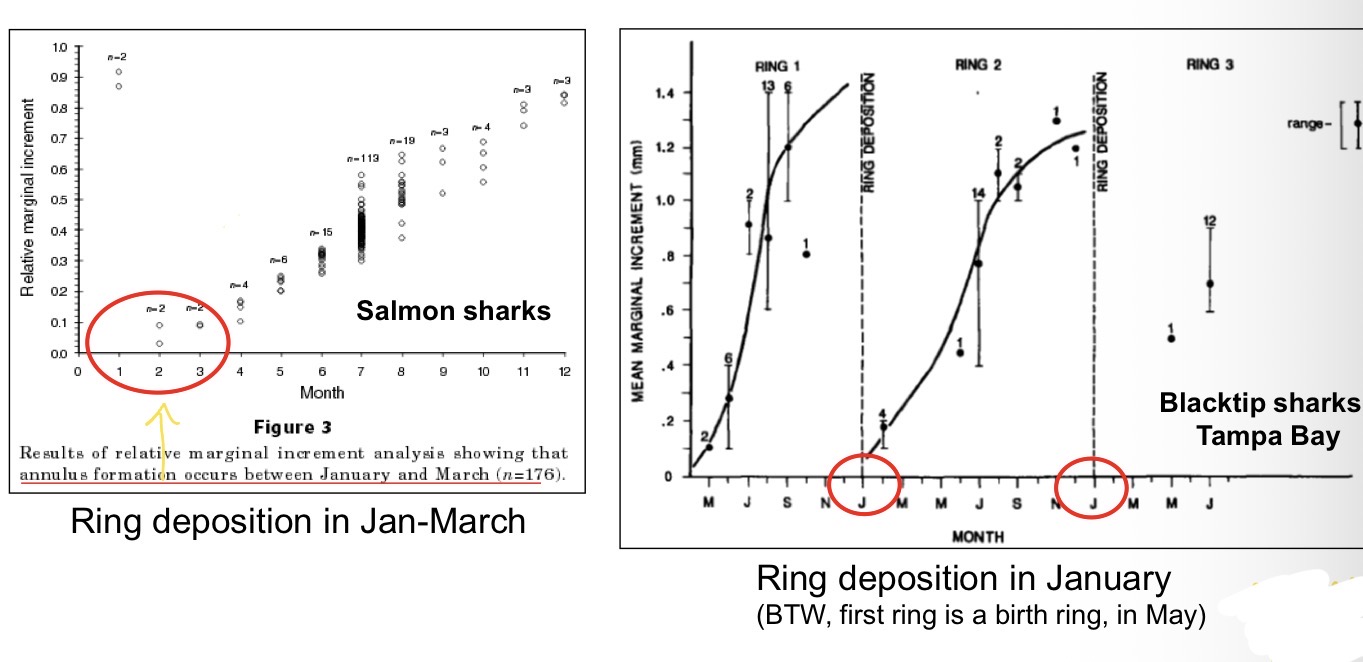
Ring deposition in Jan-March once a year
Ring deposition in January once per year
Ring deposition occurs between March and June and occurs once per year
2nd method for determining periodicity of vertebral rings
Tetracycline or oxytretracylcine (OTC) marking
injecting OTC into a live shark leaves a permanent discrete mark on the outside edge of calcified structures (centrum) as they are being formed/laid down
Upon recapture, vertebra centrium is dissected out and the number of bands laid down since its been OTC marked is counted to determine ring periodicity
If shark ws injected in 2015, ecaptured in 202, and there are 5 bands distal to the OTC marked then bands were laid down annually
3rd method for determining periodicity of vertebral rings
Bomb carbon: based on decay of C14 released during atmospheric nuclear bomb testing in late 1950s/early 60s (arms race) → atmosphere food w/C14 & it made its way into food webs and plant material
leaves a permanent known marker in vertebral central like OTC if shark was alive during 50s-60s
Useful for still alive long-lived species, and shorter lived species with archived vertebral collections with a known capture date → if know capture date see how many years before that it was the 50s/60s
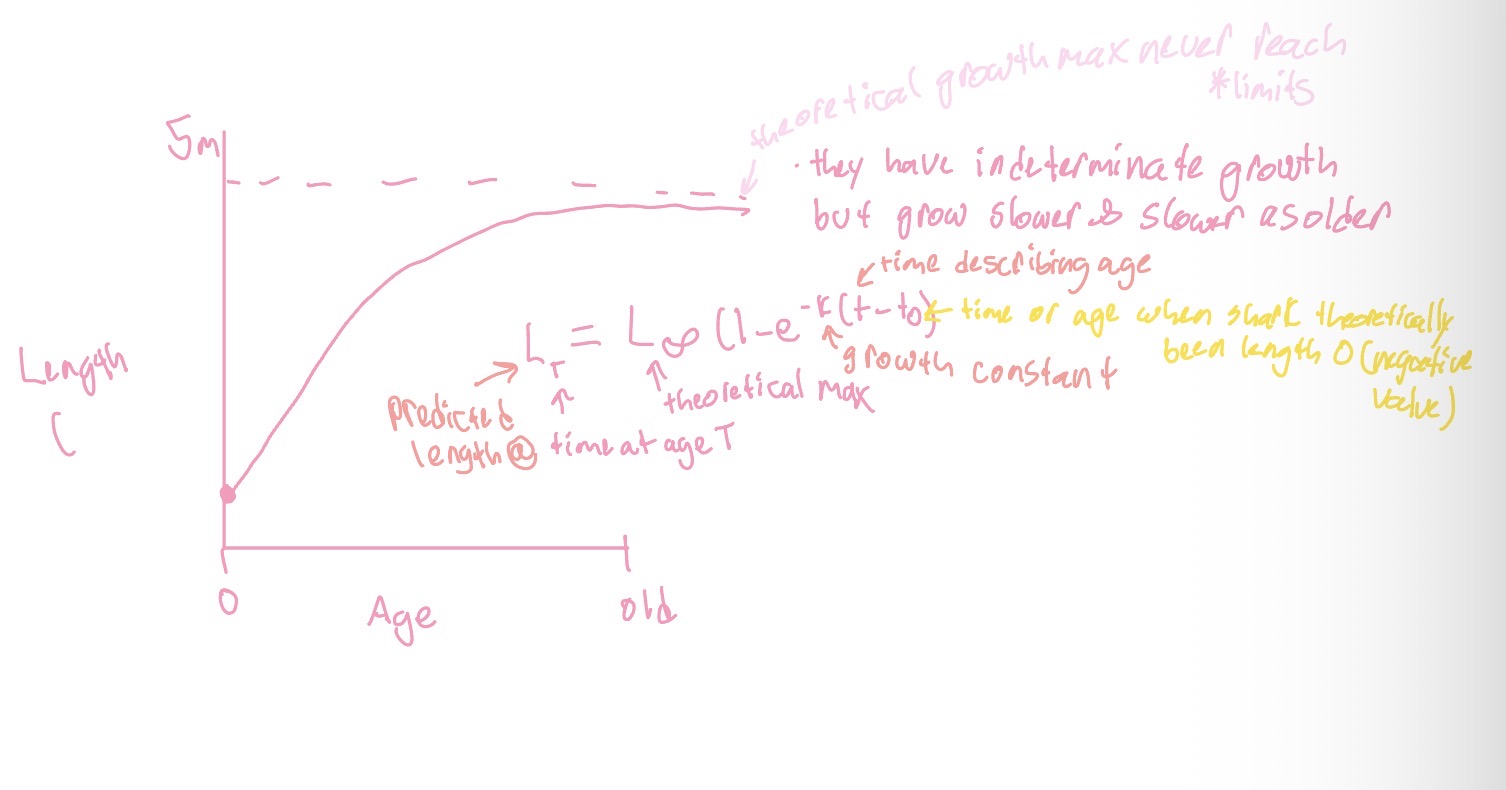
Von Bertalanffy growth equation (vb curve)
Equation that predicts fish length at any given age, based on indeterminate growth to theoretical maximum length
Lt = L infinity (1-e^-k(t-t0))
Lt: predicted length at time t
L infinity: theoretical maximum length
K: growth constant; describes rate at which an organism grows
t: time (age)
t0: time when organism would have theoretically been length 0 (a negative)
indeterminate growth by grow slower and slower as older, never actually reaching theoretical growth max (limits)
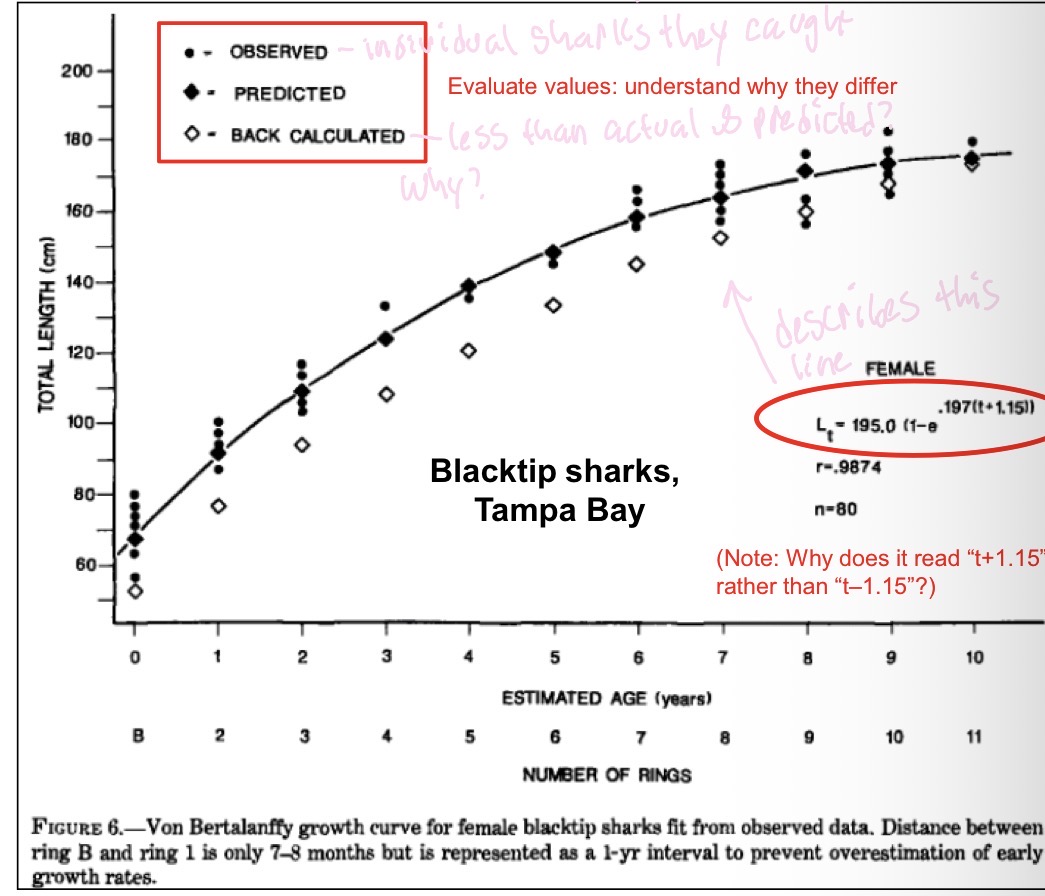
Why are the back calculated lengths lower than the predicted and observed?
When back calculating an age your back calculating it to January (or whenever the ring was laid down) but these sharks were caught in summer so they’ve grown since then,
Study of Age & Growth in Bullsharks in Southern Gulf of Mexico
used vertebral centra to age
Got sharks from fishermen- unidentified to sex dont know why
Used marginal increment to verify tempora growth ring formation & reported Von Bertalanffy curve→ found difference btw sexes, females larger
Had chart of centrum radius vs vertebra # → bc they sample the same singular vertebra from each shark for aging and want to figure out the biggest one
Used MI= (R - r)/(rb - rb-1): R is centrum radius, rb is radius to last ring before newest, rb-1 radius to ring before that, divide by those values to adjust for the fact that young sharks have faster growth than older ones
Know females are sexually mature by cutting them open to see if theyre pregnant and then use youngest aged one to say when they reach sexually maturity
How to age a Greenland shark
Use carbon dating bc they can’t use rings bc they don’t have enough calcified parts
[C14] in organisms is reflective of atmosphere when alive, when die they don’t get new C14→ it starts to decay & breakdown, so you can tell how long ago the thing died based on how much C14 is left
Use Lens of eye: eye lens proteins are put into the embryo→ these are inert (dead organic tissue in eye) so starts decaying when born like when something is dead, can use to date to when it was born
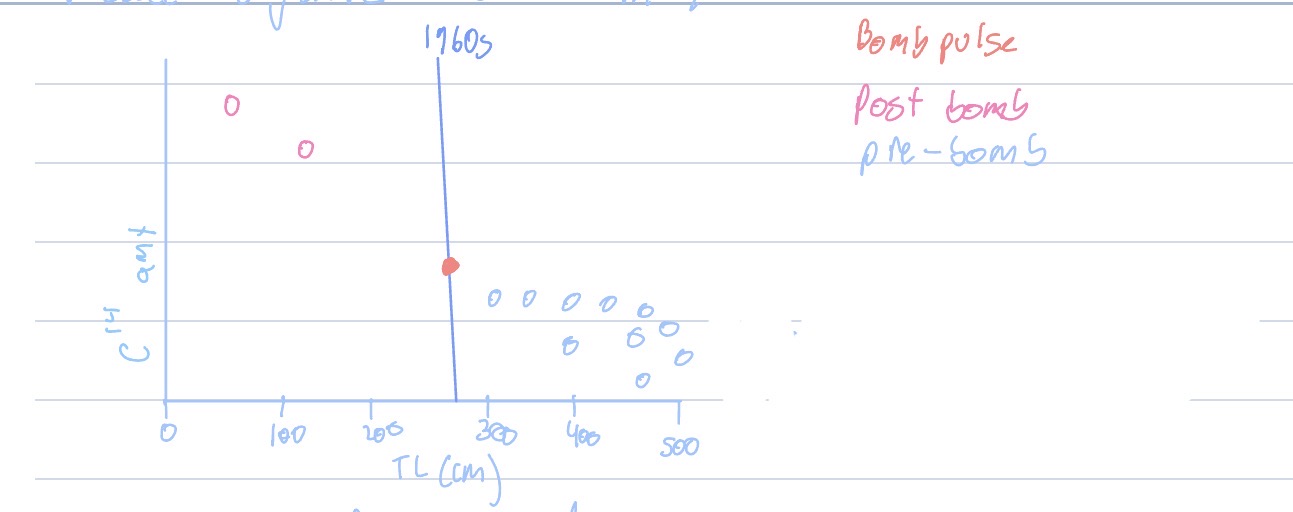
What does study and graph tell us about- from Greenland shark study
The large sharks have low concentrations because they were conceived before bomb pulse testing occurred in 1960s
Only the smallest sharks showed marker of 1960s bomb pulse
Life span at least 272yrs, largest could be 379 years, reach sexual maturity 156 years
Conservation implications- pop would not be able to rebound, generation time soooo long
longest lived vertebrate known