Lec 4: Bias, error, confidence intervals
1/36
There's no tags or description
Looks like no tags are added yet.
Name | Mastery | Learn | Test | Matching | Spaced |
|---|
No study sessions yet.
37 Terms
bias def
mistakes which can be avoided
may be intentional or unintentional
bias characteristics, is…
systematic
confounding
how is bias systematic
due to flawed methods
allocation/ selection bias
attrition bias – loses to follow-up
assessment bias
how is bias confounding
suggests an association where non-exists modifies the outcome
ex smoking and survival
what are the diff types of error, causes
random=impact of chance
systematic=calibration issues, data collection, poor design
error def
is unavoidable, sampling from a larger population
control by appropriate sample size
sampling method
Sources of Bias and Errors in Statistics
selection or other sampling bias
data collection
outliers (response bias)
violation of the assumptions of the test
hypothesis def
statement or assumption about a population parameter that can be tested data analysis
have an idea about your data/ research
propose a specific relationship between the variables
support or disprove this based on sample data
null hypothesis def
no diff between groups
alternate hypothesis def
diff between groups
non directional hypothesis def
direction of difference not stated (two-tailed test)
directional hypothesis def
direction of difference stated (one-tailed test)
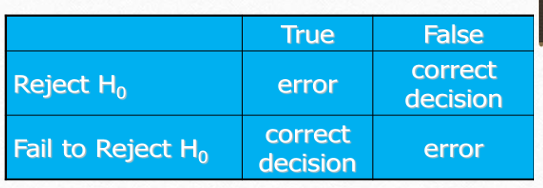
what does hypothesis testing require
recognition of error
type 1/2
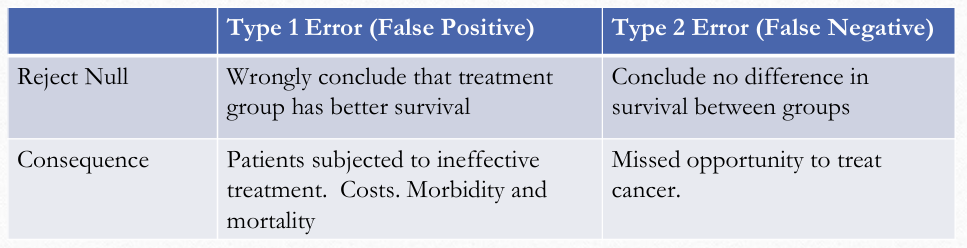
type 1 error simple def (false positive)
finding a diff when there is no diff
may be from chance
type 2 error simple def (false negative)
finding no diff when there actually is a diff
function of sample size – smaller = more chance type 2 error
A Simple Statistical Model def
mean is a hypothetical value
=the mean is simple statistical model
what helps/how to calculated the total error (dont have to know)
add the deviations to find out the total error=sum of squared errors (SS)
principle of minimizing SS = method of least squares, ie fit of least variance is best mode
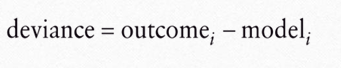
deviation def (aka mean error)
diff between the mean and an actual data point
can be calculated by taking each score and subtracting the mean from it
square the difference to cancel out negative values

why do we square each deviation
deviations cancel out because some are positive and others negative
SAMPLE AND HYPOTHESIS TESTING def
testing a guess or hypothesis about the sample
comparing one or more groups to a control (or comparison) group
what are some examples of SAMPLE AND HYPOTHESIS TESTING def
randomised controlled trial, case control study
control group=not given an intervention (not exposed)
experimental group=given an intervention (exposed)
how can we express a type 1 error
P<0.05 (p value)
5%
5 chances in 100
what is the risk/level of significance of type 1/alpha error usually set at
0.05
what is the beta level (type 2) usually set at
0.2
means willing to accept 20% chance (or 0.2) that there really is a diff, and we dont find that diff
why do type 2 errors occur
errors in experimental design
sampling errors
analysis errors

Consequence of Type I and Type II Errors pic
The measurement of the statistical significance defines whether…
the null hypothesis is assumed to be accepted or rejected
related to type 1 error
most common value=0.05 (but sometimes 0.01)
so 95% or 99% confident we have found the true result
if something is statistically significant, what do we do
reject the null hypothesis aka we have found a diff
if not significant then we failed to reject null hypothesis
what p value would be considered statistically significant, and therefore rejects the null hypothesis
p<0.05

alpha def
probability of type 1 error
defined as probability of rejecting the null hypothesis (Ho) when Ho is true


beta def
probability of type 2 error
defined as probability of failing to reject Ho when Ho is false
confidence interval def
range of values in which we are confident the true population
parameter lies
communicates how accurate our estimate (from the sample)
of a population parameter is likely to be
what is the most common confidence interval notes
95% confidence interval
Why Do CI Matter?
idea about how precise our estimate is
idea about the variation in the sample
idea about the sample size of the sample
gives a sense of the uncertainty around the point estimate
Information provided by CI
range of values
precision of estimate (narrow or wide)
for OR and RR if significant
comparing 2 means if difference is statistically significant
magnitude and direction, above 0=positive below 0=negative
when is the confidence interval not statistically significant
if the CI includes the null value=
zero for mean differences
1 for relative risk and odds ratios
if confidence intervals between 2 groups dont overlap, what does it indicate
statistically significant