Mathematics: Core Content
1/13
There's no tags or description
Looks like no tags are added yet.
Name | Mastery | Learn | Test | Matching | Spaced |
|---|
No study sessions yet.
14 Terms
Which of the following binomials is a factor of 3x²+6x-24?
x-3
x+4
3x-2
3x+8
x+4
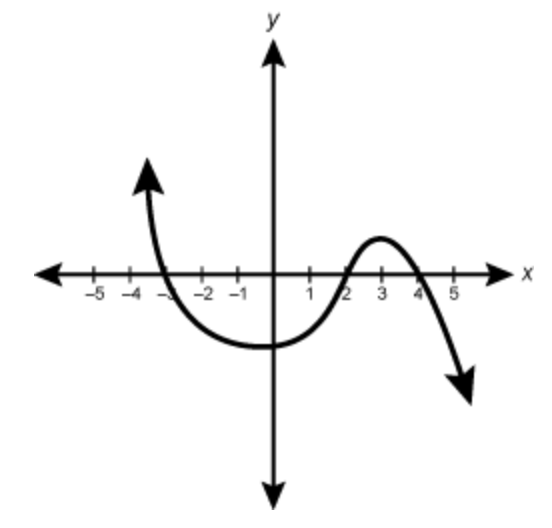
Which of the following equations could be represented by the graph shown?
y =(x+3)(x-2)(x-4)
y =(x-3)(x+2)(x+4)
y =-1(x+3)(x-2)(x-4)
y =-1(x-3)(x+2)(x+4)
y =-1(x+3)(x-2)(x-4)
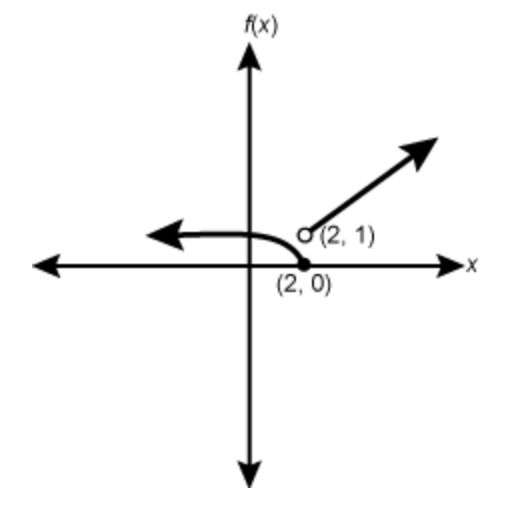
Use the graph of f(x) shown to determine lim f(x) x—>2?
0
1
2
Does not exist
Does not exist
Which of the following functions will have a graph that is discontinuous at x= -2?
f(x)= x/x+2
f(x)= square root of x+2
f(x)= 1- 2/x
f(x)= (x-2)²
f(x) = x/x+2
Which of the following equations represents the line tangent to y=1/4x³ at the point where x =2?
y= ¾ x
y= 3x
y= ¾ x + ½
y= 3x-4
y=3x-4
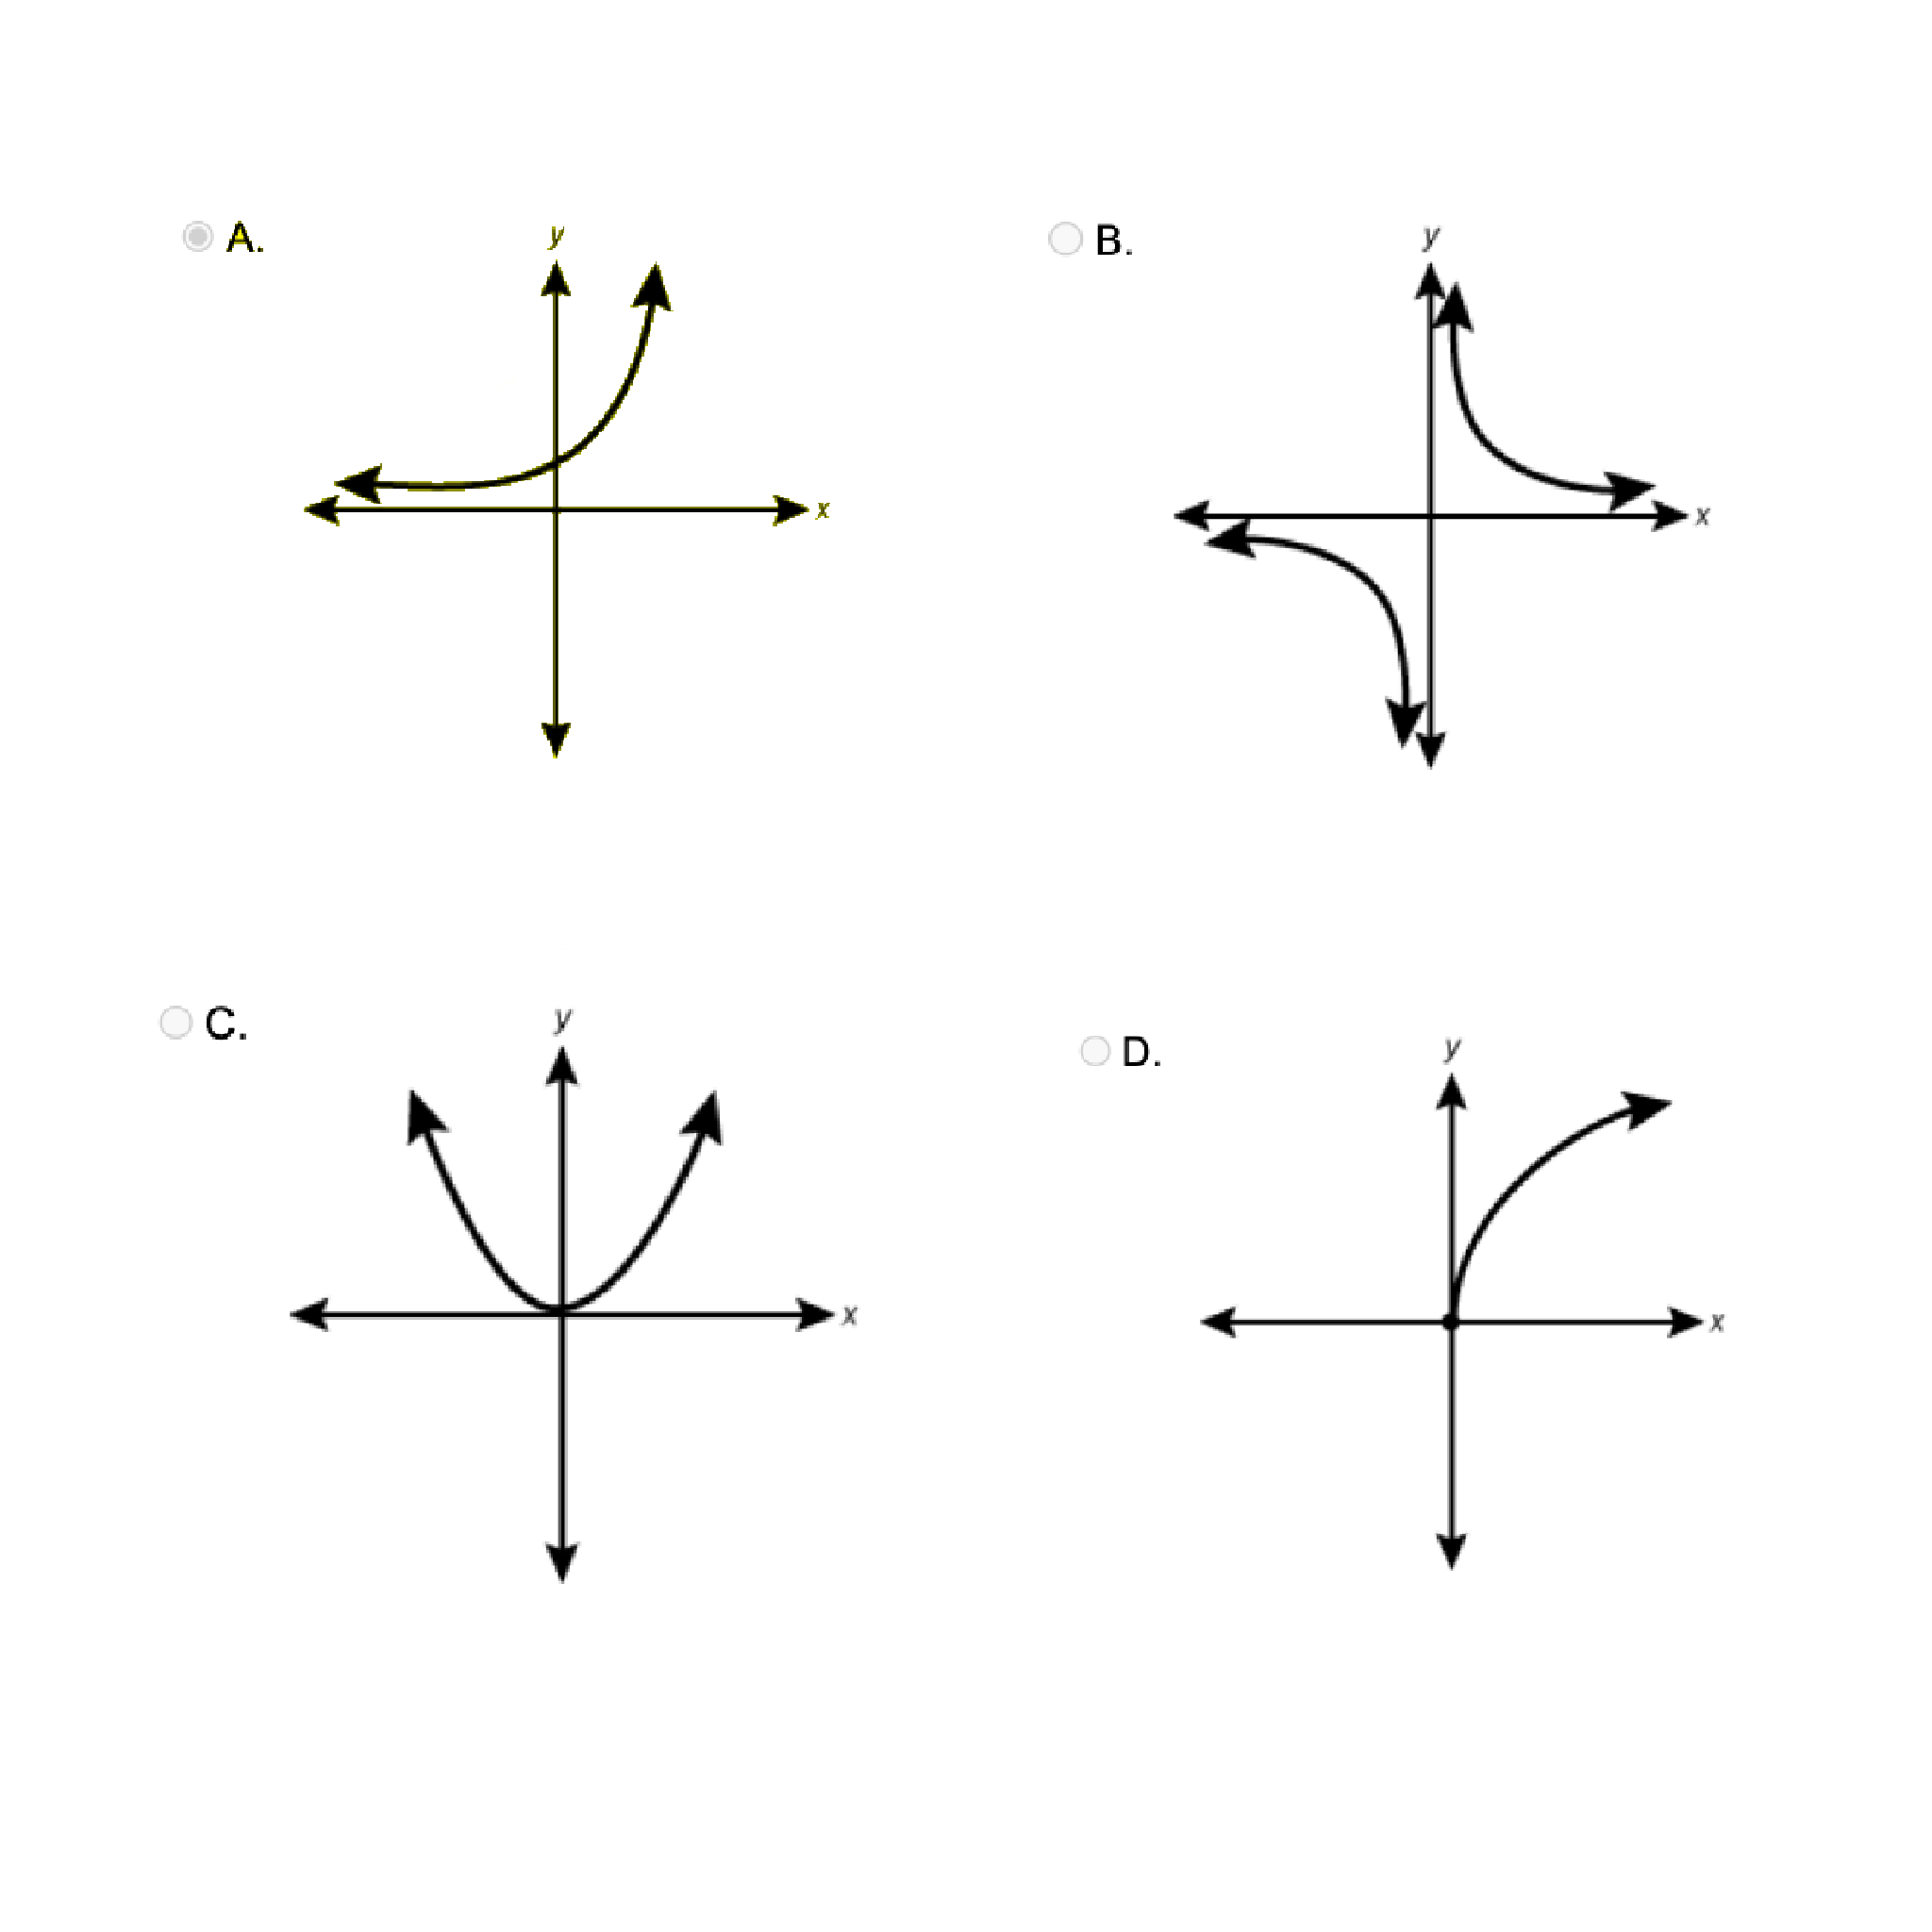
Which of the following equations could represent the graph of an exponential function?
Graph A
F(x) is an antiderivative of f(x). If f(x) = 5x^4 +6x², which of the following could be F(x)?
F(x)= 5x^5 + 6x³ + 1
F(x)= x^5 + 2x³ + 3
F(x)= 5x³ + 6x
F(x)= 20x³ + 12x
F(x)= x^5 + 2x³ + 3
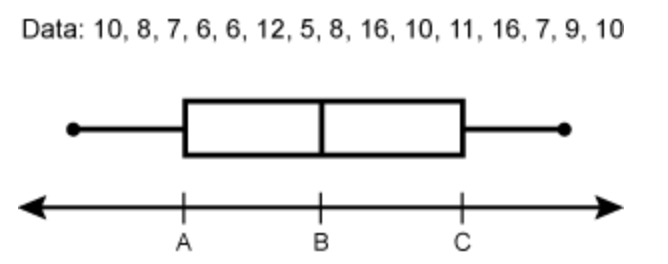
A box and whisker plot is drawn for the data shown. Which of the following set of values could represent A, B, and C?
A=6, B=8, C=11
A=7, B=9, C=11
A=6.7, B=9.4, C=12.1
A=6.5, B=10.5, C=13
A=7, B=9, C=11
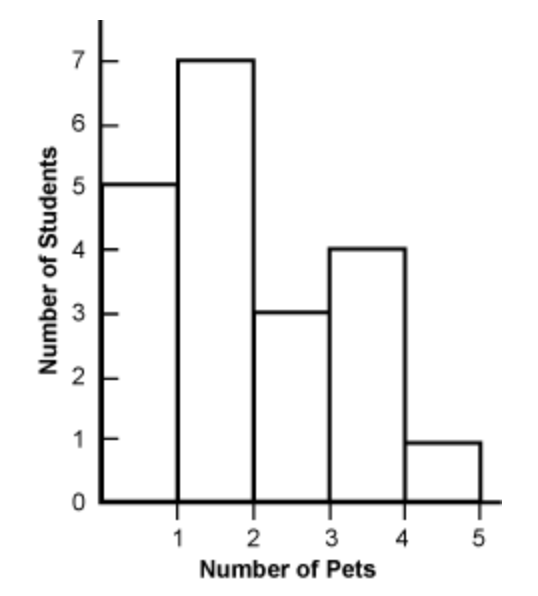
A class collected data by asking each student how many pets the owned and recored the results in the histogram shown. What is the relative frequency of owning 2 or more pets?
0.15
0.25
0.3
0.4
0.4
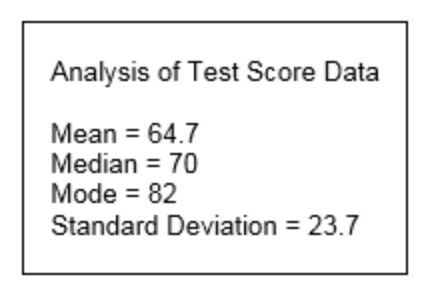
To analyze students’ performance on a unit test, a teacher computed the measures of center shown. Because there were some substantial outliers in the data set, the teacher decided to discard the highest and lowest test scores. Which of the following statements must be true regarding the revised data set?
The mean score will be 64.7
The median score will be 70
The mode will be 82
The standard deviation will be 23.7
The median score will be 70
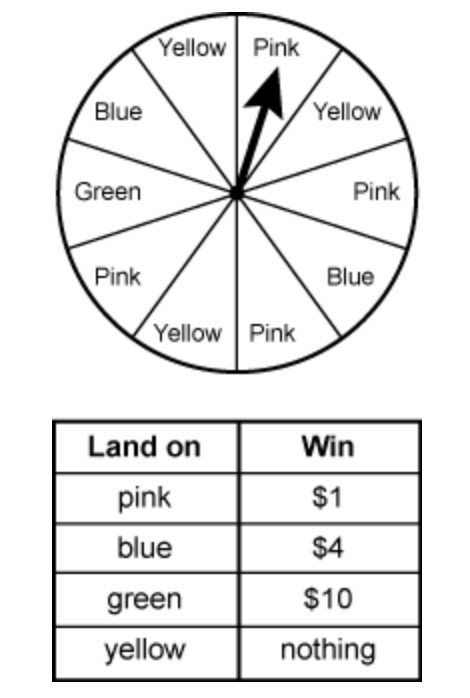
Students are planning a game of chance for their annual carnival. The game involves spinning the large spinner with payout as shown in the table. Which of the following quantities is the greatest amount a player could pay for a spin and still have an expected value of at least $1?
$0.75
$1.15
$1.25
$1.35
$1.15
A class collected data regarding students’ heights. Assuming the data is normally distributed with a mean a 52 inches and standard deviation of 3 inches, approximately what percent of the students have a height greater than 58 inches?
16%
5%
2.5%
0.15%
2.5%
A national polling agency surveyed 1,500 voters to estimate the outcome of an upcoming election. Of those surveyed, 53% said they would vote for candidate A. The agency created a 95% confidence interval with bonds (0.51, 0.56). The best interpretation of the confidence interval is that:
there is 95% confidence that between 51% and 56% of registered voters will vote for candidate A
in 95% of the samples of registered voters, between 51% and 56% will vote for candidate A
there is 95 confidence that between 51% and 56% of registered voters from the sample will vote for candidate A
95% of the time, between 51% and 56% of registered voters will vote for candidate A
there is 95% confidence that between 51% and 56% of registered voters will vote for candidate A
A researcher records the calorie and sugar content of a serving of cereal for 80 cereal brands. Based on the findings, the research reports that cereal contain about 3 calories per each additional gram of sugar and that sugar-free cereals average about 90 calories. Which of the following equations could be the linear regression model for this study?
calories = 3 + 90(sugar)
calories = 90 + 3(sugar)
suga r= 3 + 90(calories)
sugar=90 + 3(calories)
calories = 90 + 3(sugar)