E10: Wheat Germ Acid Phosphatase Assay
1/18
There's no tags or description
Looks like no tags are added yet.
Name | Mastery | Learn | Test | Matching | Spaced | Call with Kai |
|---|
No analytics yet
Send a link to your students to track their progress
19 Terms
Temperature , amount of enzyme ,and pH
What factors influence the activity of an enzyme and how (increase or decrease)?
as substrate concentration increases, the rate of reaction increases
Describe how the amount of substrate affects the rate of a reaction.
a. depletion of substrate
b. breakdown of enzyme
c. presence of inhibitors
Explain why reaction rates decline with time and use this information to correctly process the data (by choosing the proper data points to do linear regression)
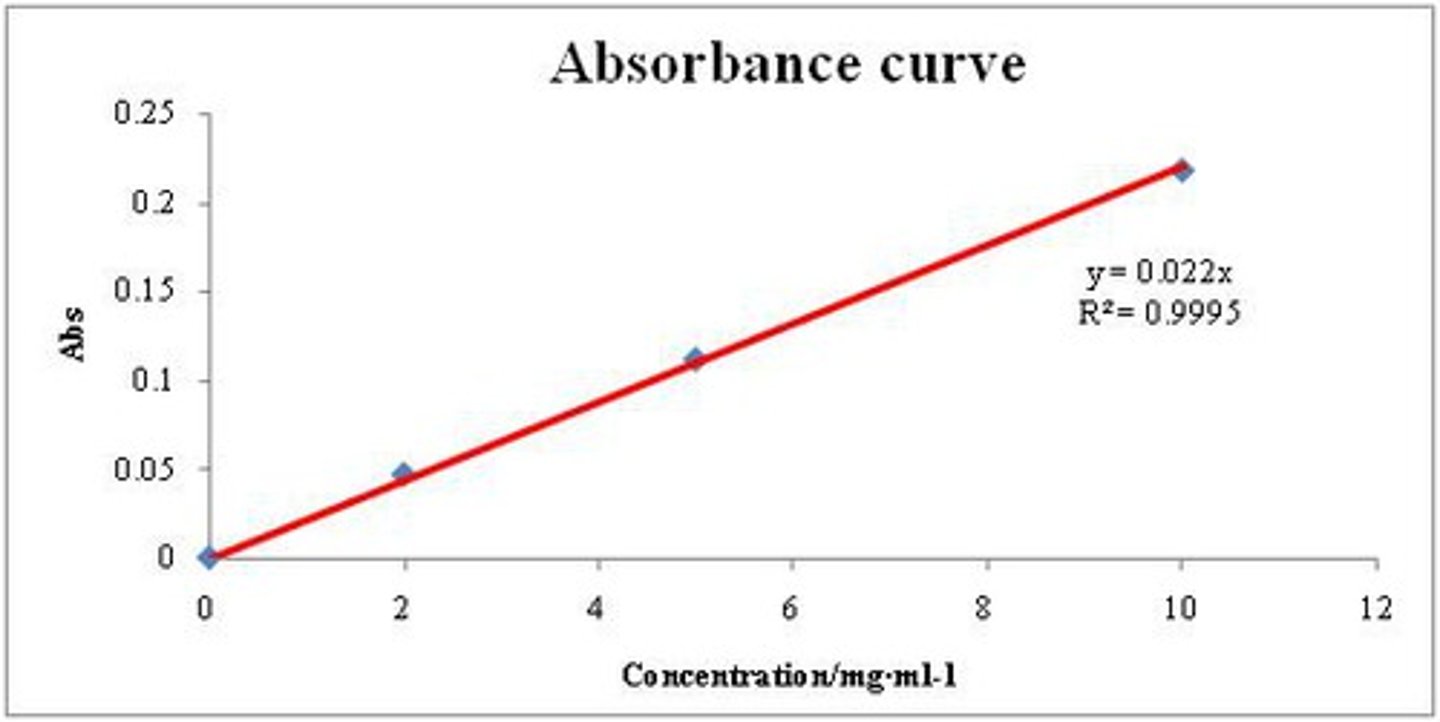
1. The standard curve of absorbance vs nmole/ml of nitrophenol
2. The amount of nitrophenol produced in the assay vs time
Understand how to construct and read the following two graphs (and be able to critique sample student graphs for errors.):
standard curve
A graph that plots known values which then allows the same properties to be determined for unknown samples by interpolation on the graph.
x = nitrophenol concentration (nmol/ml)y= OD410 absorbance
Describe how the nitrophenol standard curve is generated in this experiment. What parameters are used as X- axis and Y- axis?
4.5
What is the pH at which the acid phosphatase activity is measured?
adding KOH
How is the reaction catalyzed by acid phosphatase stopped?
Standard curve
substrate
nitrophenyl phosphate
Enzyme
acid phosphatase
phosphate and nitrophenyl
product
speed in which the substrate is converted to the enzyme and is proportional
the rate of the reaction in limited by the....
assay vs. time
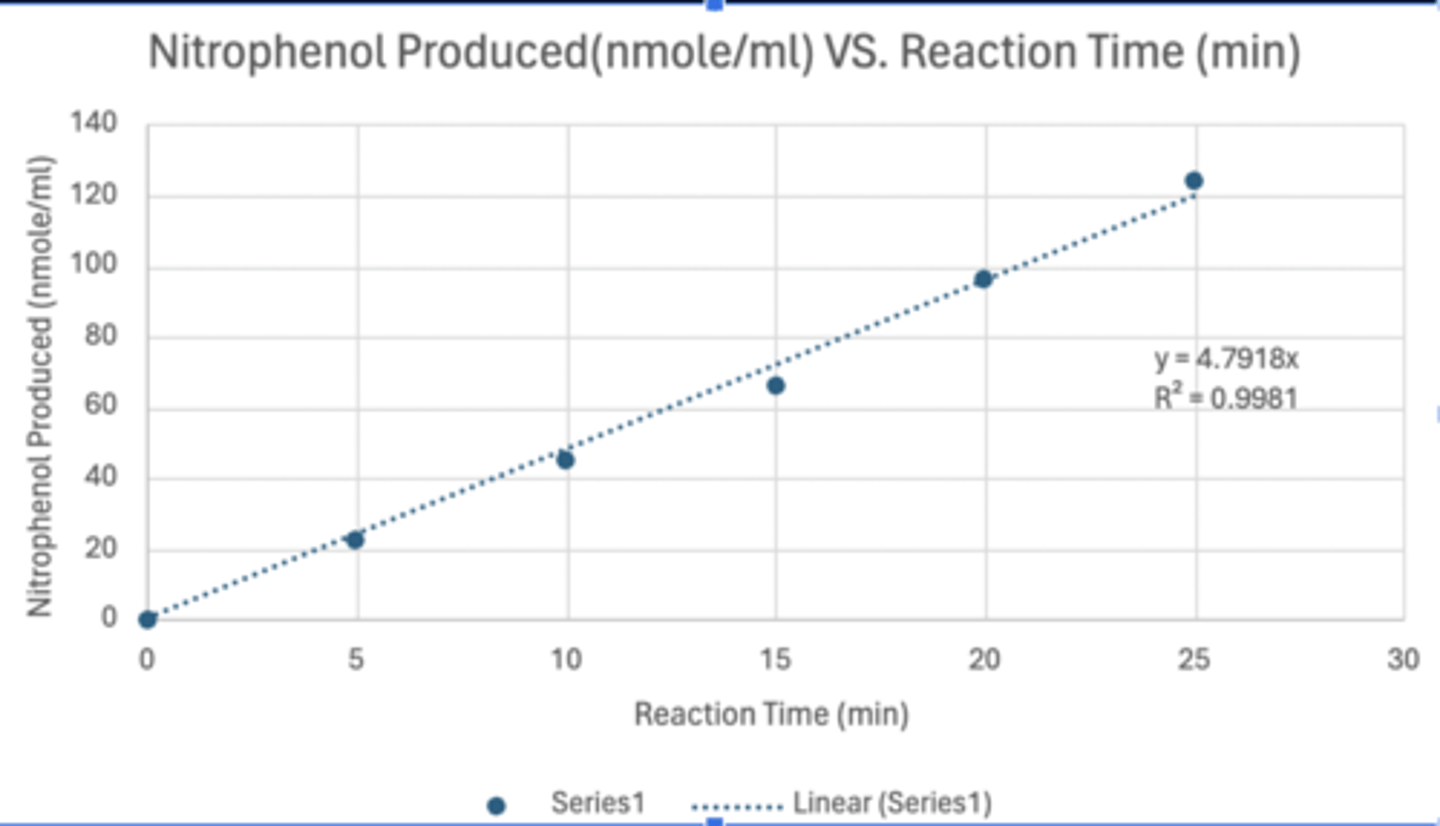
visualize how the concentration of a substance or the activity of a process changes as time progresses.
purpose of an assay vs. time graph
calculating the amount of product formed over time while the amount of product is increasing in a linear manner
The initial velocity of an enzyme catalyzed reaction is determined by
1. Presence of activators or inhibitors
2. Concentration of substrate
3. Temperature and pH
4. Amount of enzyme
Which of the following influence the rates of enzyme-catalyzed reactions?
nitrophenol concentration
In the standard curve for nitrophenol generated for use in this experiment, what is reported on the x-axis?
absorbance at 410 nm
In the standard curve for nitrophenol generated for use in this experiment, what is reported on the y-axis?