Required practical 12 - Effect of different variables on species distribution
1/5
There's no tags or description
Looks like no tags are added yet.
Name | Mastery | Learn | Test | Matching | Spaced | Call with Kai |
|---|
No analytics yet
Send a link to your students to track their progress
6 Terms
Outline the method:
Layout two tape measures at a right angle to each other. Then get a random number generator to get random two numbers (to avoid bias) that act as coordinate points about 25 sets
Go to these coordinates, place the quadrat (bottom left corner on the coordinates) and count the number of dandelions
Calculate the percentage cover.
Repeat the experiment with the other coordinates
Repeat the experiment with the non-herbicide lawn
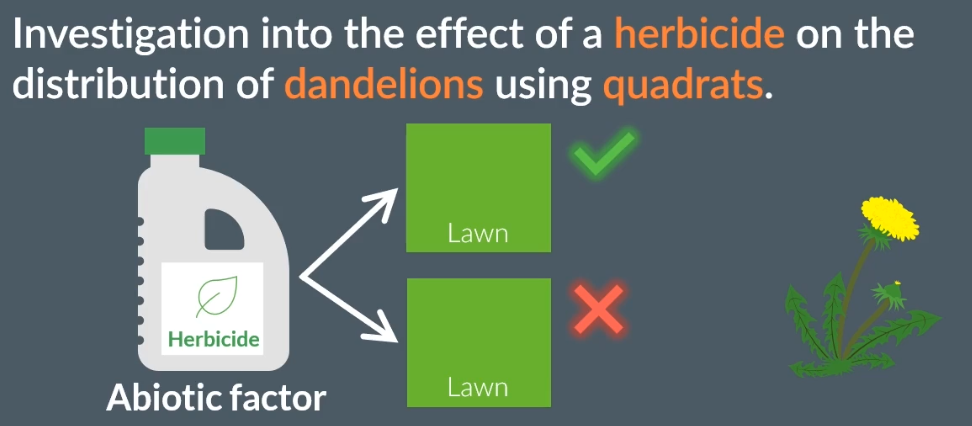
The idea behind this practical - for example, the effect of herbicide on the distribution of dandelions on a lawn:
Using a quadrat
Herbicides (abiotic factor - non-living factor) - effecting the growth of a plant
So, compare the distribution of dandelions to a lawn treated with herbicides to a lawn not treated with herbicides
Practical implications:
Difficult to count accurately, leading to inaccurate readings - where plants could be overlapping each other.
What are some abiotic and biotic factors?
Abiotic factors:
light intensity
Temperature
water concentration
Nutrient supply
Humidity
Wind speed
Biotic factors:
Predetors
Disease
Competition for resources
How to test if there is a relationship between the chosen factor and percentage cover?
Use a statistical test to test if there is a corrlation to be significant
State the assimptions for the mark-release-recapture method:
No births, deaths or immigration
Random mixing of marked individuals with population
Marking does not make the species vulnerable to predators