IB Business Finance Formulae
1/22
There's no tags or description
Looks like no tags are added yet.
Name | Mastery | Learn | Test | Matching | Spaced |
|---|
No study sessions yet.
23 Terms
Labour turnover
# of staff leaving over a year
————————————————— x 100
average # of staff employed in a year
Variable costs
average variable cost x quantity
total cost
fixed cost + variable cost
Sales revenue
price x quantity sold
average revenue
Total revenue
——————
Quantity
Contribution (total and per unit)
Definition → money left over after variable costs have been subtracted from revenue. the money contributes towards fixed costs and profit
Contribution per unit = selling price - average variable cost
Total contribution = total revenue - total variable costs
Break-even point
Fixed costs
—————————-
Contribution per unit
Break-even price (how much you need to charge to break-even)
Total cost
—————
Output
Target profit (how many units of output need to be produced to generate a certain level of profit)
Fixed costs + target profit
Q = ————————————
Contribution per unit
Margin of safety
Current level of output — break-even output
Profit-loss account
Sales revenue — COGS = Gross profit
|
Gross profit — Expenses = Net profit before interest & tax
|
Net profit before interest & tax — Interest = Net profit before tax
|
Net profit before tax — Tax = Net profit after interest & tax
|
Net profit after interest & tax — Dividends = Retained profit
Balance sheet
Non-Current Assets:
- property/equipment
- accumulated depreciation (-)
Current Assets:
- cash
- debtors
- stock
Total Assets = Current Assets + Non-Current Assets
Current Liabilities:
- bank overdraft
- trade creditors
- short-term loans
Non-Current Liabilities:
- long-term loans
Total Liabilities = Current Liabilities + Non-Current Liabilities
Net Assets = Total Assets — Total Liabilities
Equity:
- share capital
- retained profit
Net Assets = Equity
Depreciation (straight line method)
original cost — residual value
—————————————
expected life (years)
Cash flow forecasts
Opening balance (previous month’s closing balance)
Cash Inflows:
- cash sales revenue
- other income
Total inflows =
Cash Outflows:
- stock
- labour costs
- other costs
Total outflows =
Net Cash Flow = Total inflows — Total outflows
Closing Balance = opening balance + net cash flow
Payback period
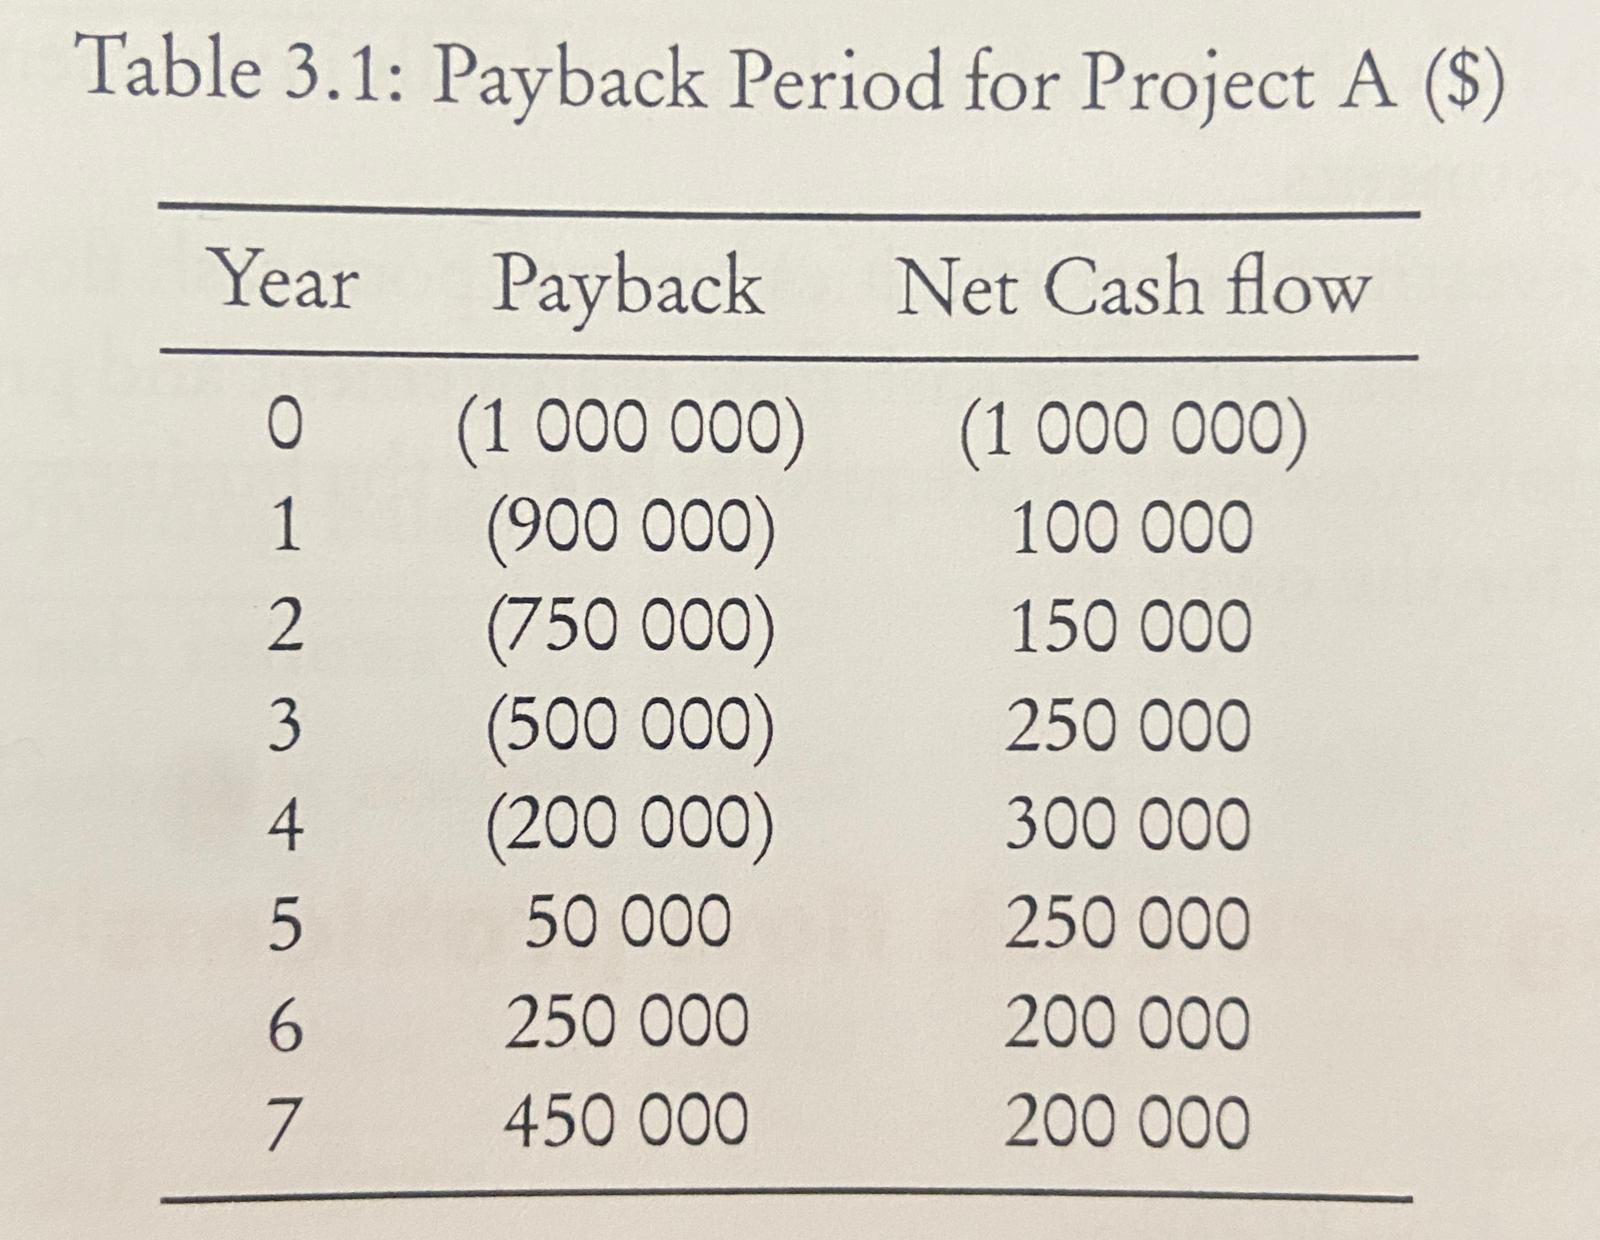
Payback in last negative year
——————————————— x 12 = months
Net cash flow in first positive year
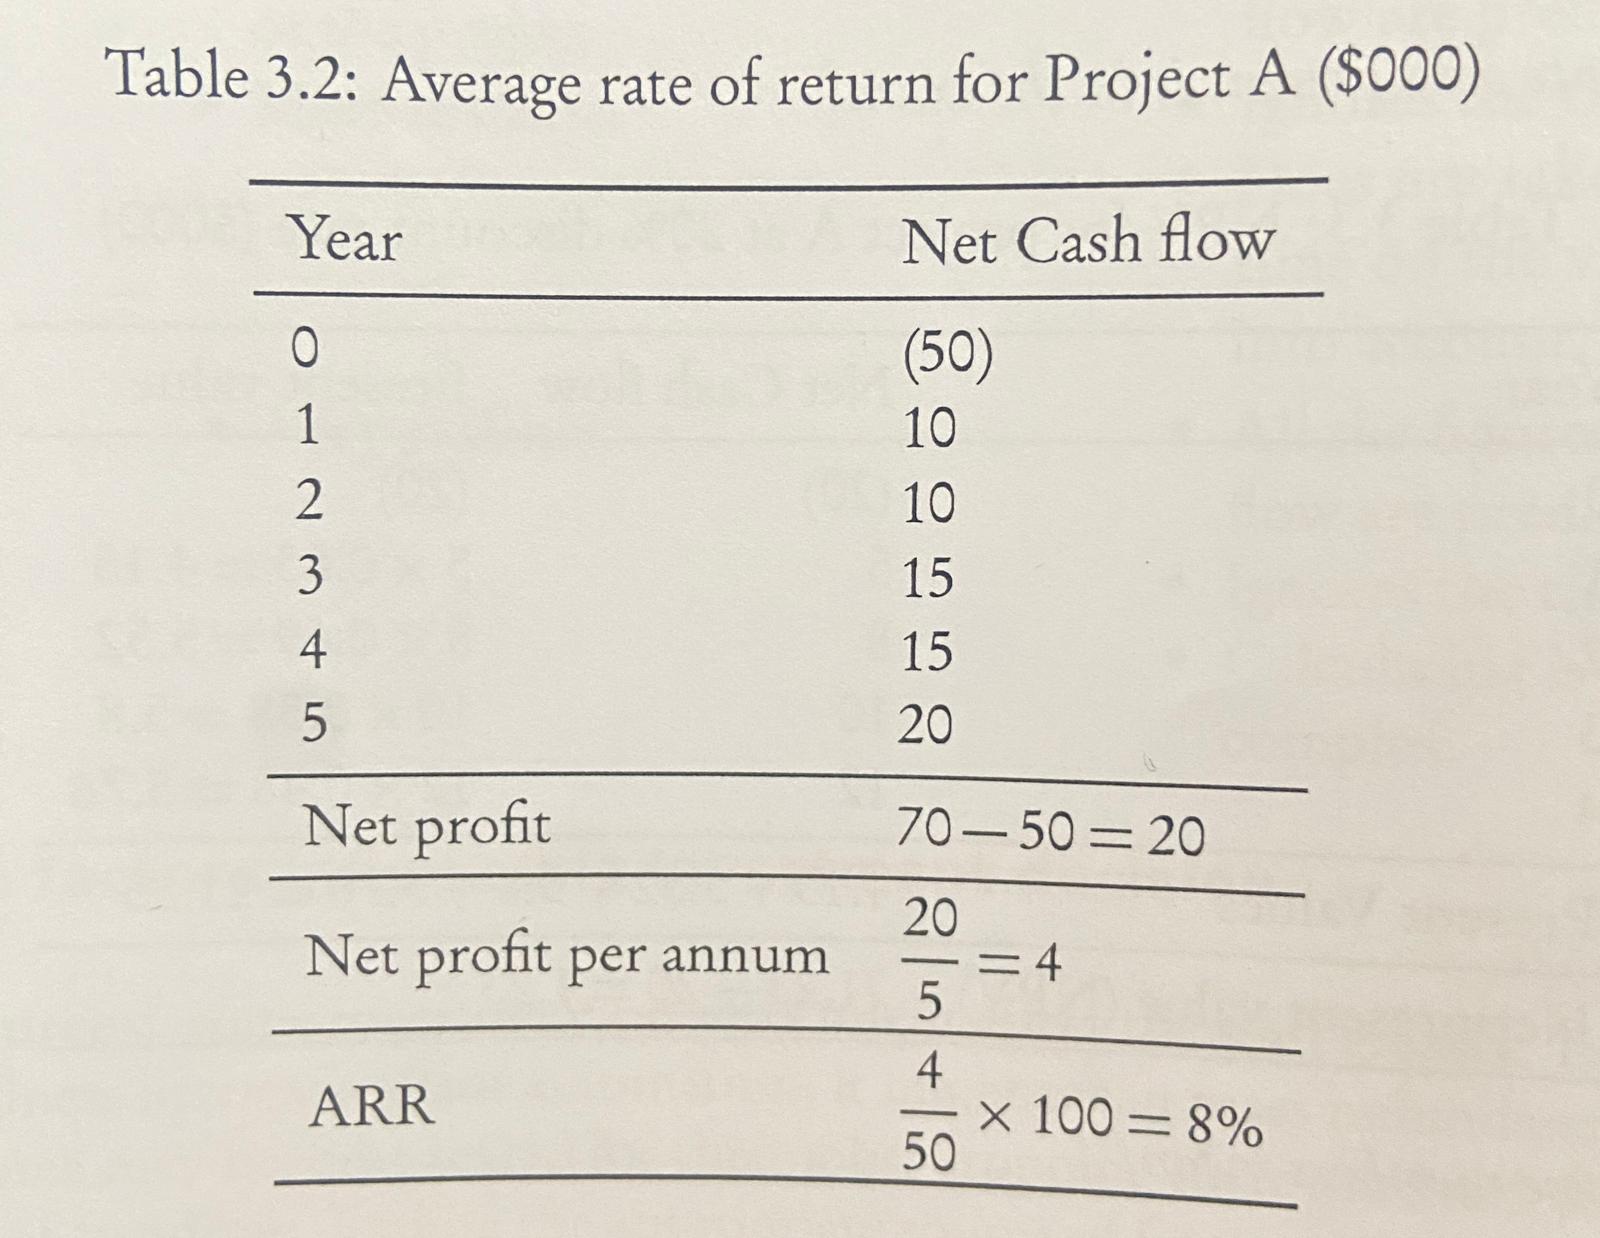
Average rate of return
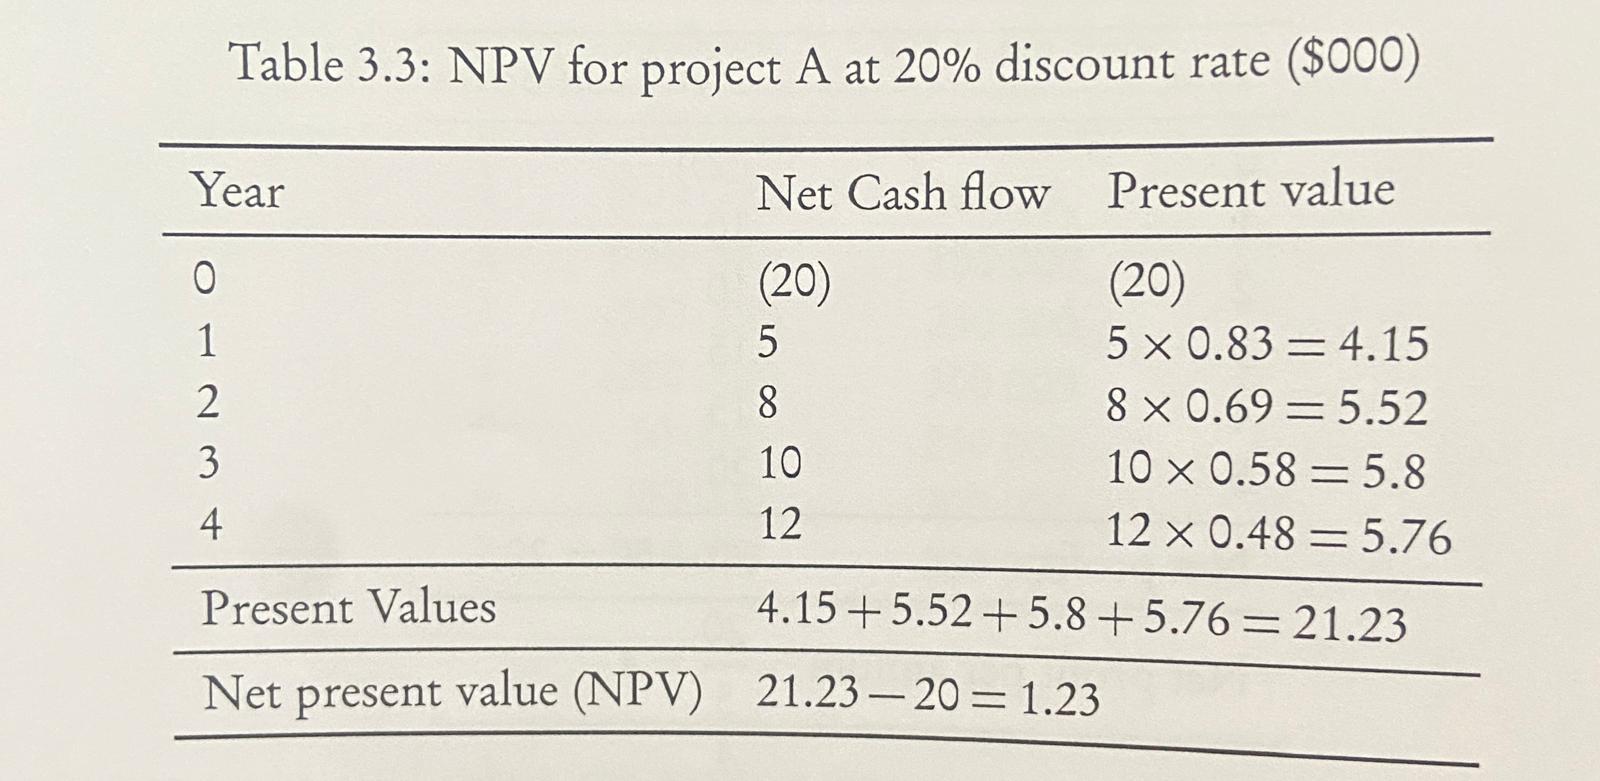
Net Present Value (discount)
Variance
actual outcome — budgeted outcome
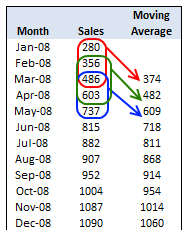
Time series analysis
attempts to predict sales levels by identifying the underlying trend from a sequence of actual sales figures recorded at regular intervals
3 point moving average = sales month 1, 2, 3
3
Variation = sales — 3-point moving average
Decision Tree: Expected value
Expected Value = ((FR x PS) + (FR x PF)) - cost
where,
FR = forecasted revenue
PS = probability of success
PF = probability of failure
cost = cost of the option
Labour productivity rate
total output
———————— x 100
number of workers
Cost to buy
price x quantity
cost to make
fixed costs + (average variable cost x quantity)