Graphs for all MC Pools for Econ 1010
1/64
There's no tags or description
Looks like no tags are added yet.
Name | Mastery | Learn | Test | Matching | Spaced | Call with Kai |
|---|
No analytics yet
Send a link to your students to track their progress
65 Terms
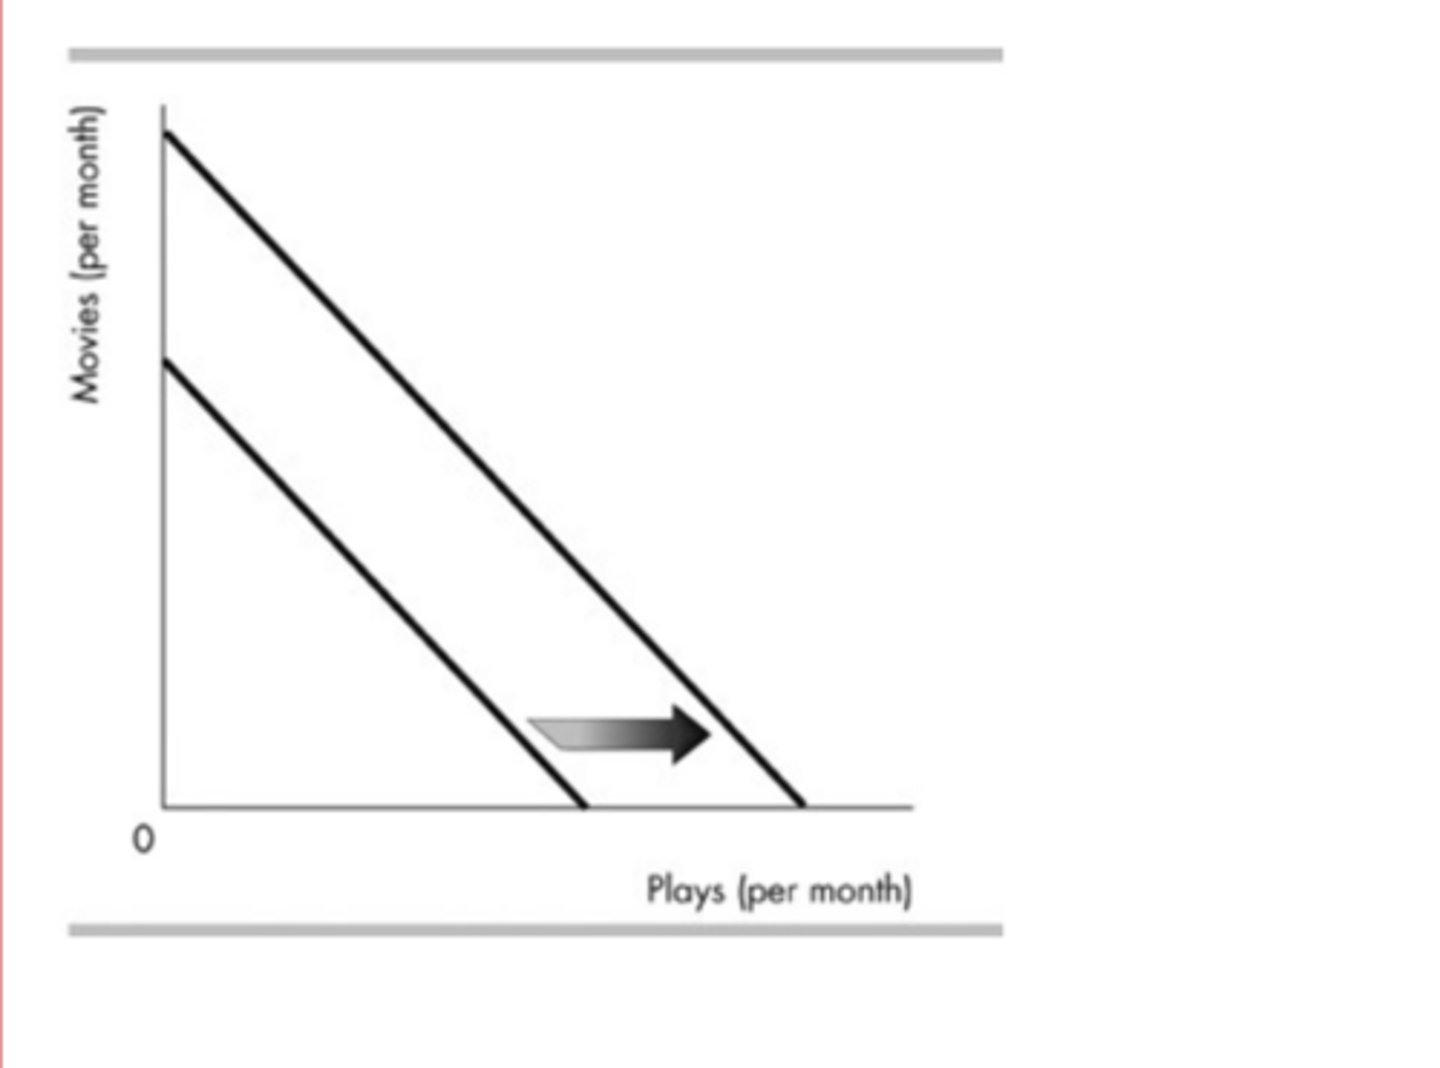
In the above figure, Sheryl's monthly budget line for movies and plays shifted, as shown. The shift in the budget line is parallel, so the shift might be because
Sheryl's income increased and nothing else changed.
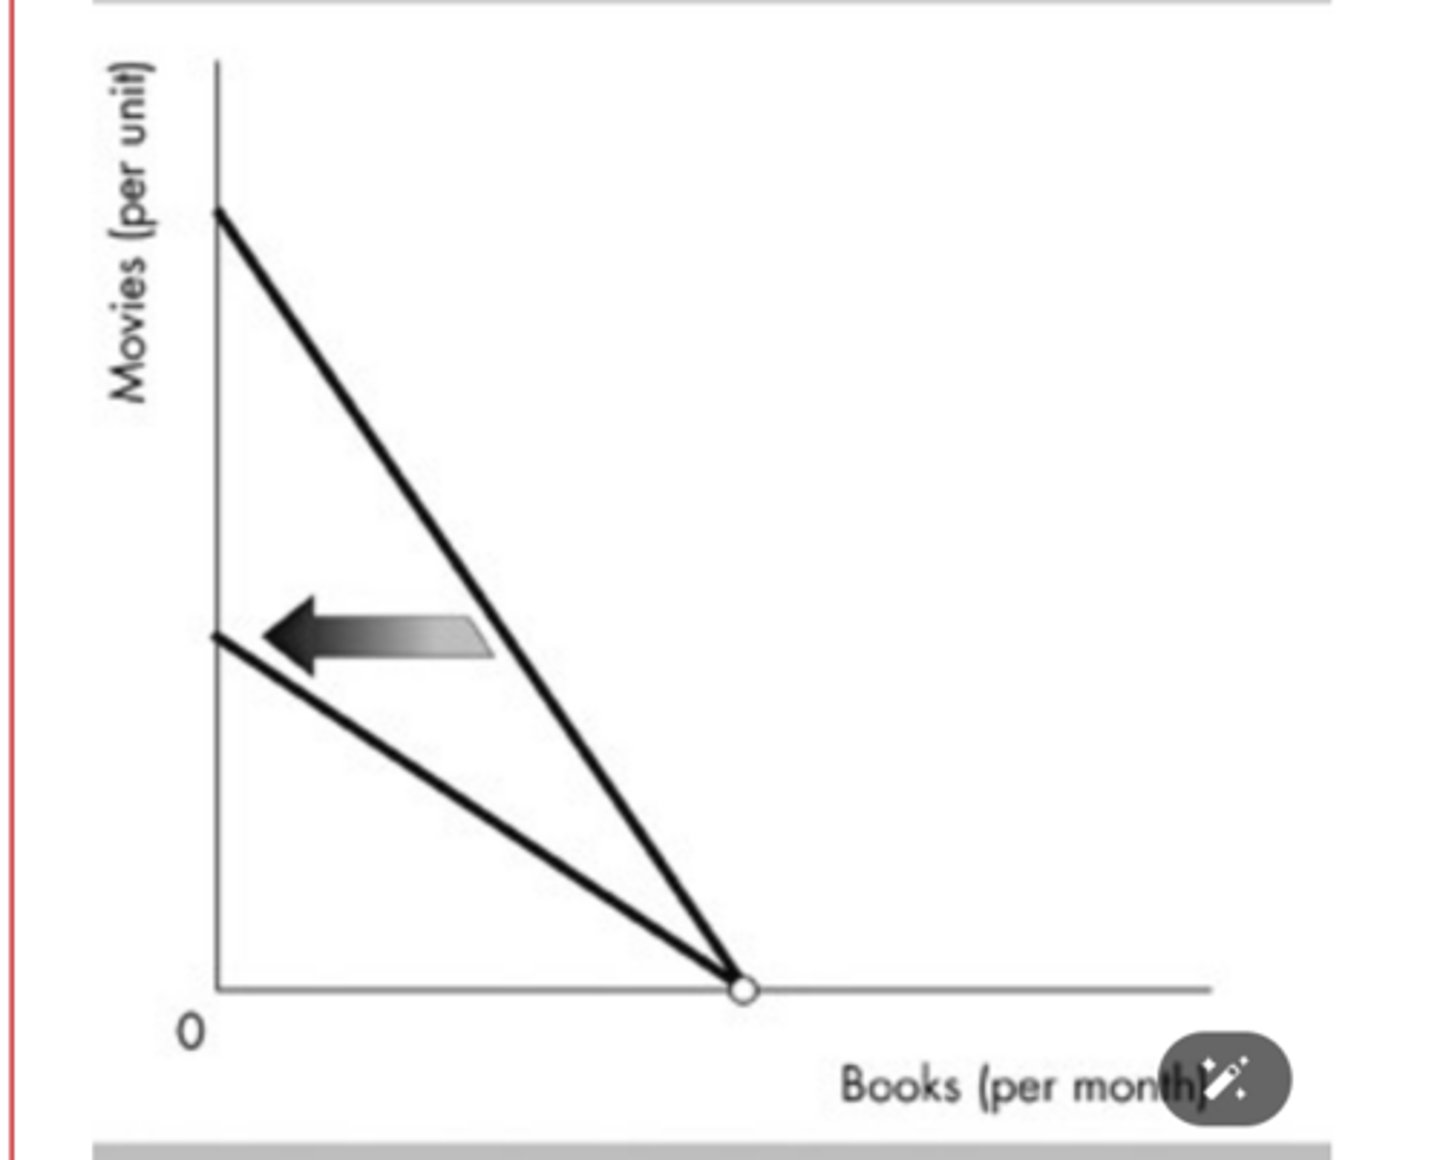
In the above figure, the budget line would rotate in the direction indicated as a result of a
rise in the price of a movie.
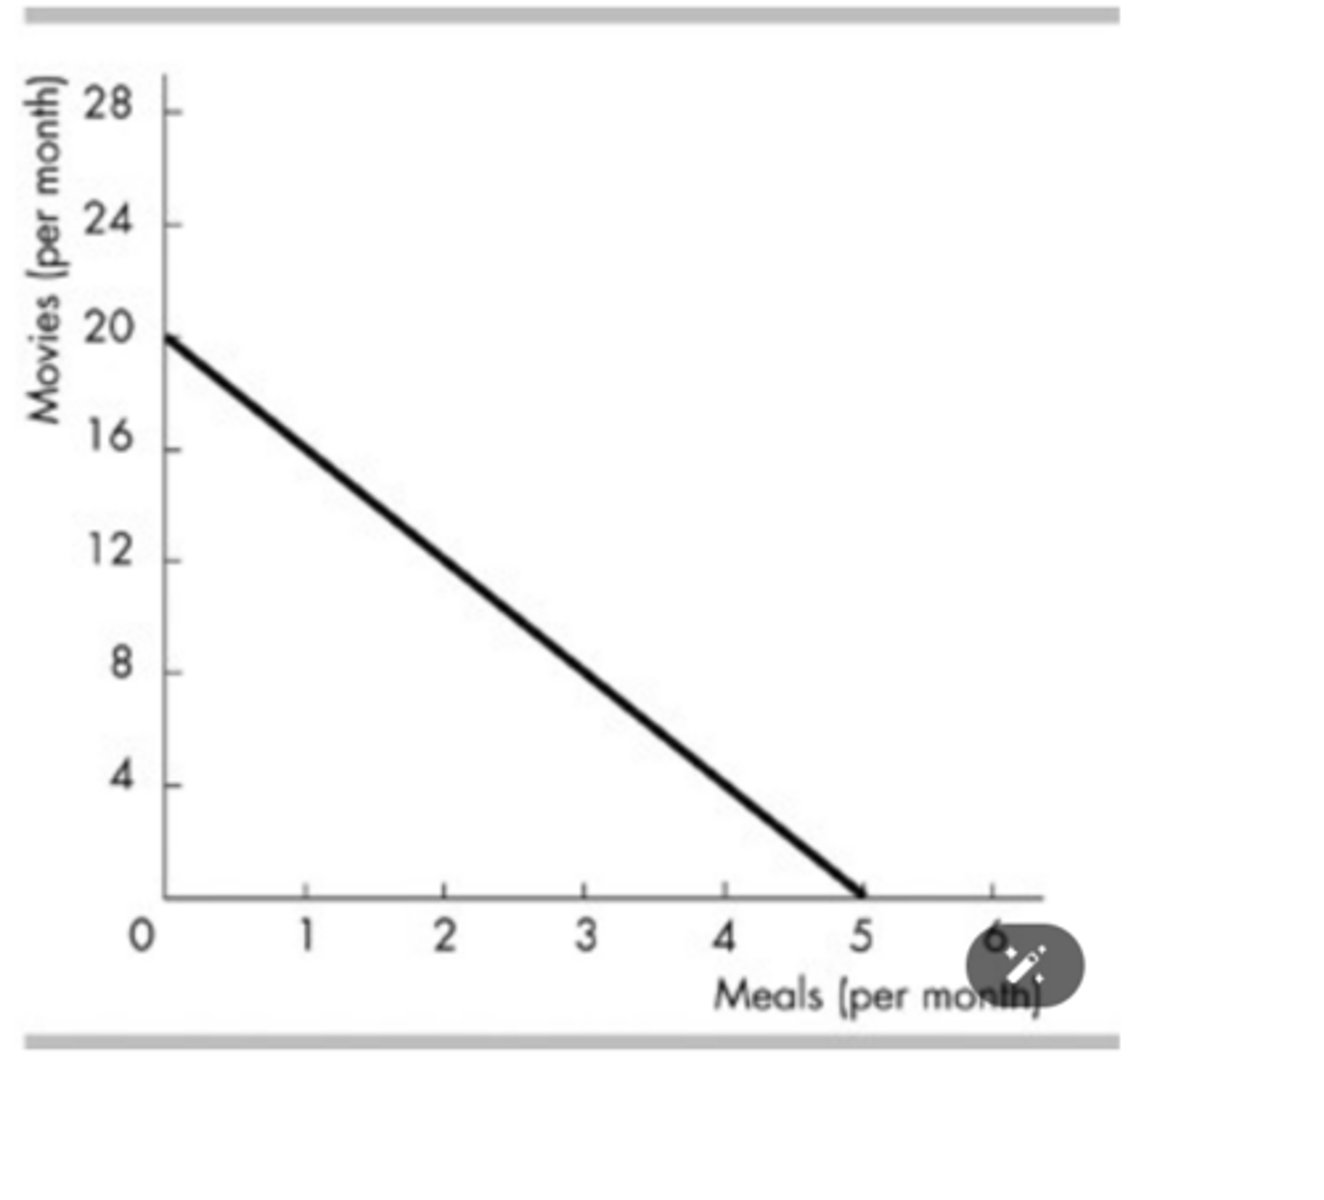
Given the budget line in the above figure, what is the household's real income in terms of pizzas per month?
5 pizzas per month
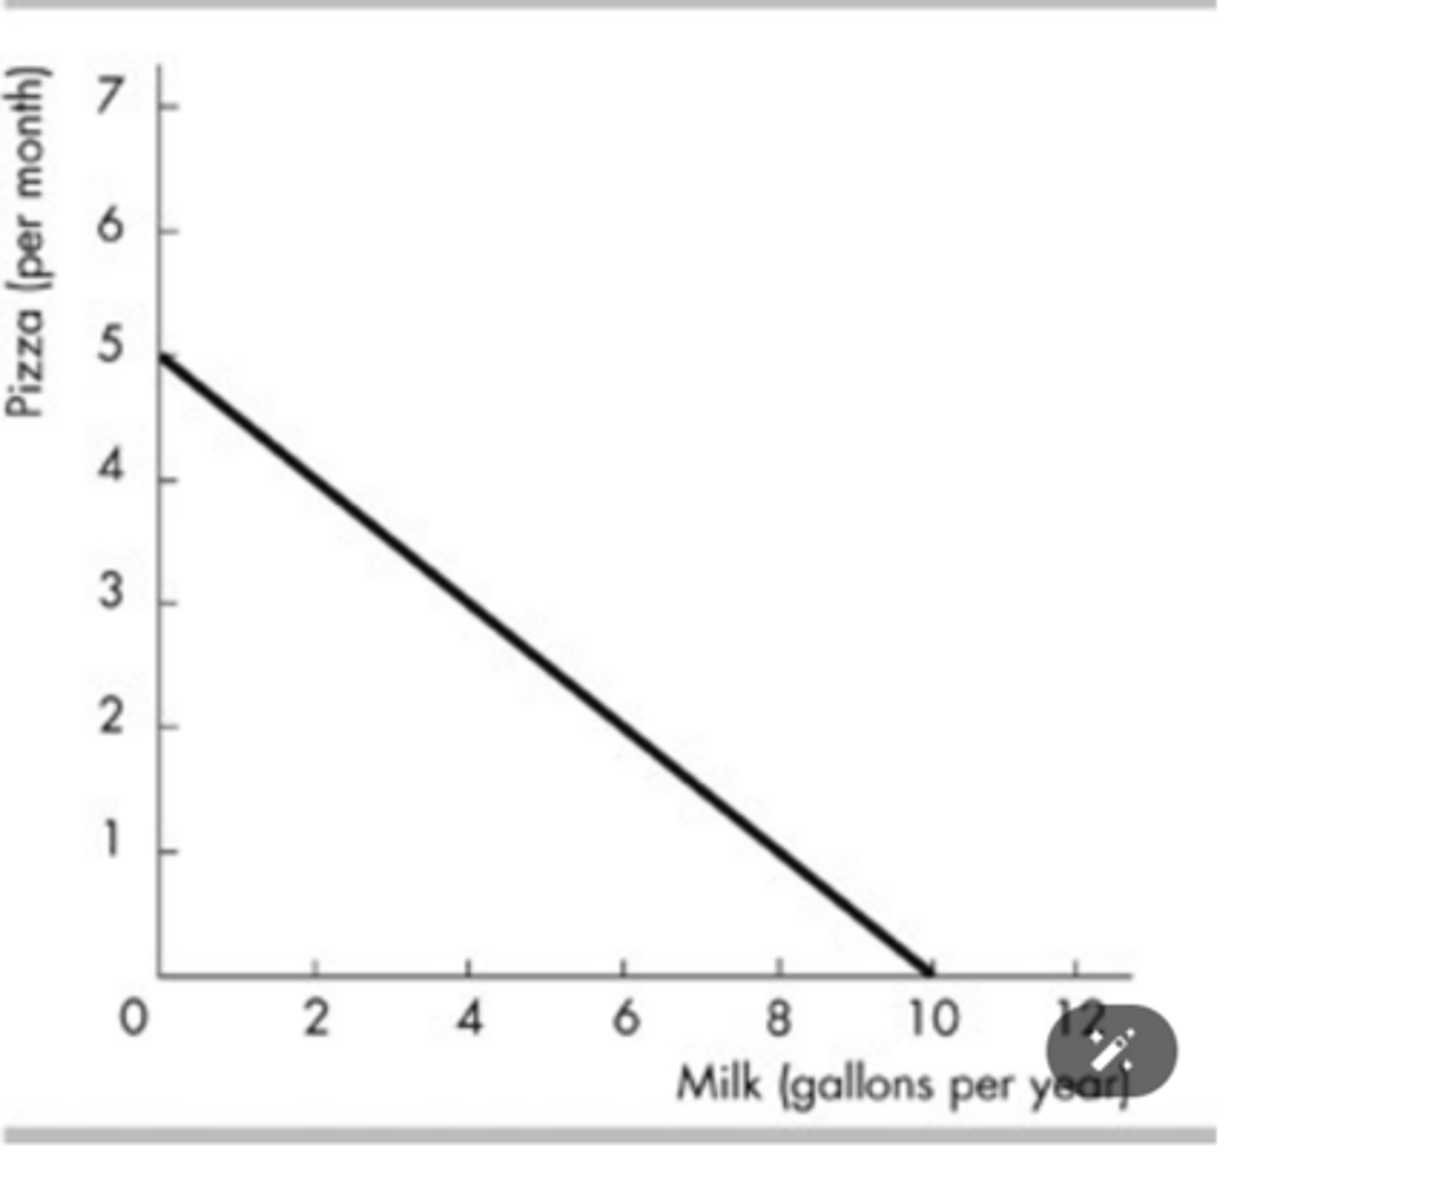
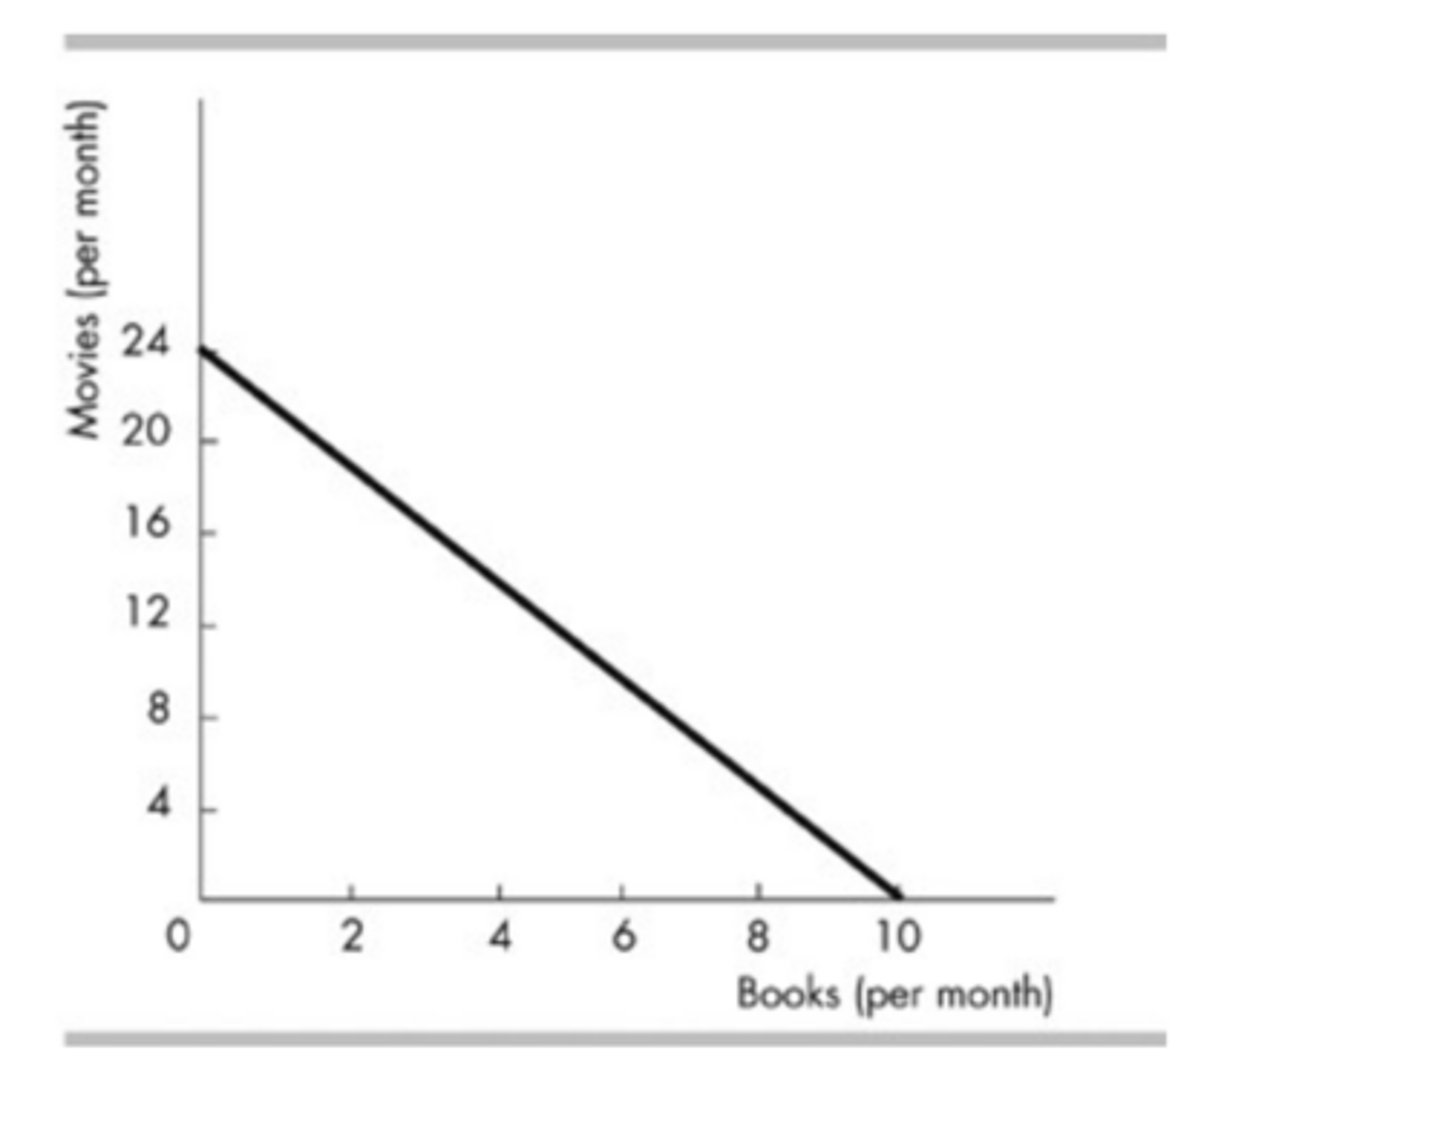
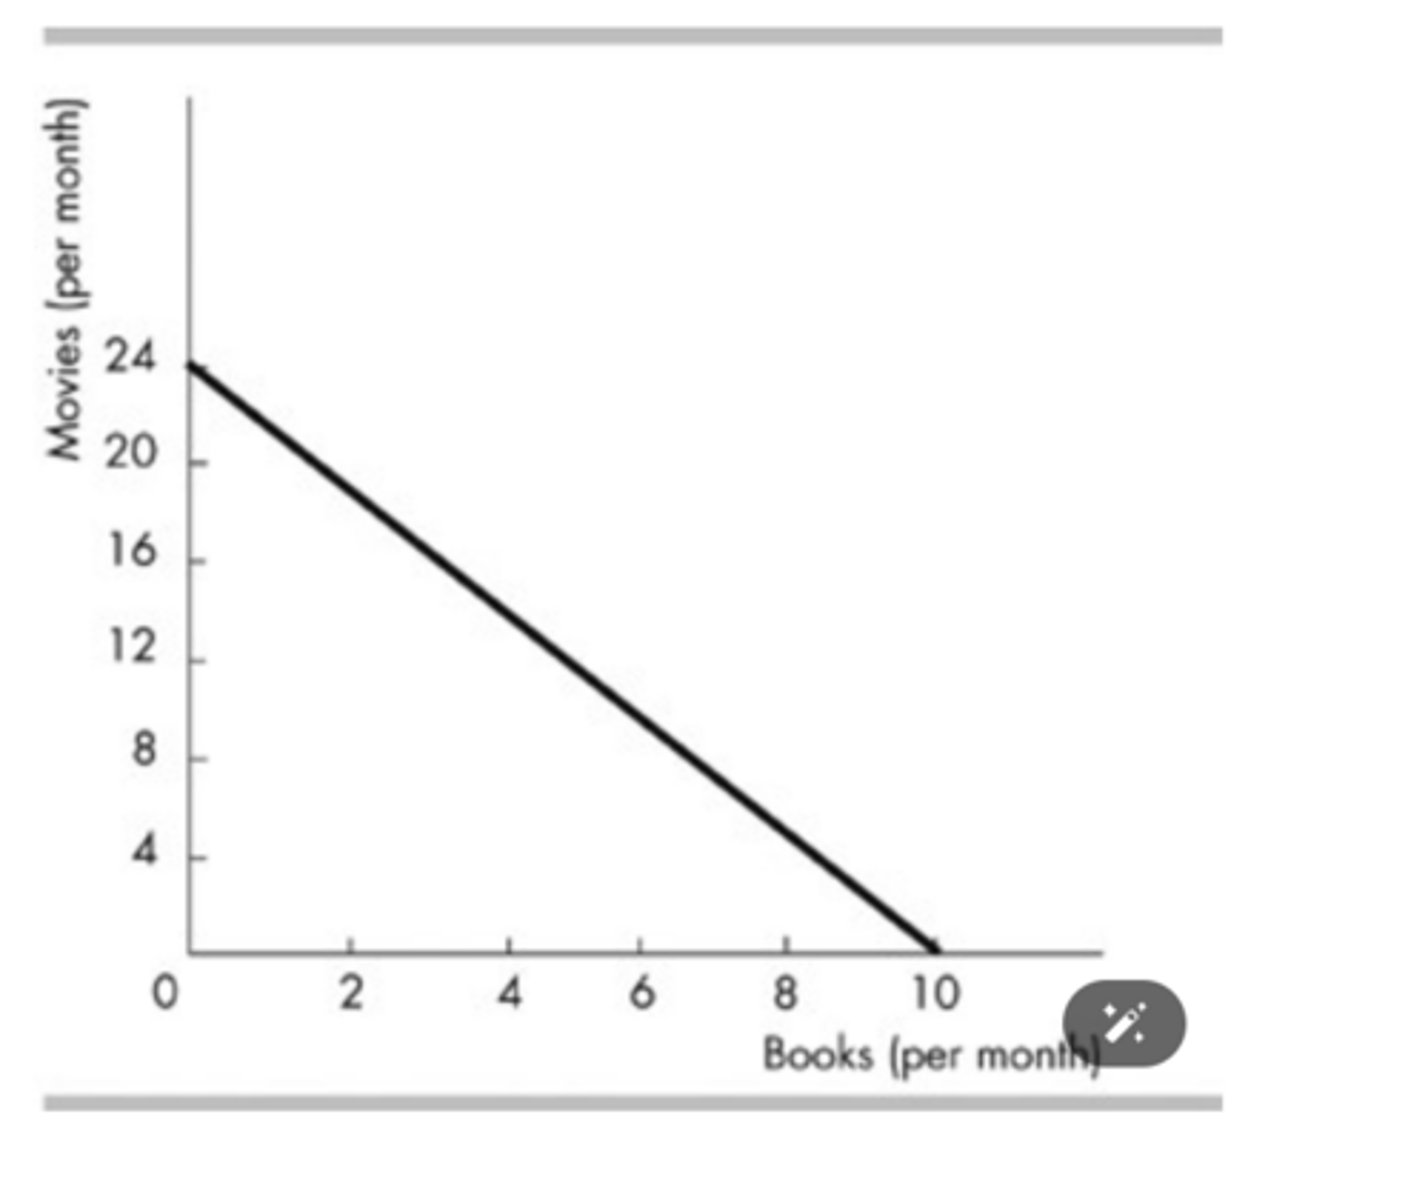
Consider the budget line in the above figure. If the consumer's income is $120, then the price of a book is
$12 per book.
The figure above shows Tanya's consumption possibilities. Which of the following combinations of goods is NOT affordable?
10 movie tickets and 3 restaurant meals.
Consider the budget line in the above figure. If the consumer's income is $240, then the price of a book is
$24 per book.
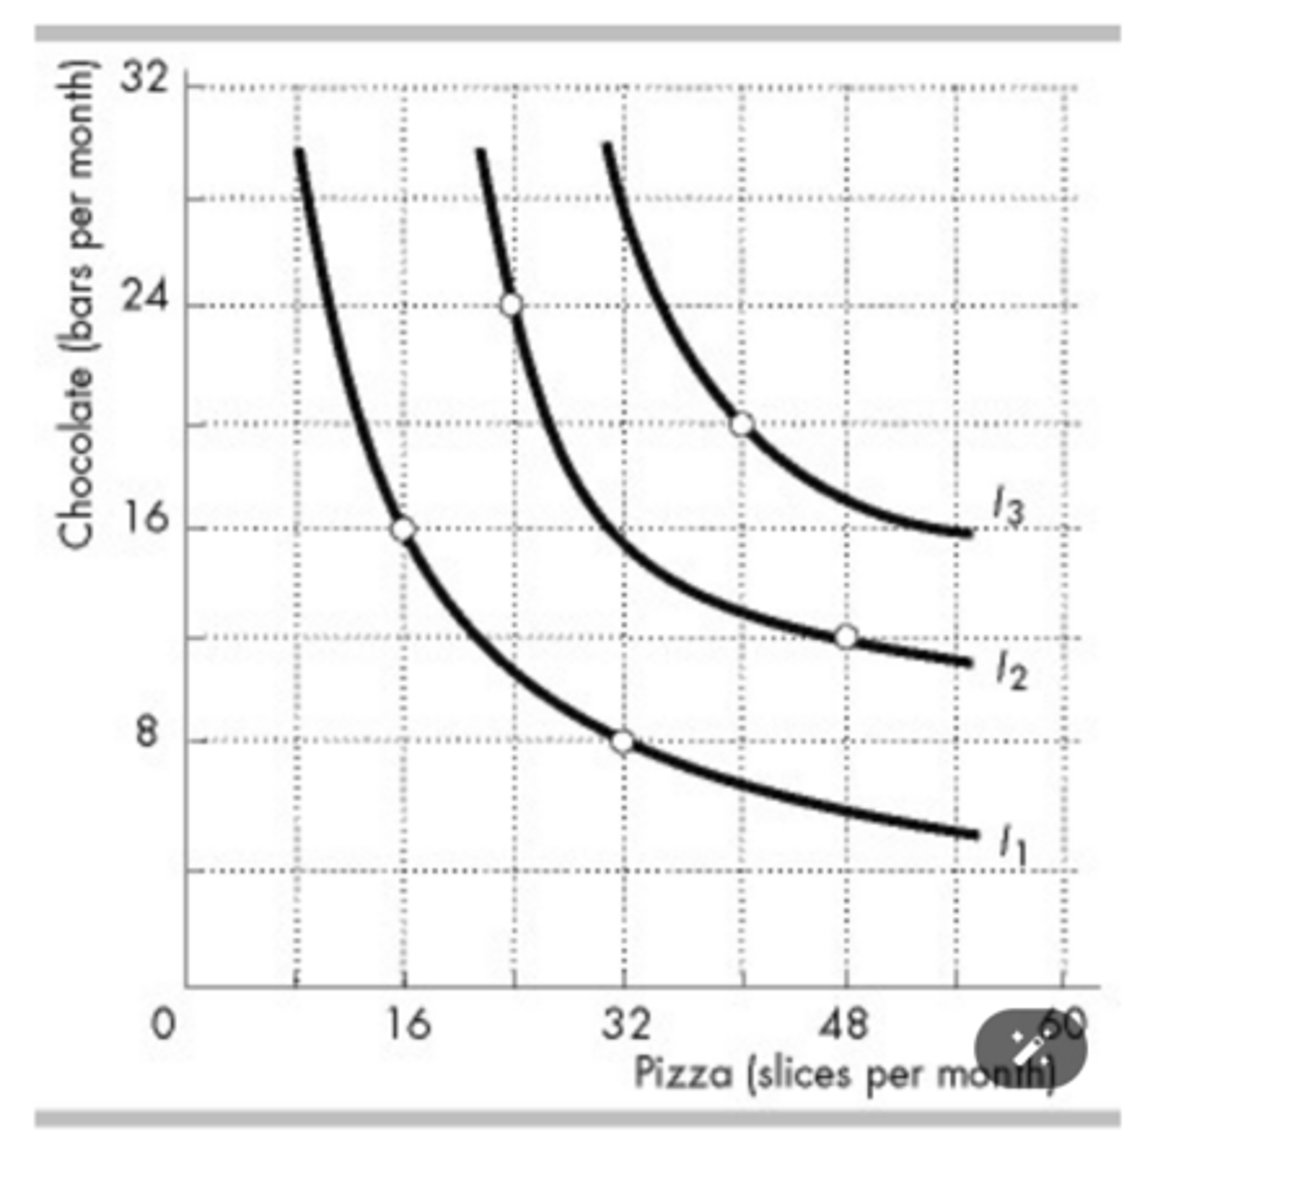
The indifference curves in the figure above (I1, I2, and I3) reflect Peter's consumption preferences. Peter prefers consuming ________ to consuming ________.
40 slices of pizza and 20 chocolate bars; 48 slices of pizza and 12 chocolate bars
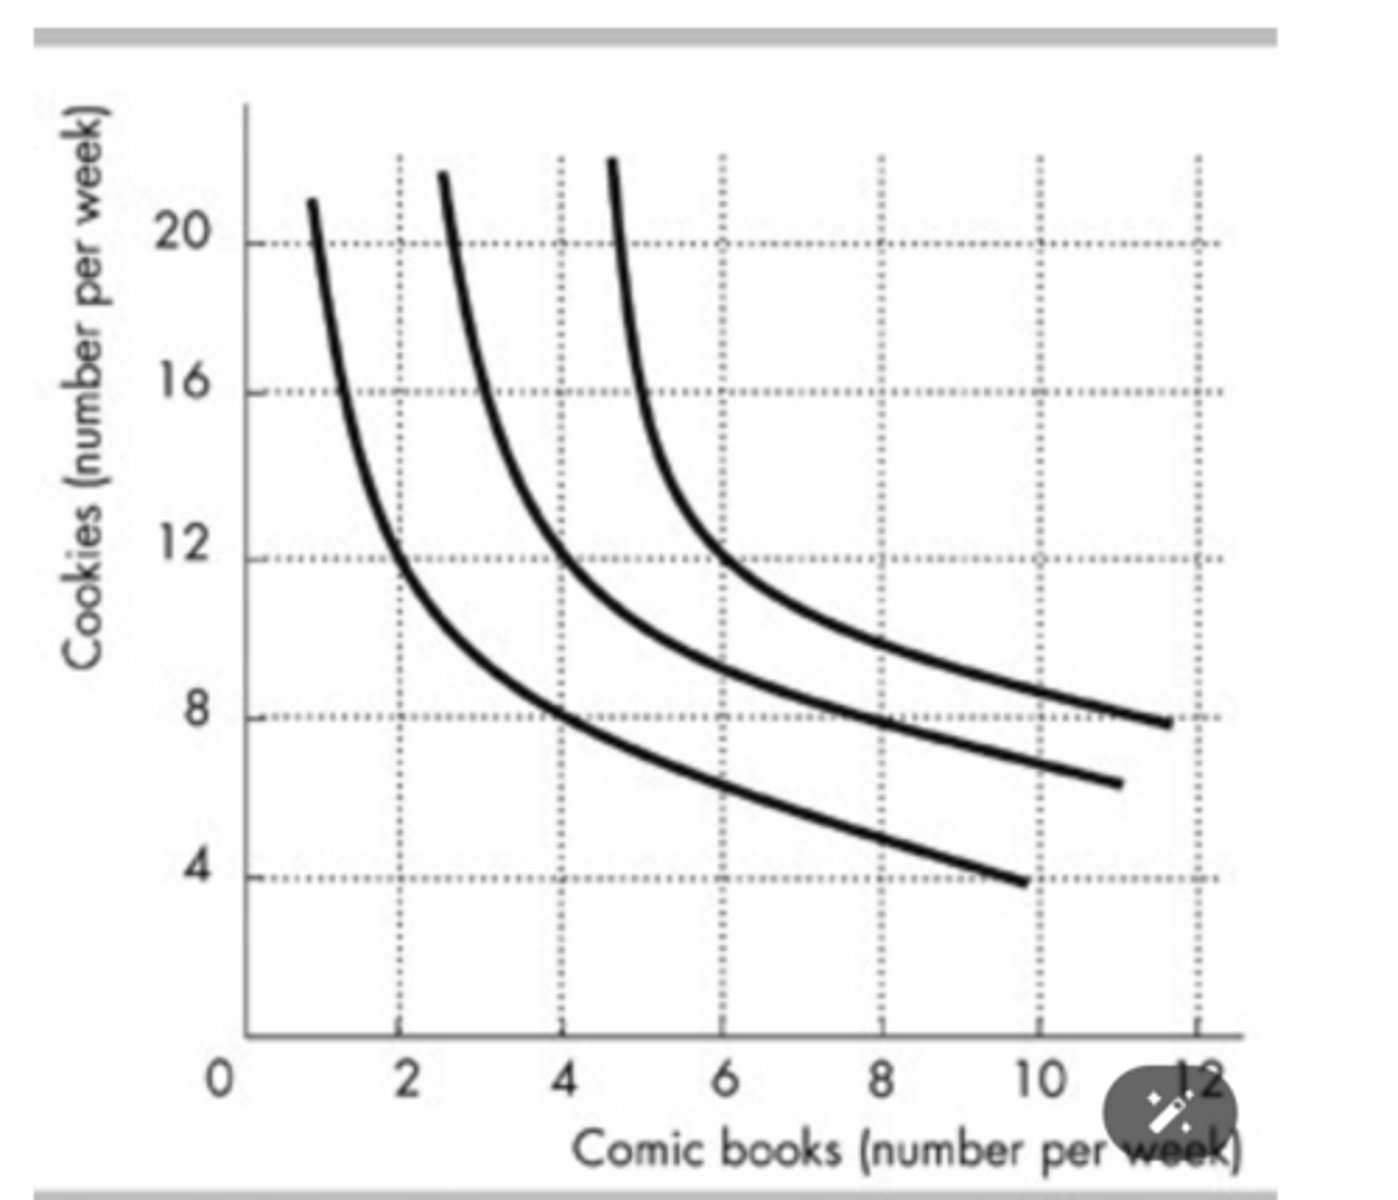
Lizzie's preferences are shown in the figure above. Lizzie definitely prefers consuming ________ to consuming ________.
4 comic books and 12 cookies; 2 comic books and 12 cookies
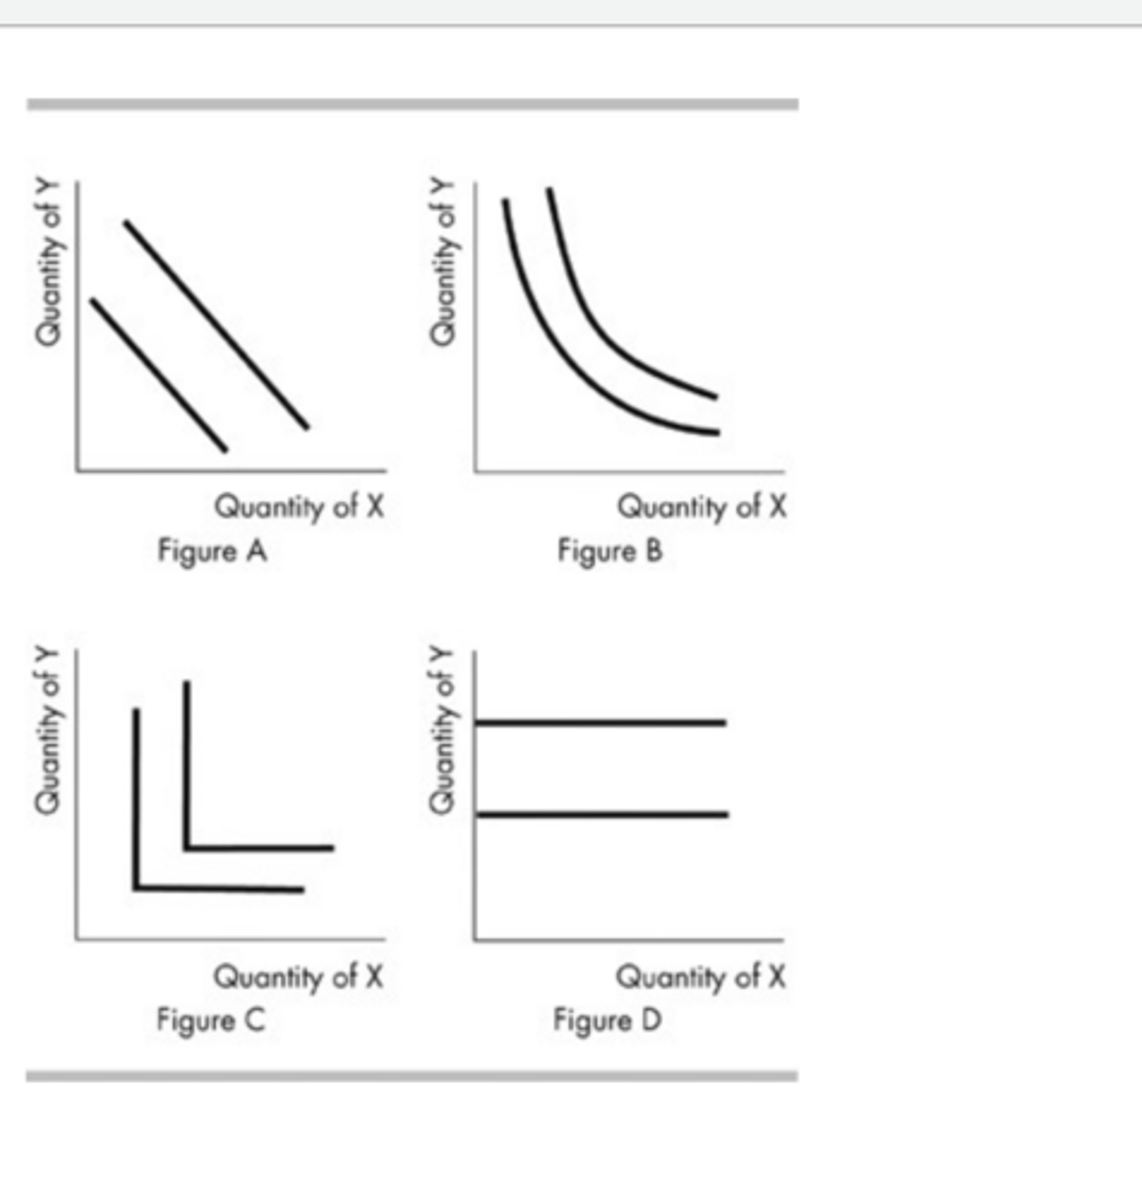
Consider the indifference maps shown above. If X and Y are perfect substitutes, your indifference curves between them would look like those in
Figure A.
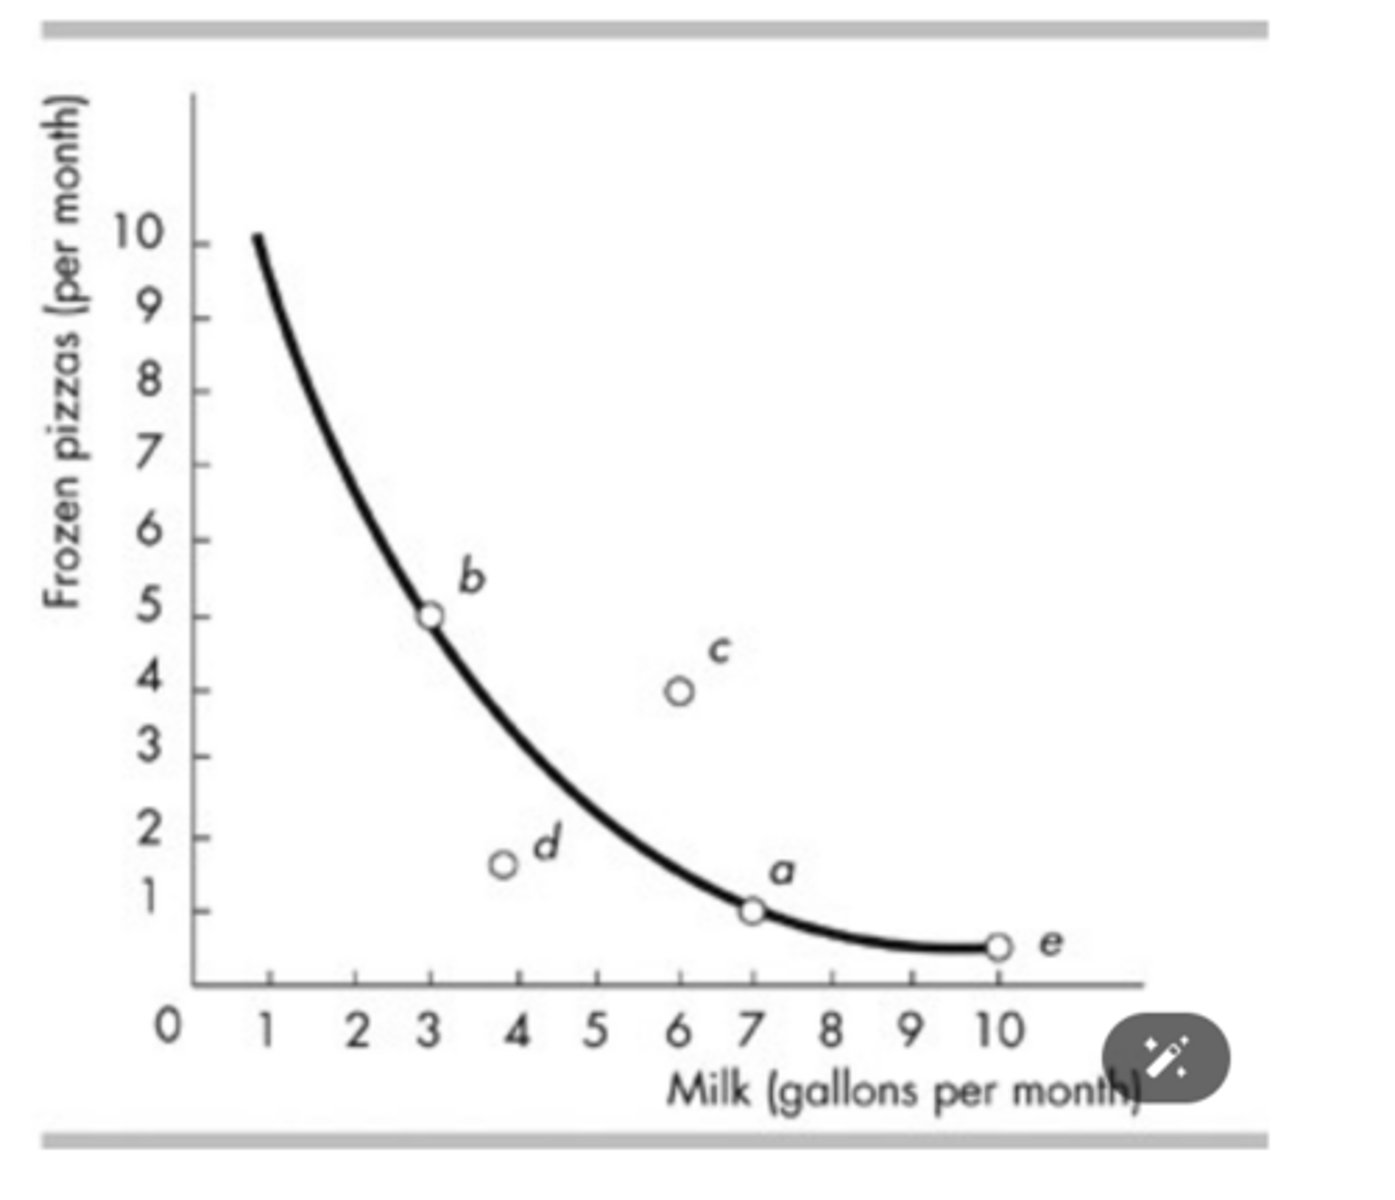
The figure above shows a consumer is indifferent between points
b and a
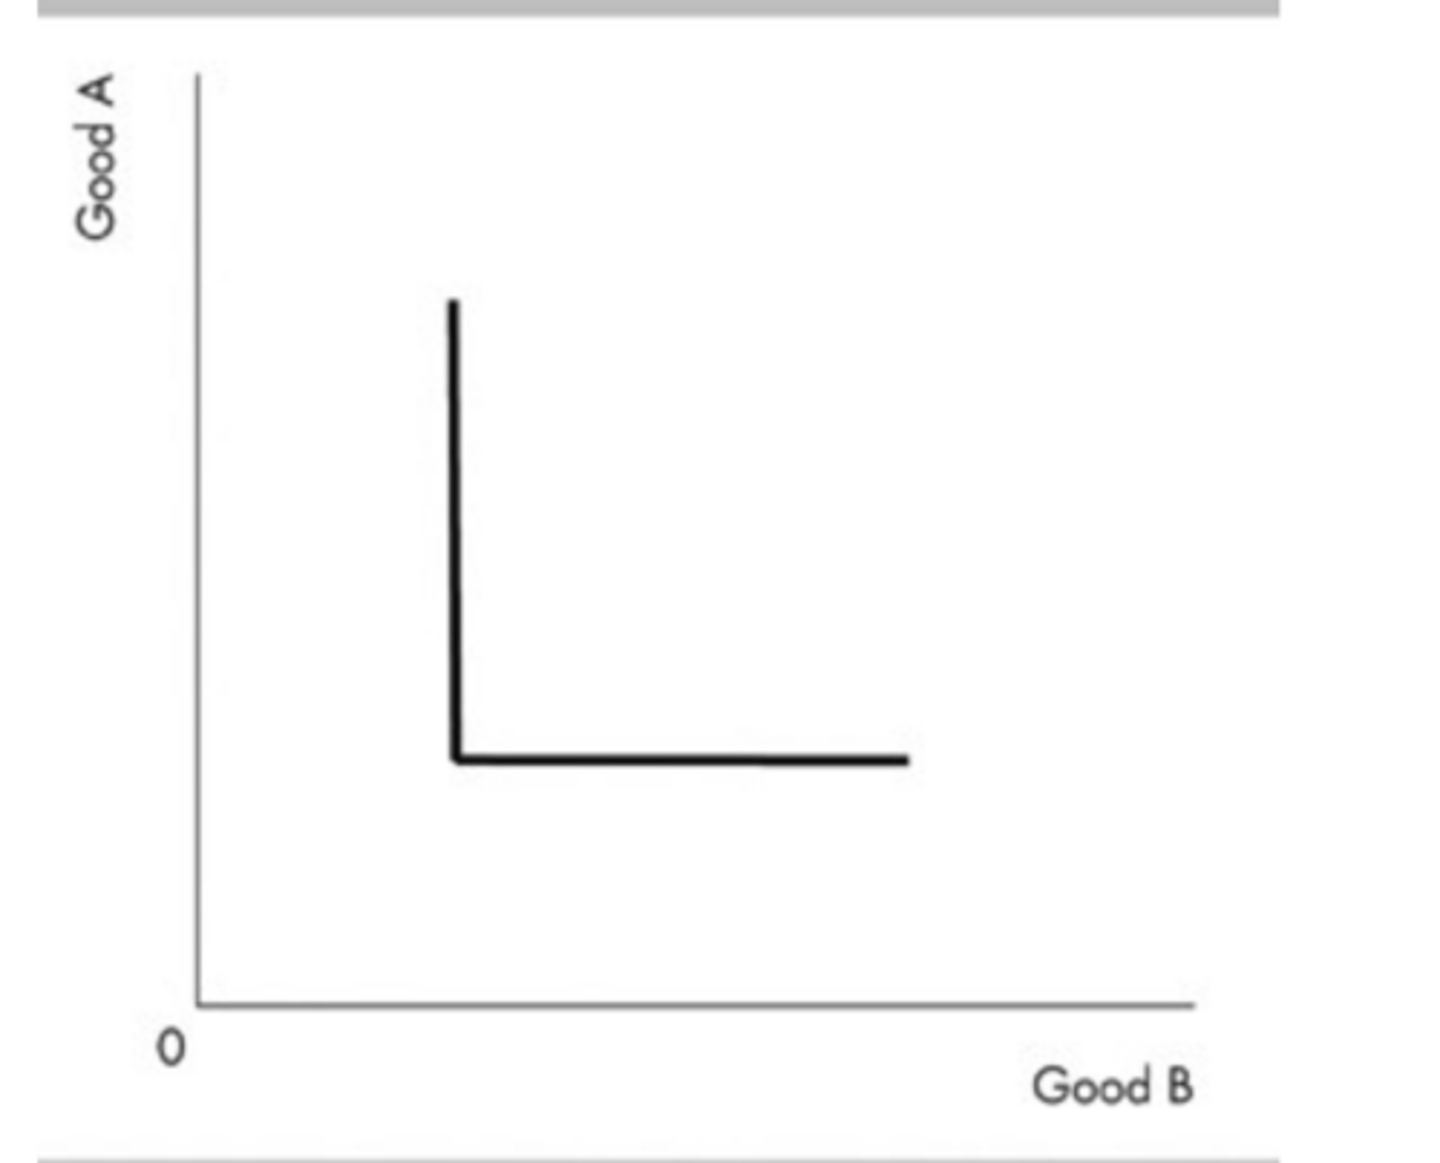
The indifference curve in the above figure
could illustrate a person's preferences for right-handed and left-handed gloves.
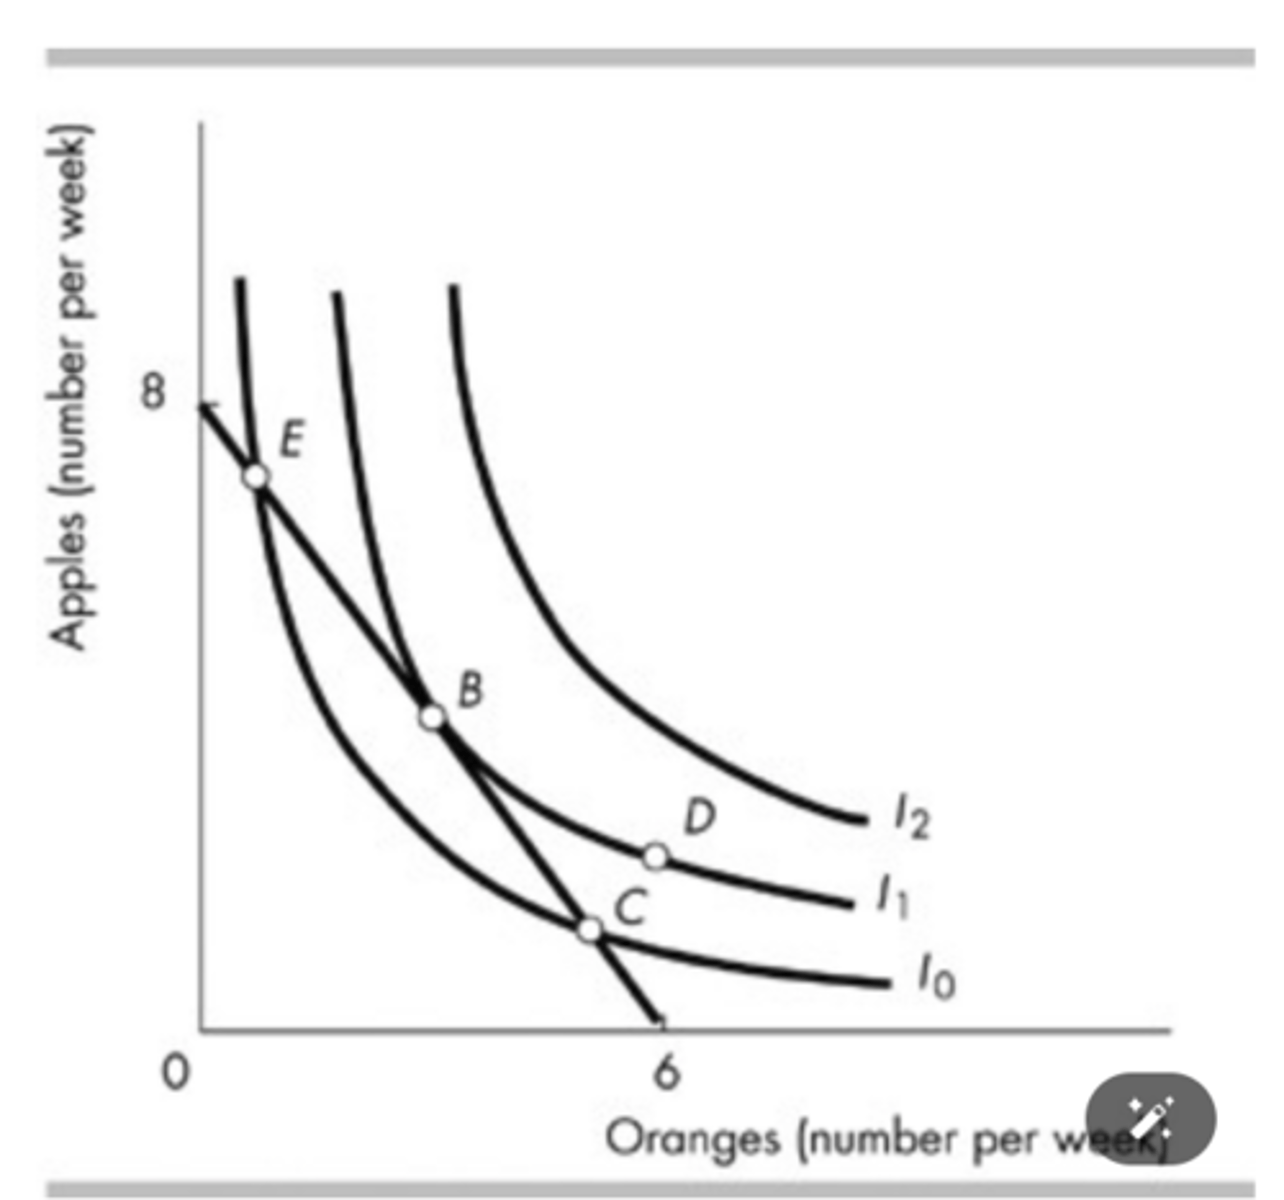
The figure illustrates Sally's budget line and her preferences. At point(s) ________, the marginal rate of substitution is equal to the relative price.
B
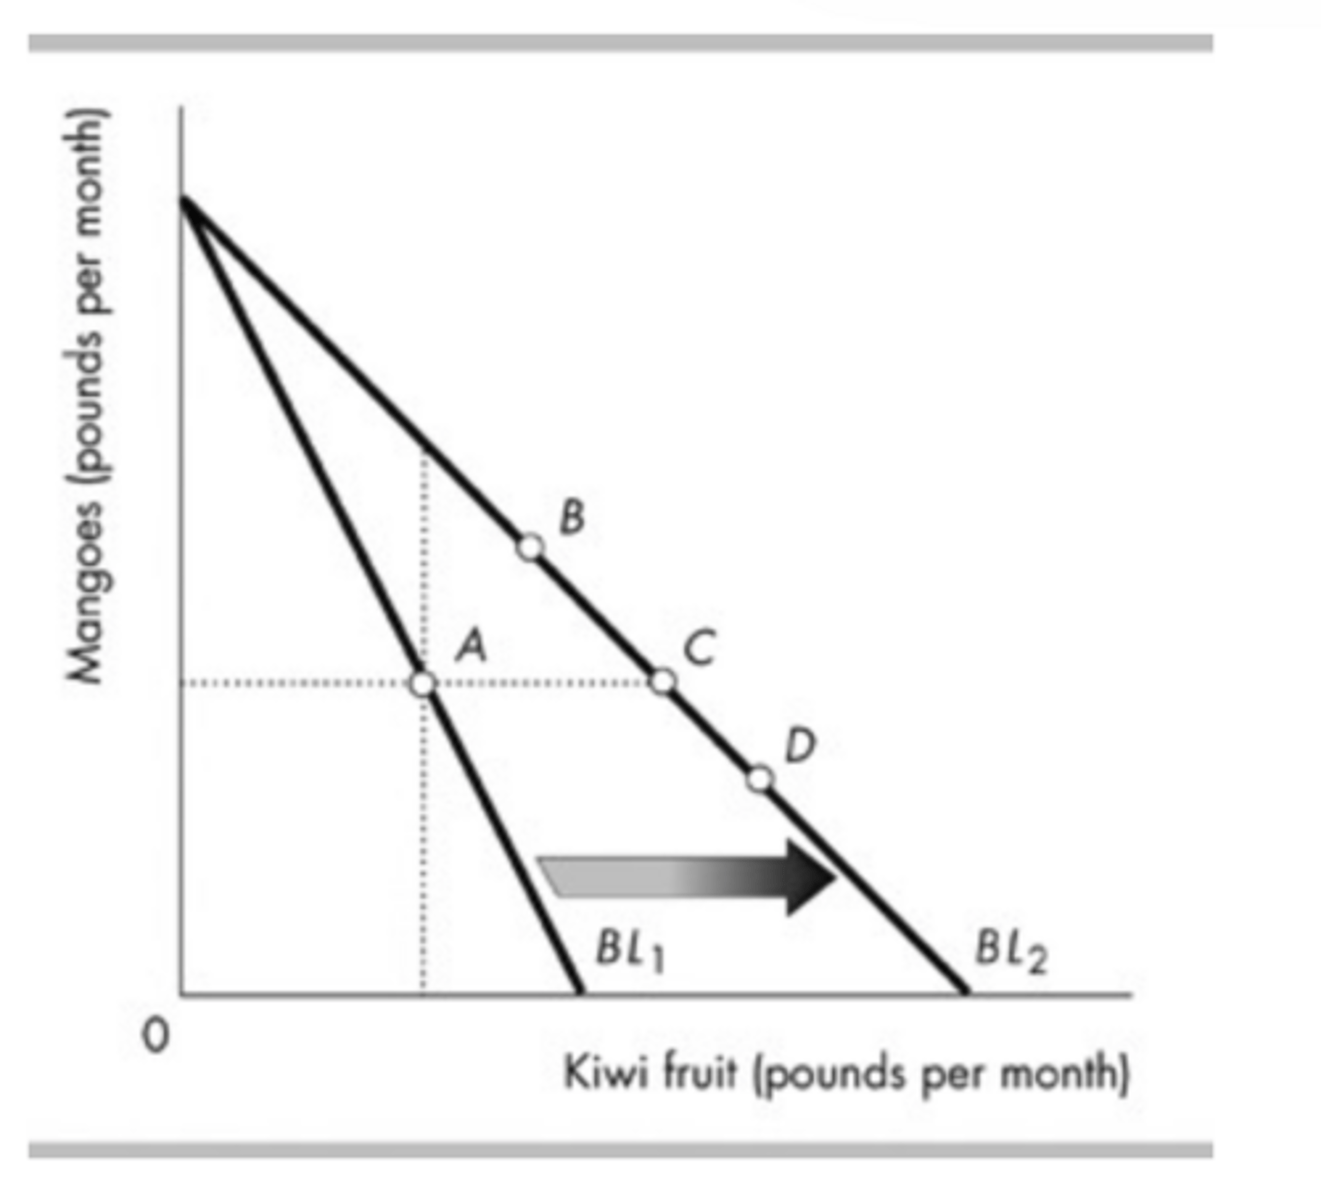
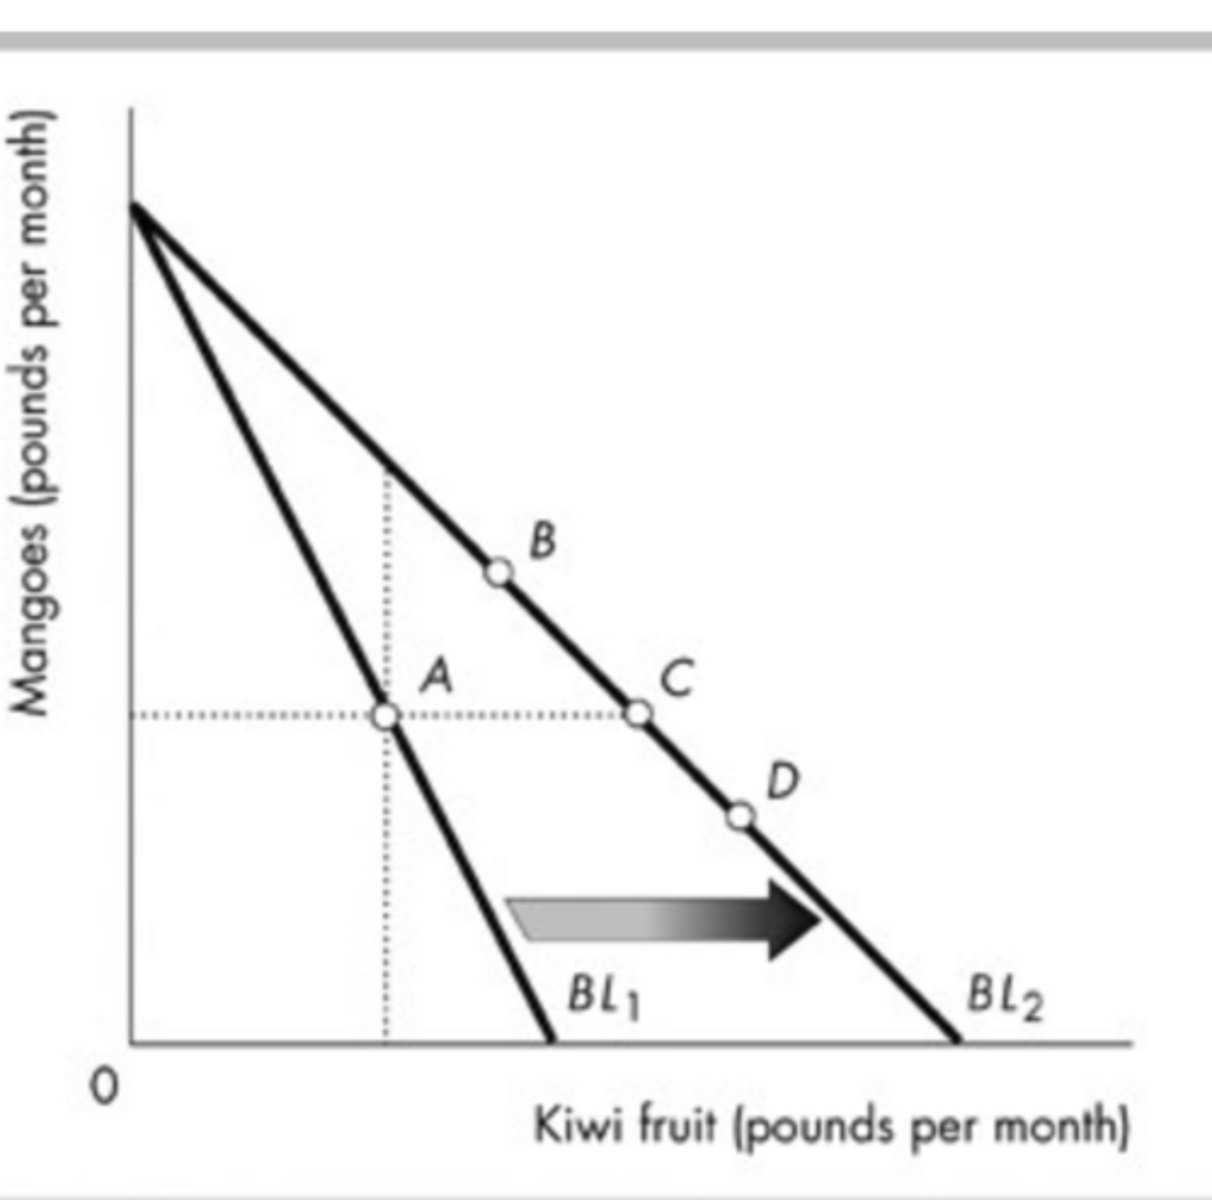
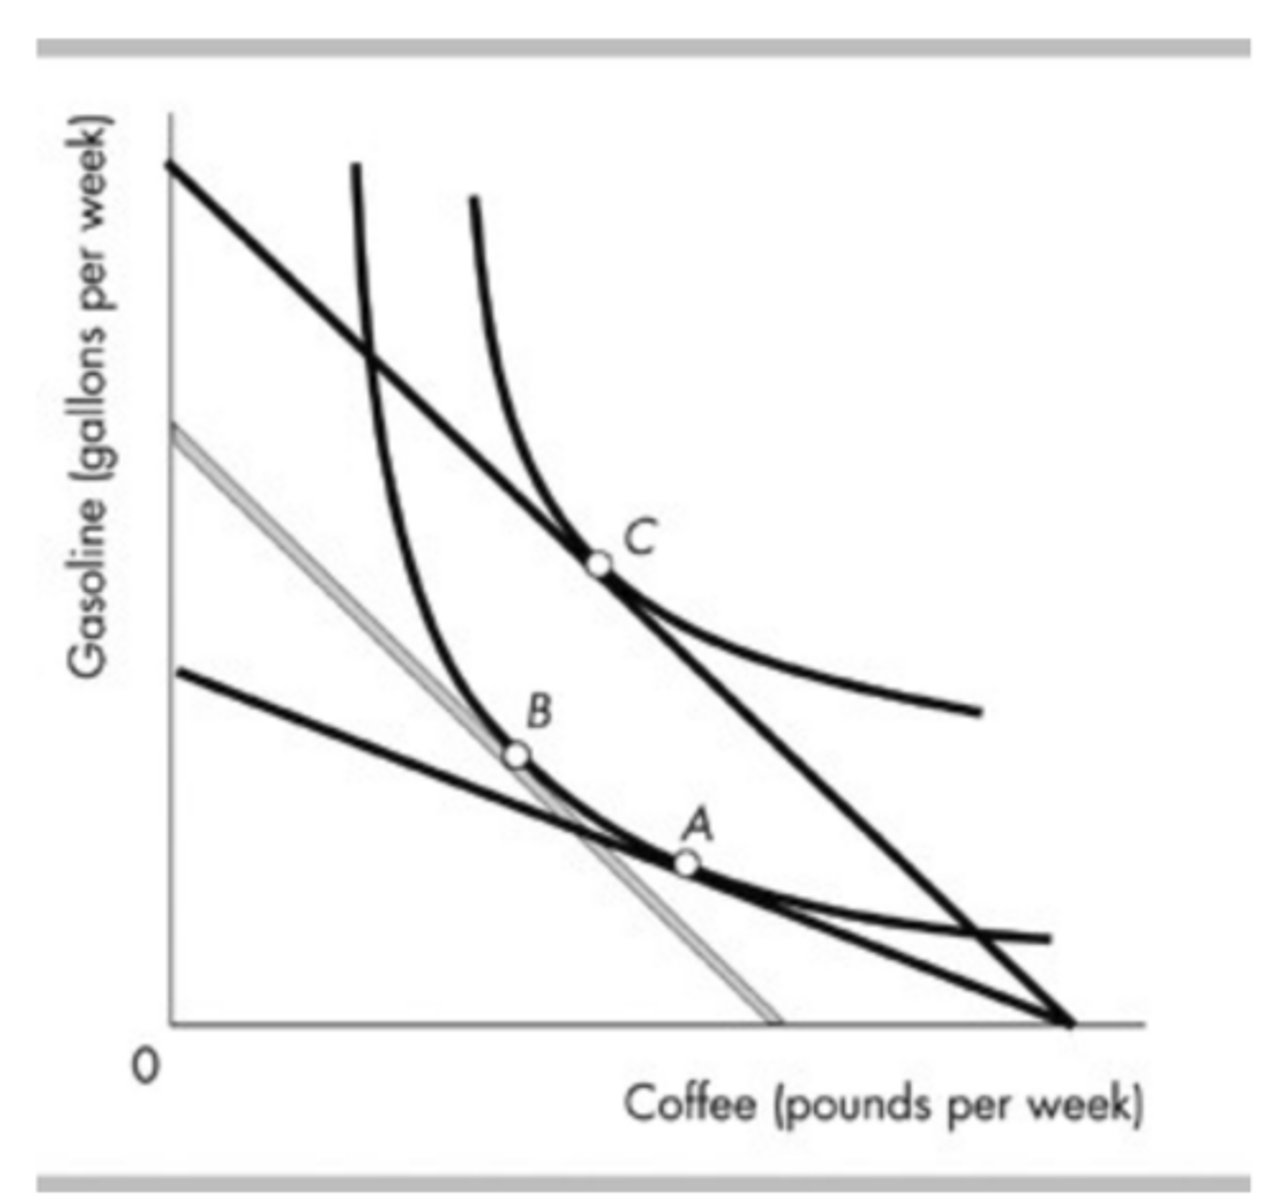
In the above figure, Reggie's budget line rotates outward from BL1 to BL2. He initially consumes at point A. If his new consumption bundle is at point C, this implies that his demand curve for kiwi fruit
slopes downward.
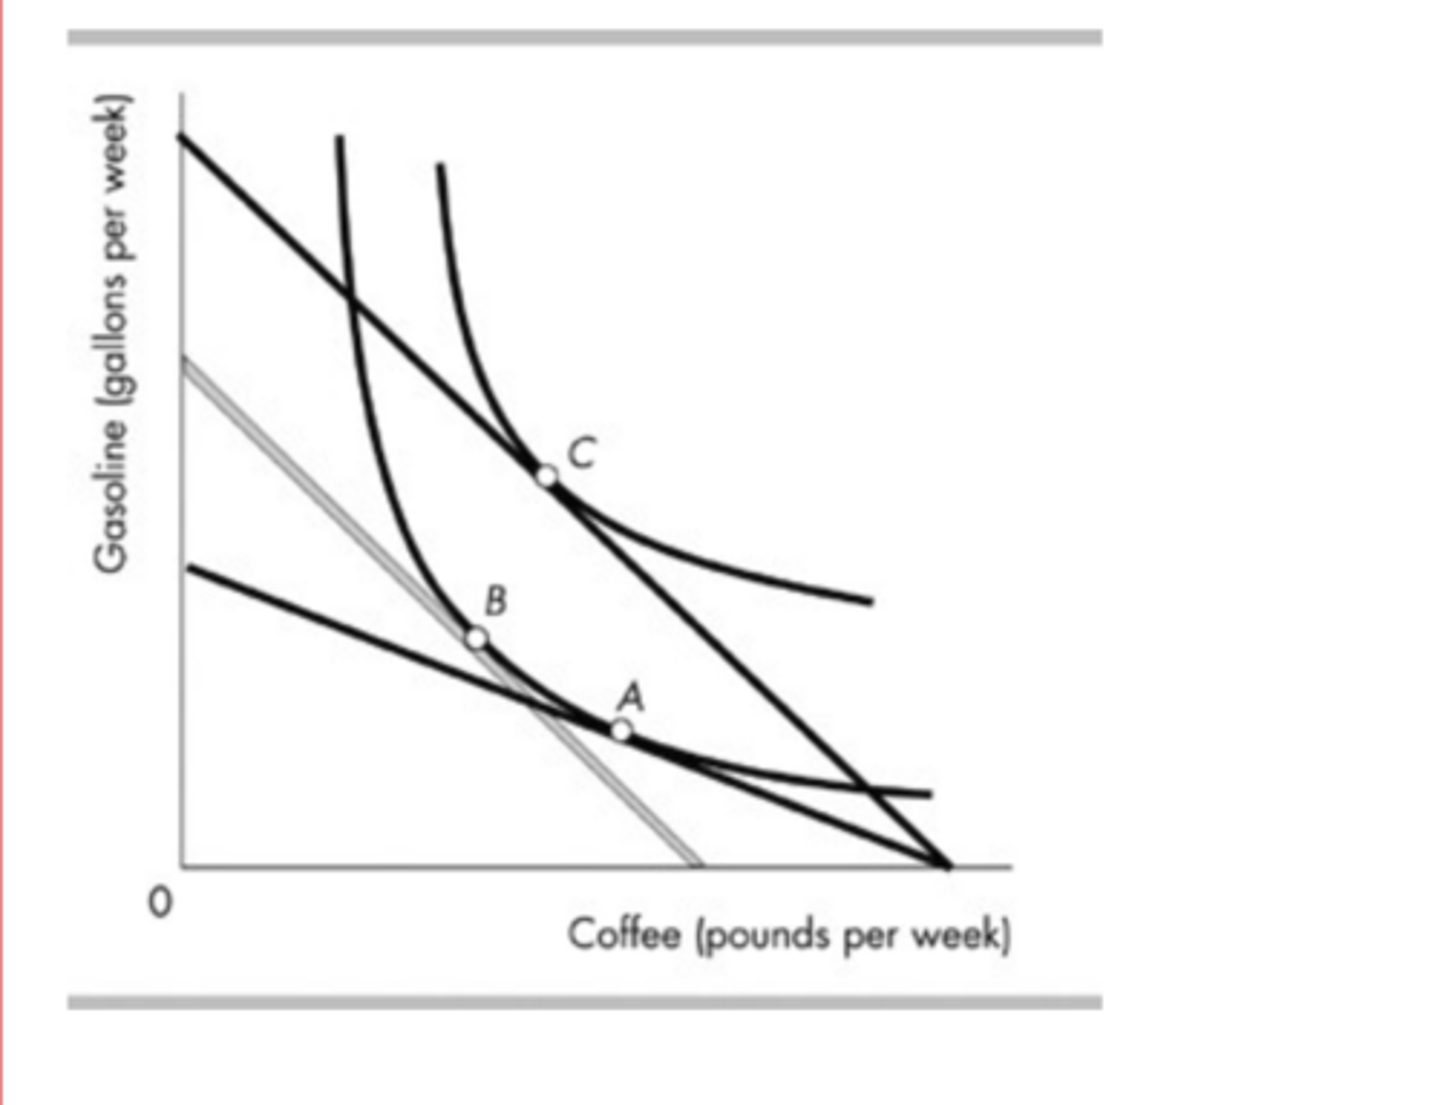
In the above figure, the movement from point C to point A is the result of
an increase in the price of gasoline.
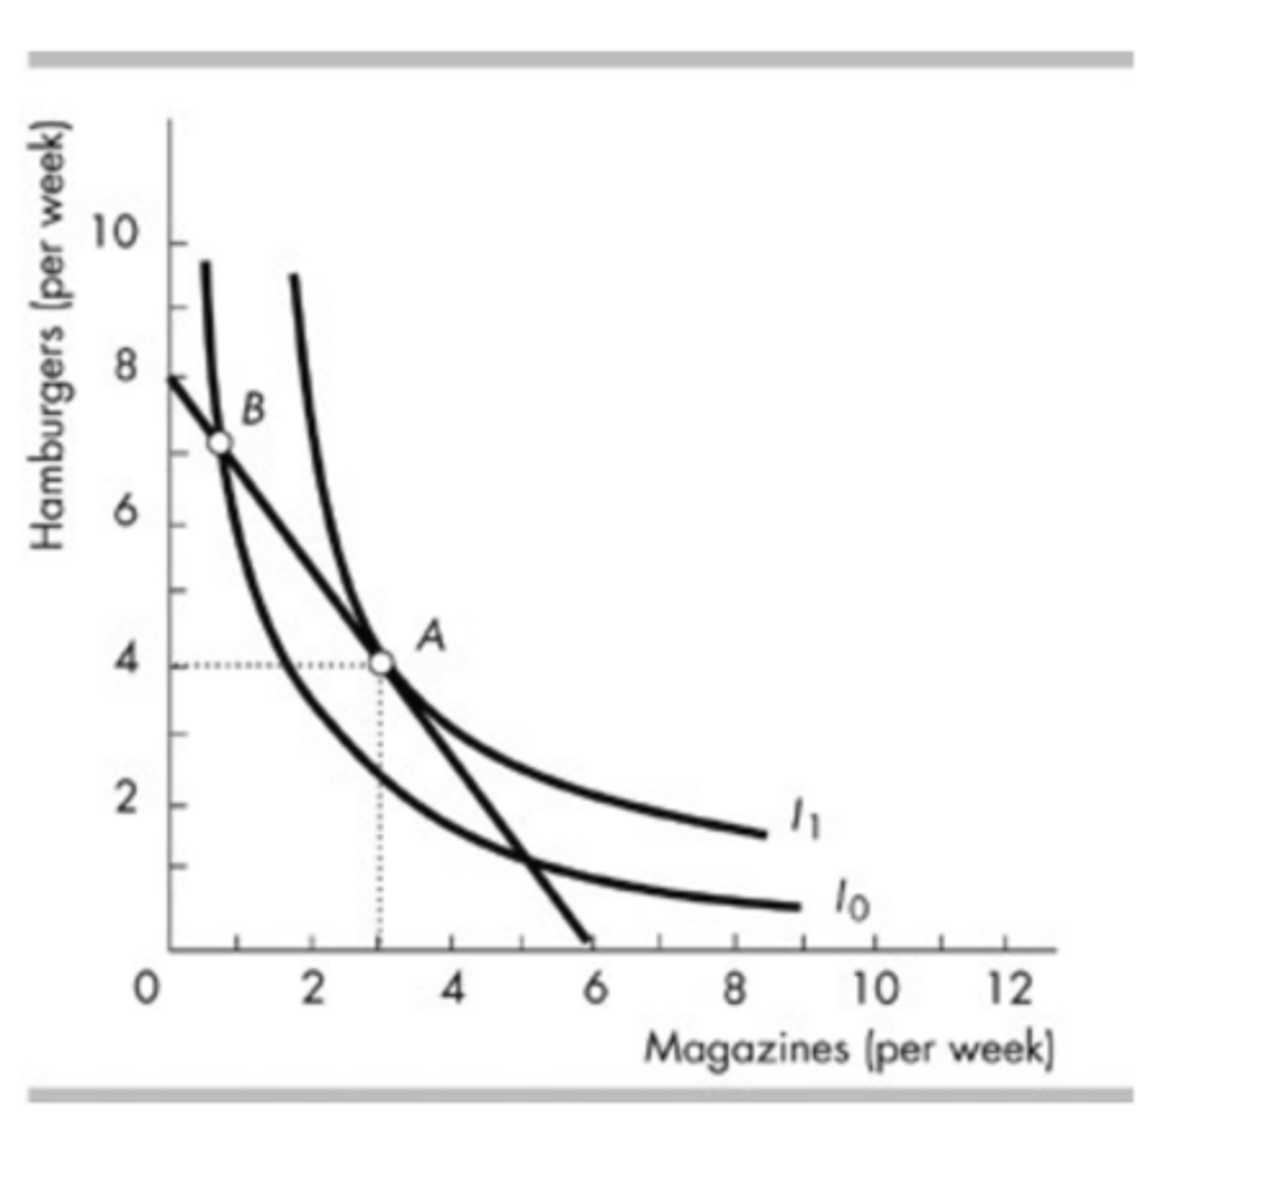
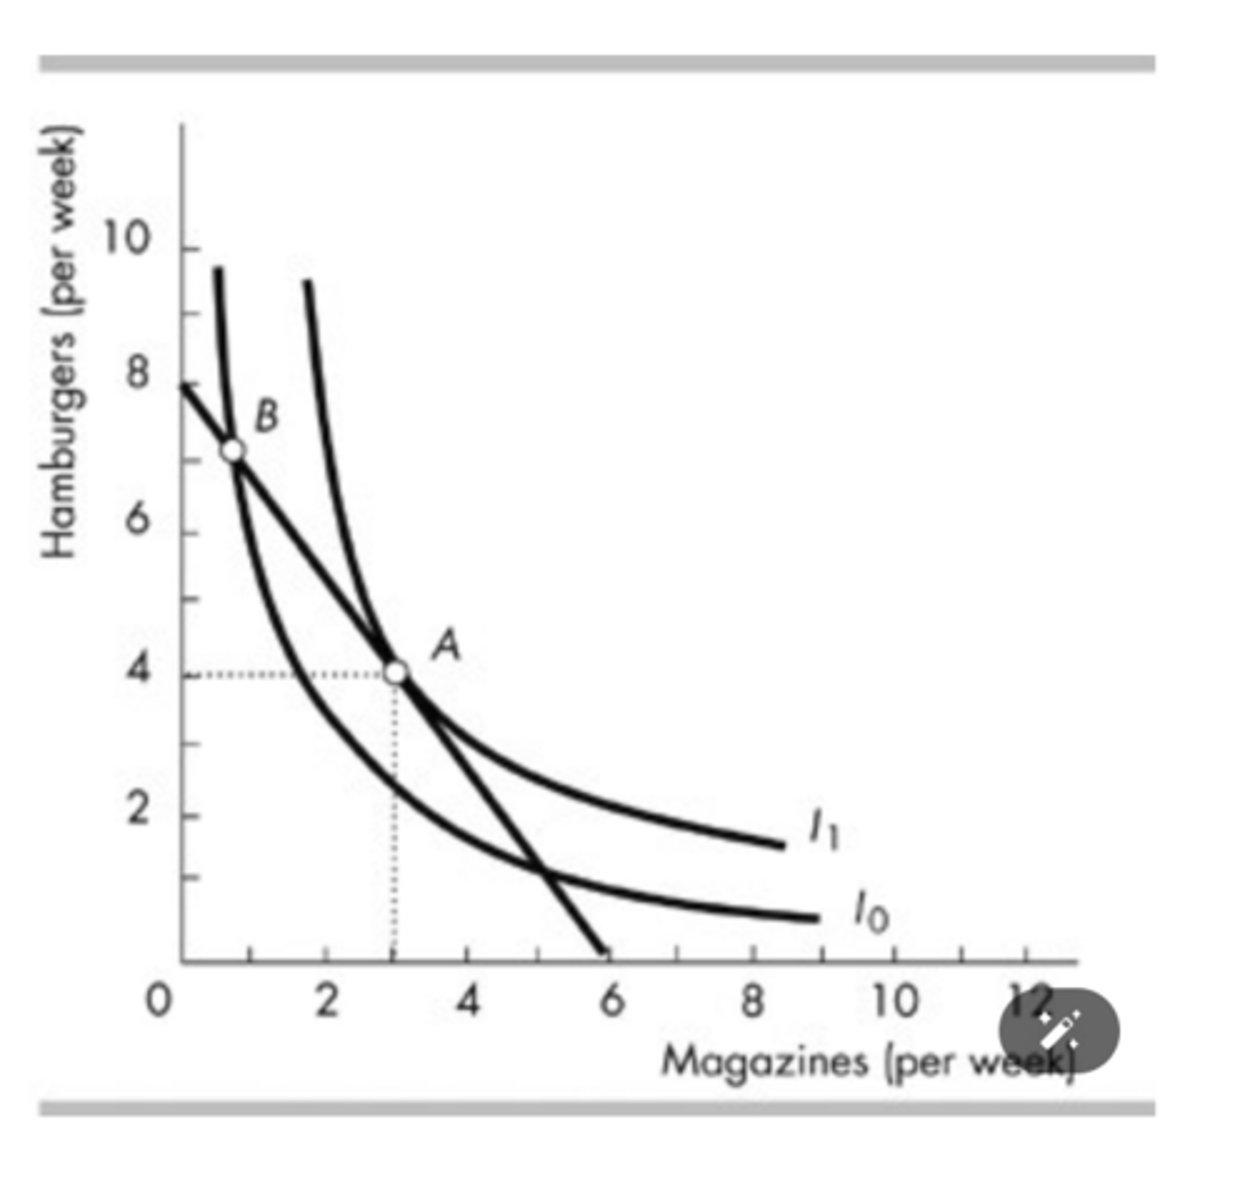
In the above figure, at the best affordable point, the marginal rate of substitution is
1.33 hamburgers per magazine.
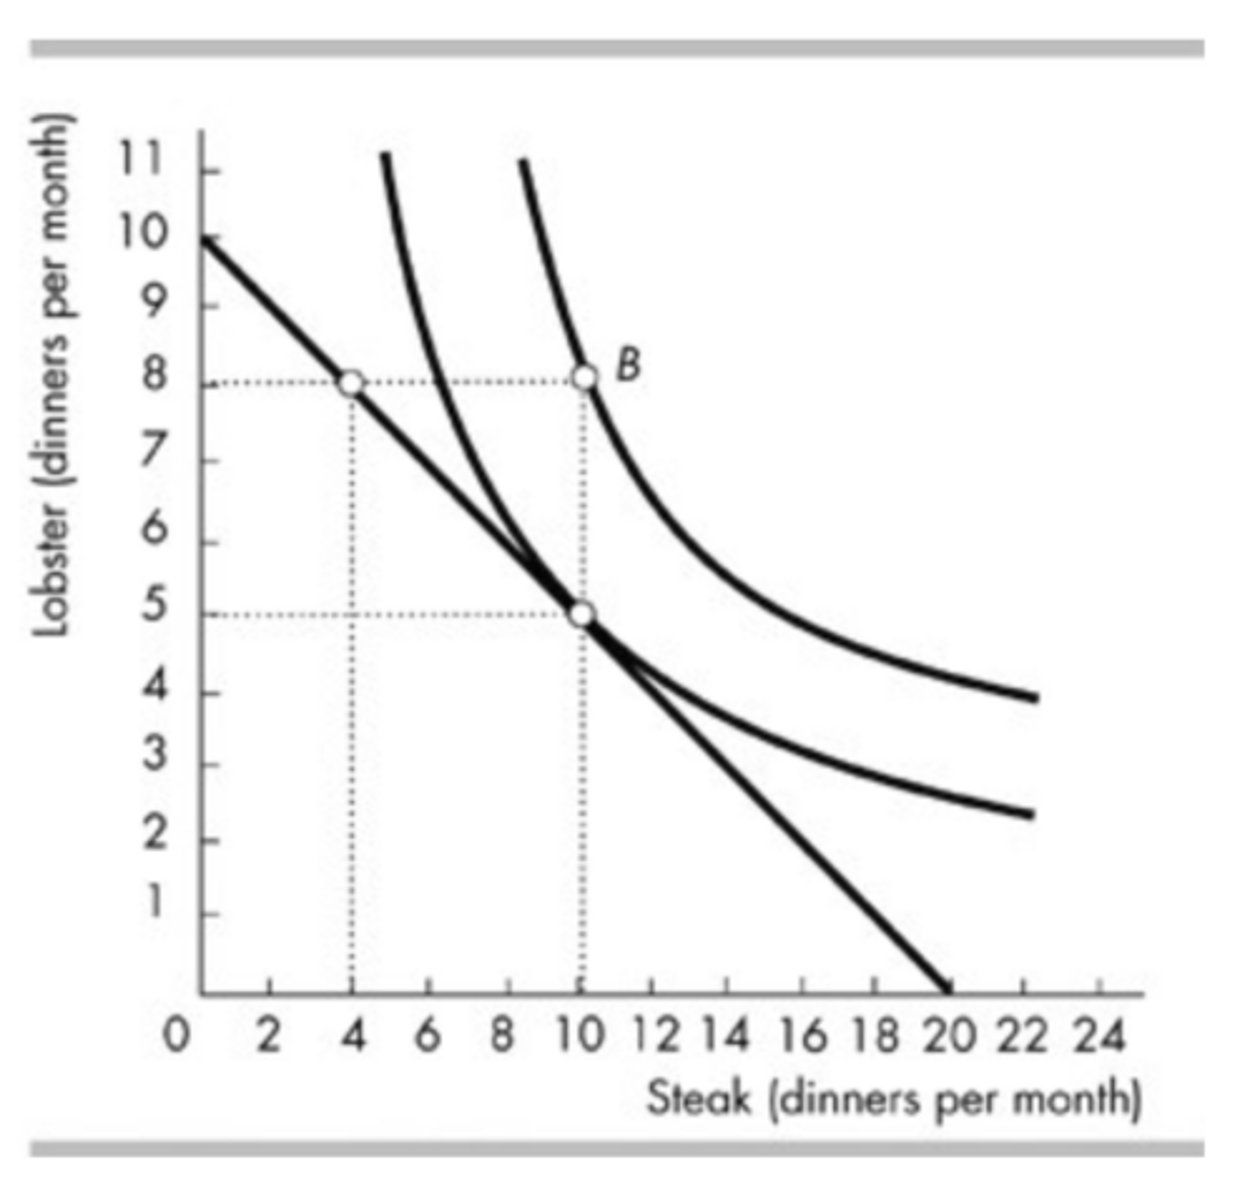
The above figure shows Jane's budget line and two of her indifference curves. Which of the following happens to Jane's budget line if the price of a lobster dinner fell?
It would rotate outward around the horizontal intercept, 20 steak dinners.
In the above figure, Reggie's budget line rotates outward from BL1 to BL2. He initially consumes at point A. If his new consumption bundle is at point B, this implies that kiwi fruit and mangoes are
None of the above answers is correct.
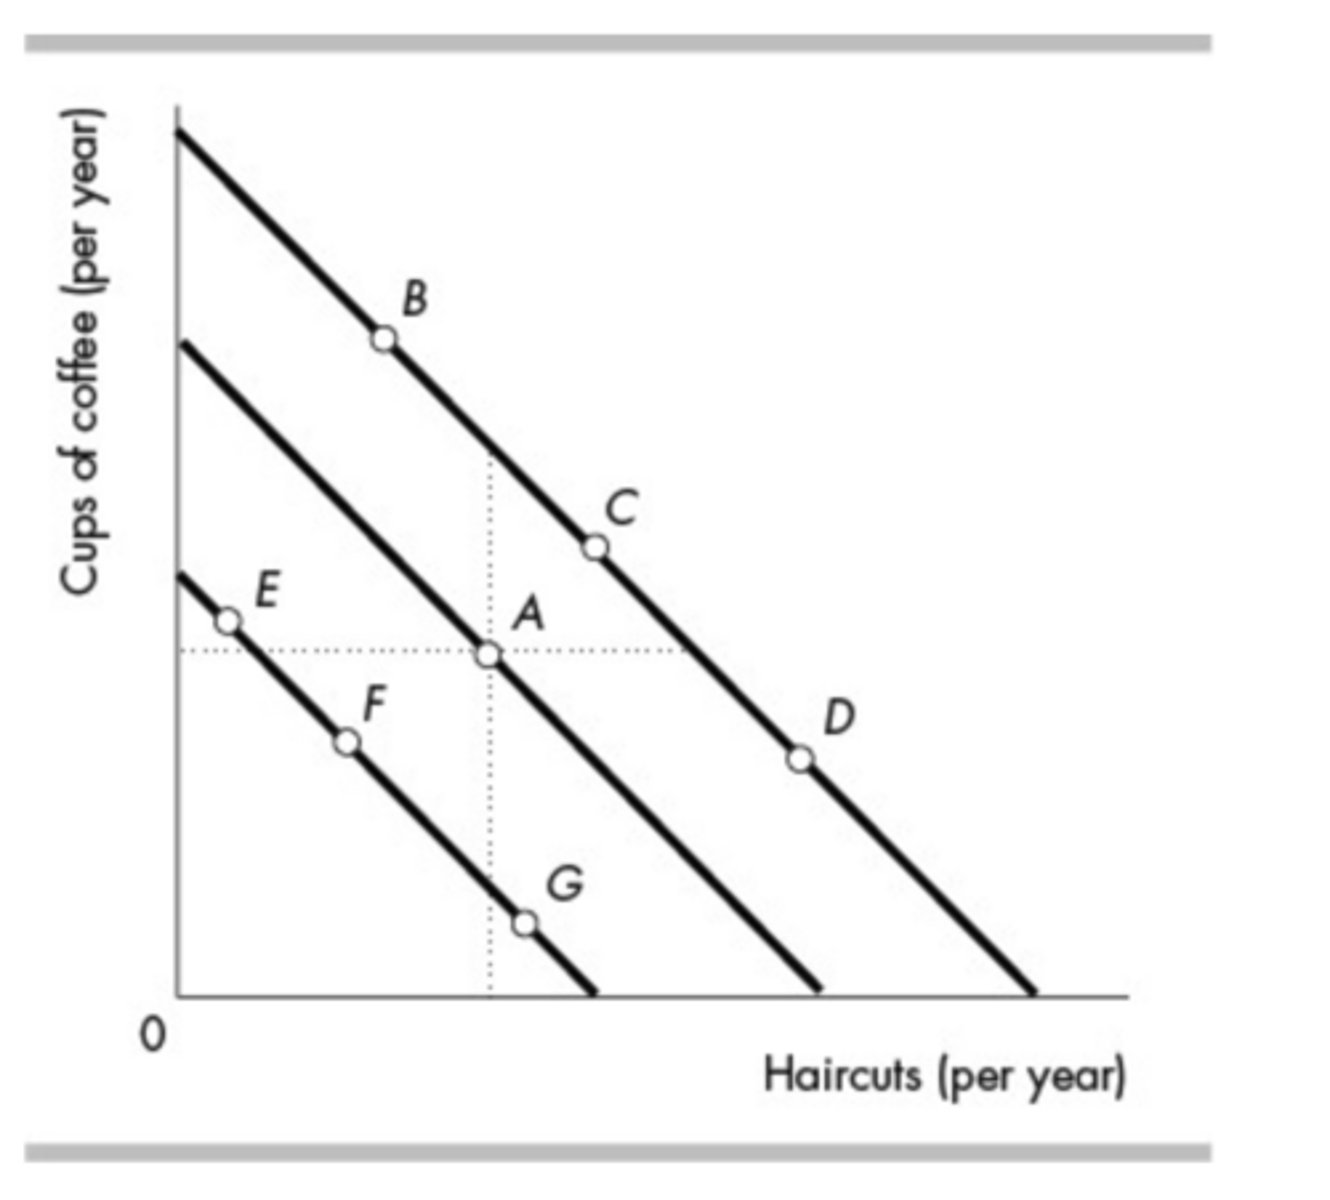
In the above figure, Brendan originally consumes at point A. If his income rises and coffee is a normal good but haircuts are an inferior good then he will begin consuming at a point such as
b
In the above figure, point B
is inferior to point A.
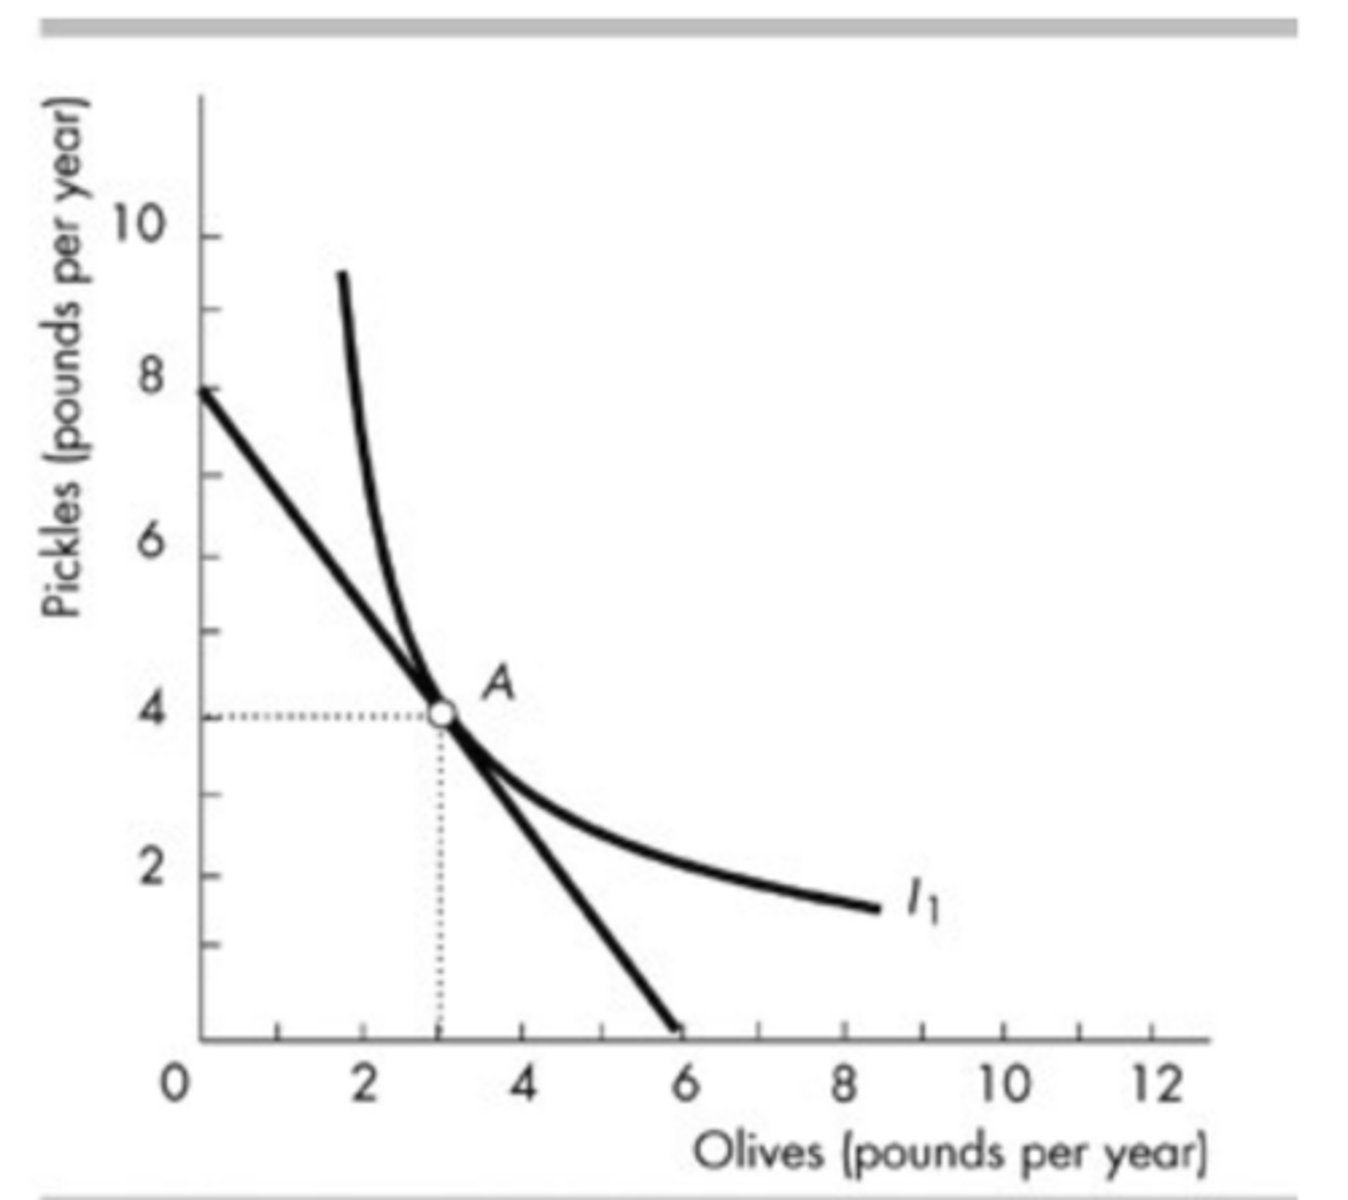
In the figure above, Sam originally selects his consumption bundle at point A with 3 pounds of olives and 4 pounds of pickles a year. Then the price of pickles rises and the price of olives falls so that his budget line rotates but it still goes through point A. At point A, the slope of the indifference curve I1 ________ the slope of the new budget line.
is steeper than
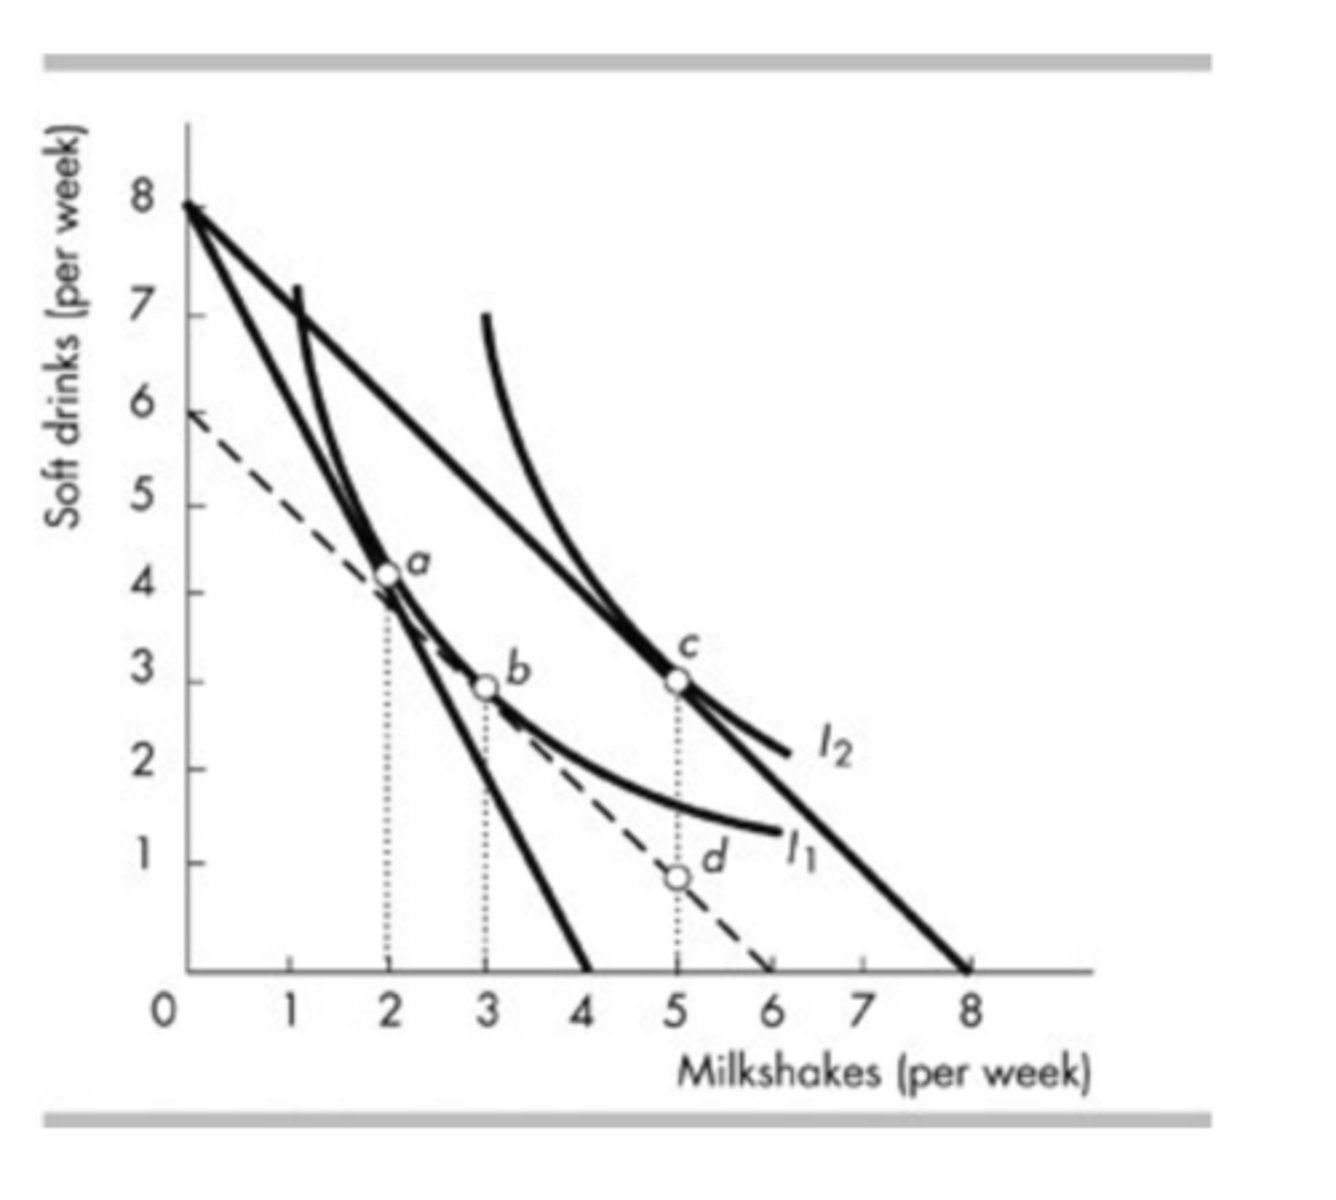
In the above figure, income is $8, the price of a soft drink is $1, and the initial price of a milkshake is $2. If the price of a milkshake decreases to $1, the income effect is the movement from point ________ to point ________.
b; c
In the above figure, the rise in the price of a gallon of gasoline that created the movement from point C to point A would be shown as a movement ________ along the demand curve for ________.
upward; gasoline
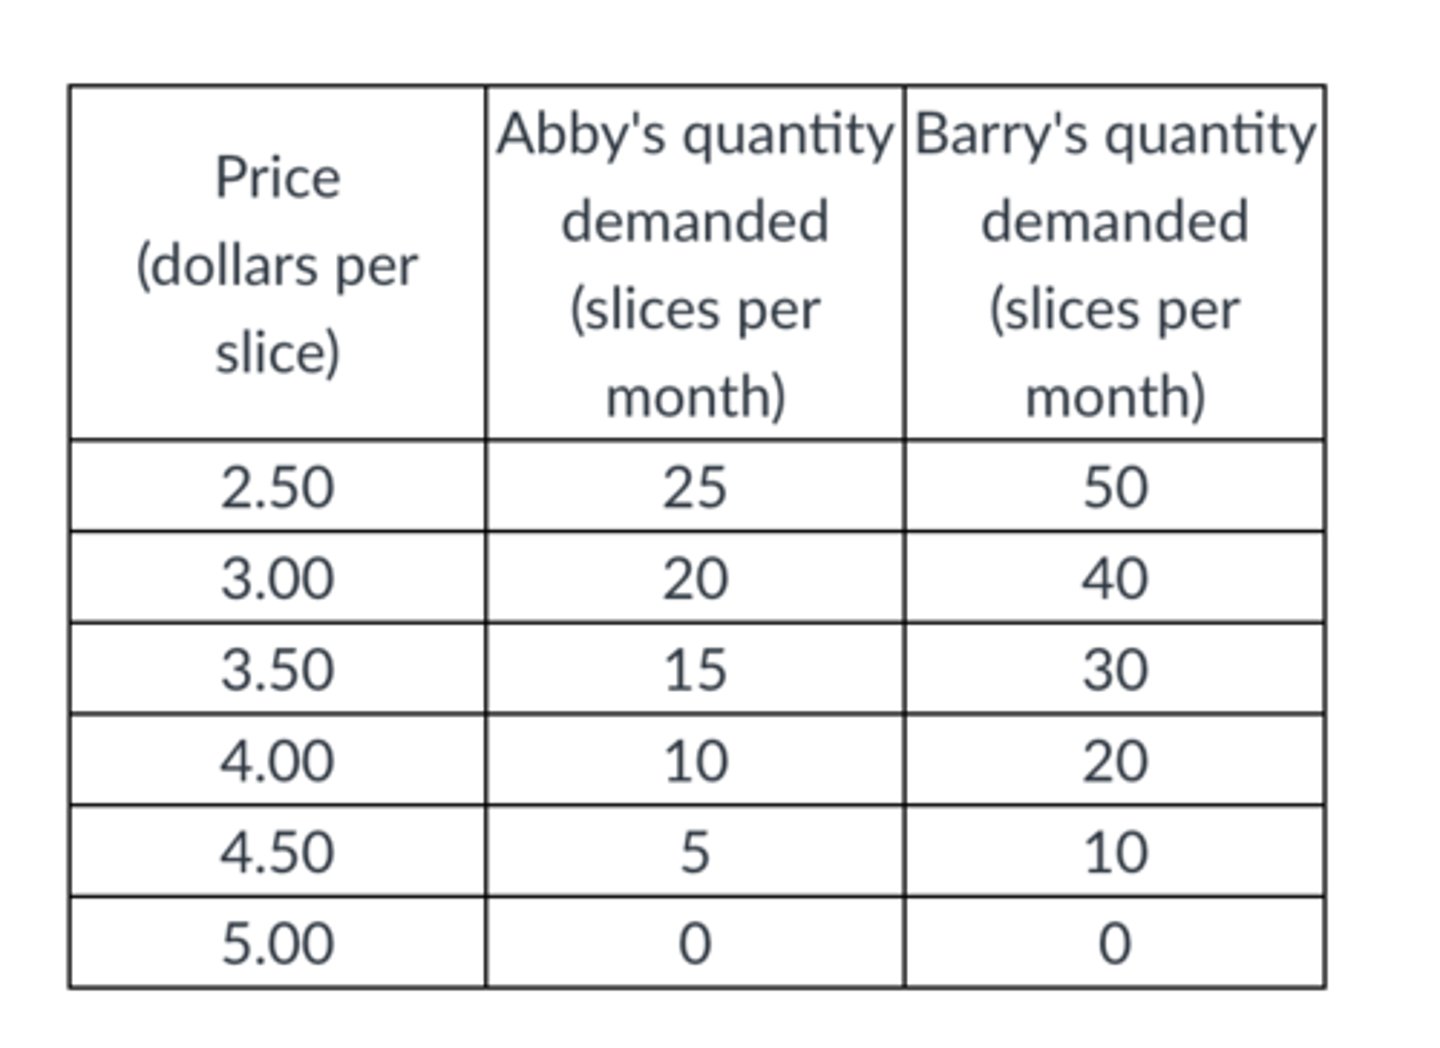
Based on the table, what is Abby's marginal benefit from the 10th slice of pizza?
$4
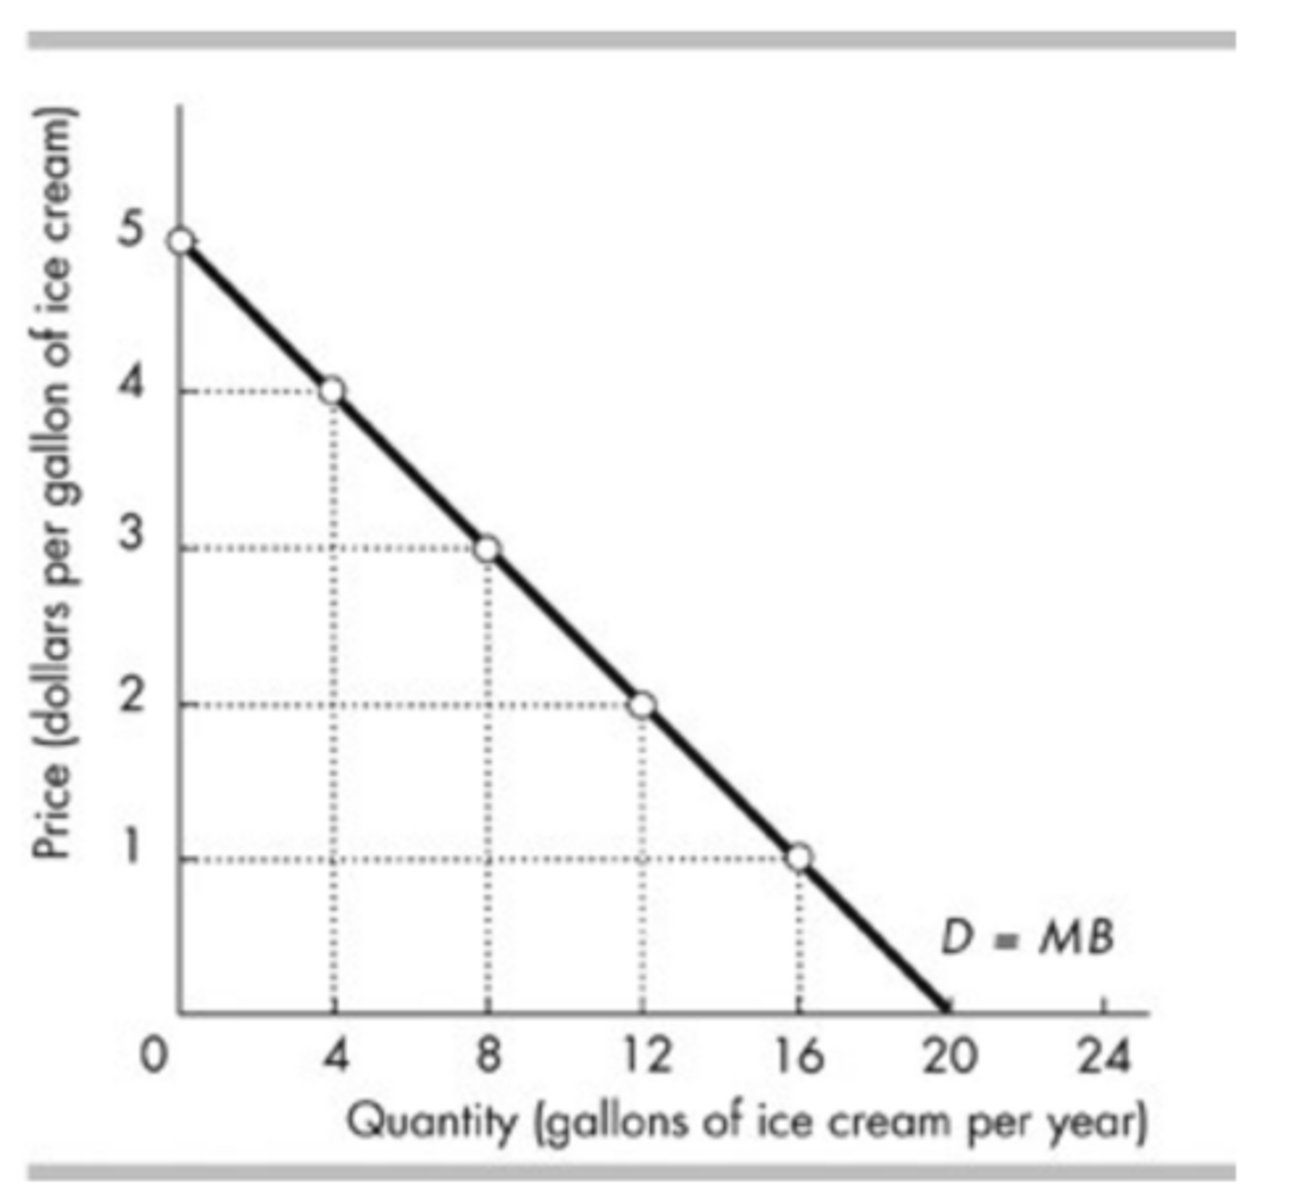
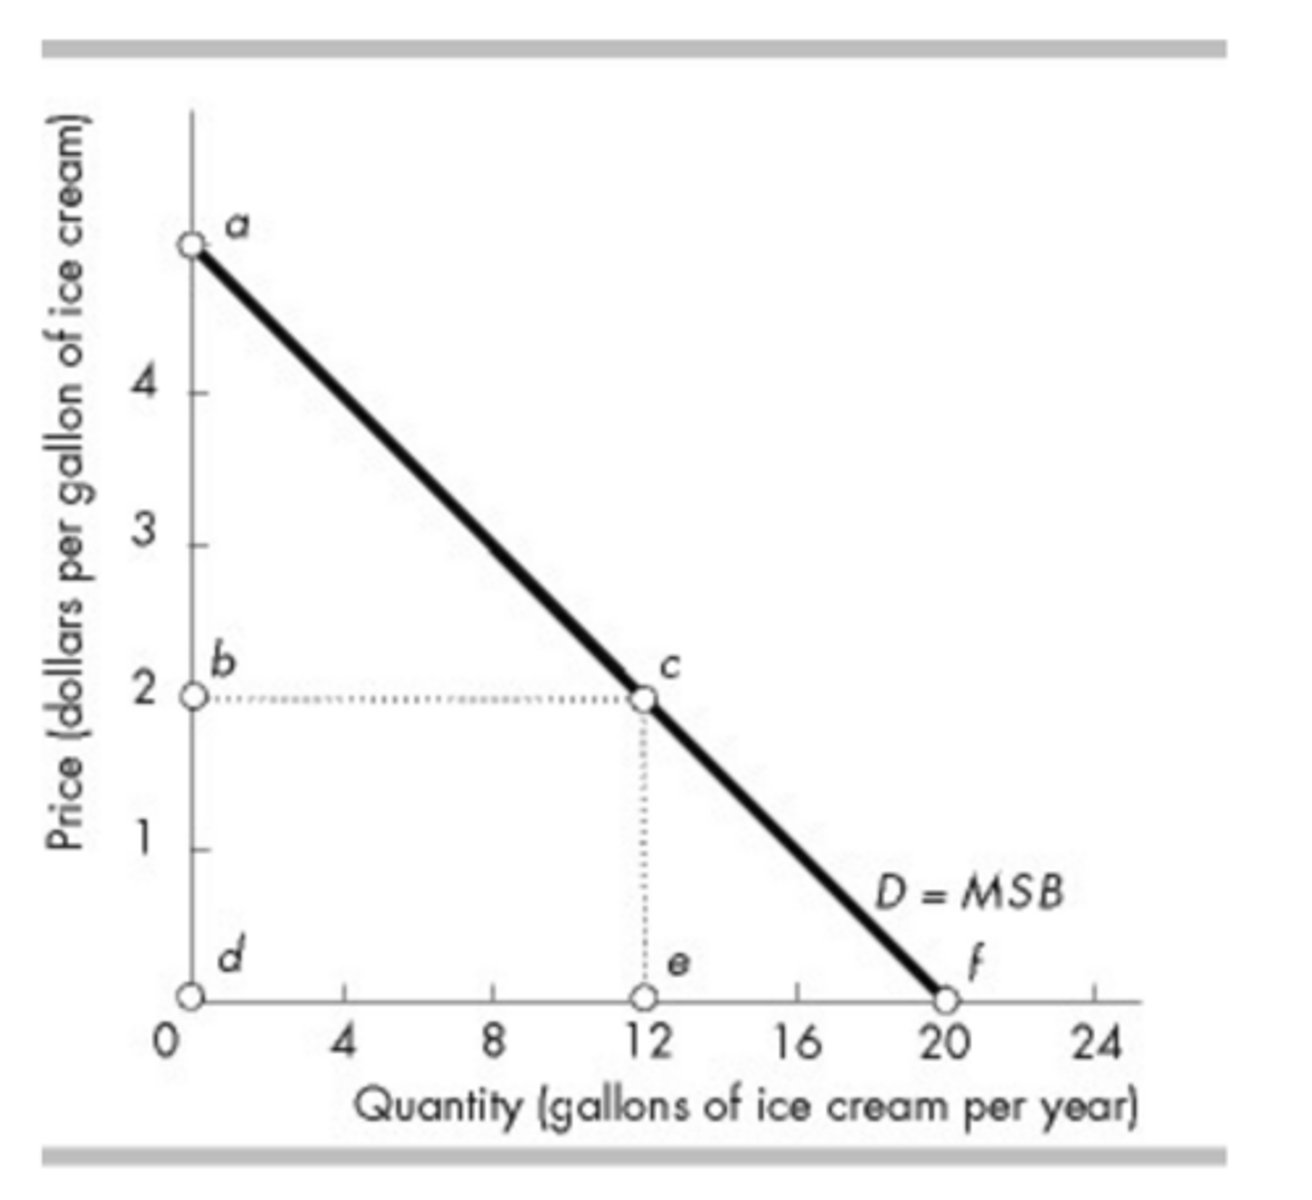
The above figure shows Dana's marginal benefit curve for ice cream. If the price of ice cream is $2 per gallon, then the maximum that Dana is willing to pay for the 8th gallon of ice cream is
$3
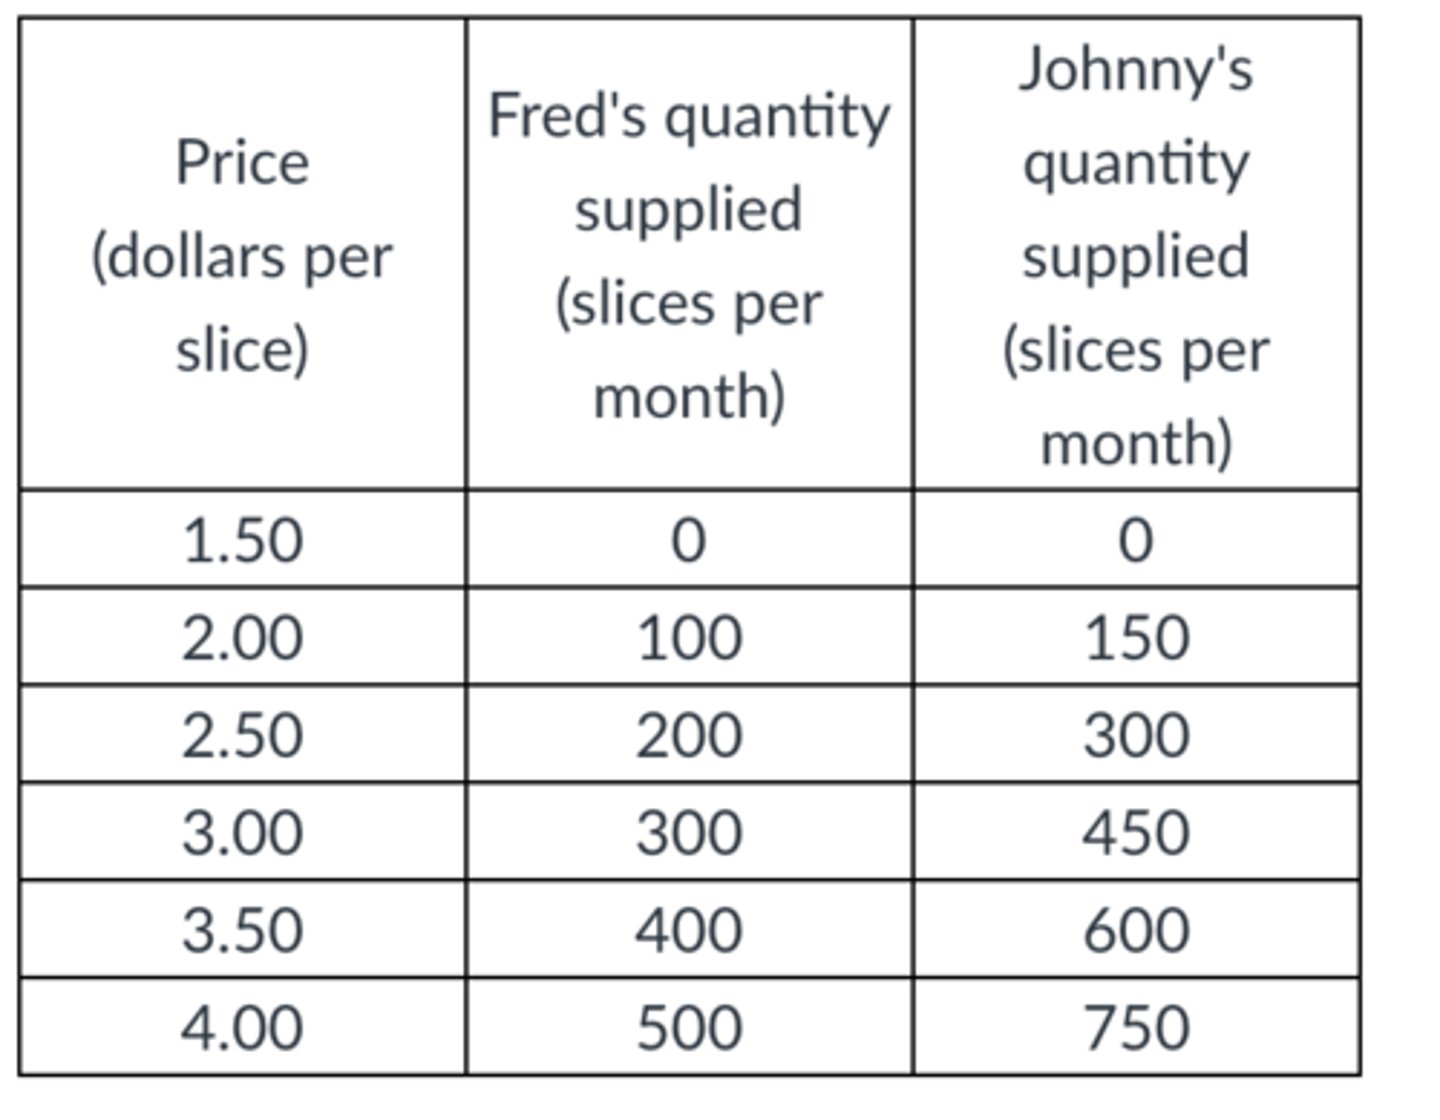
Using the table, Fred's marginal cost of the 200th slice of pizza is
$2.50
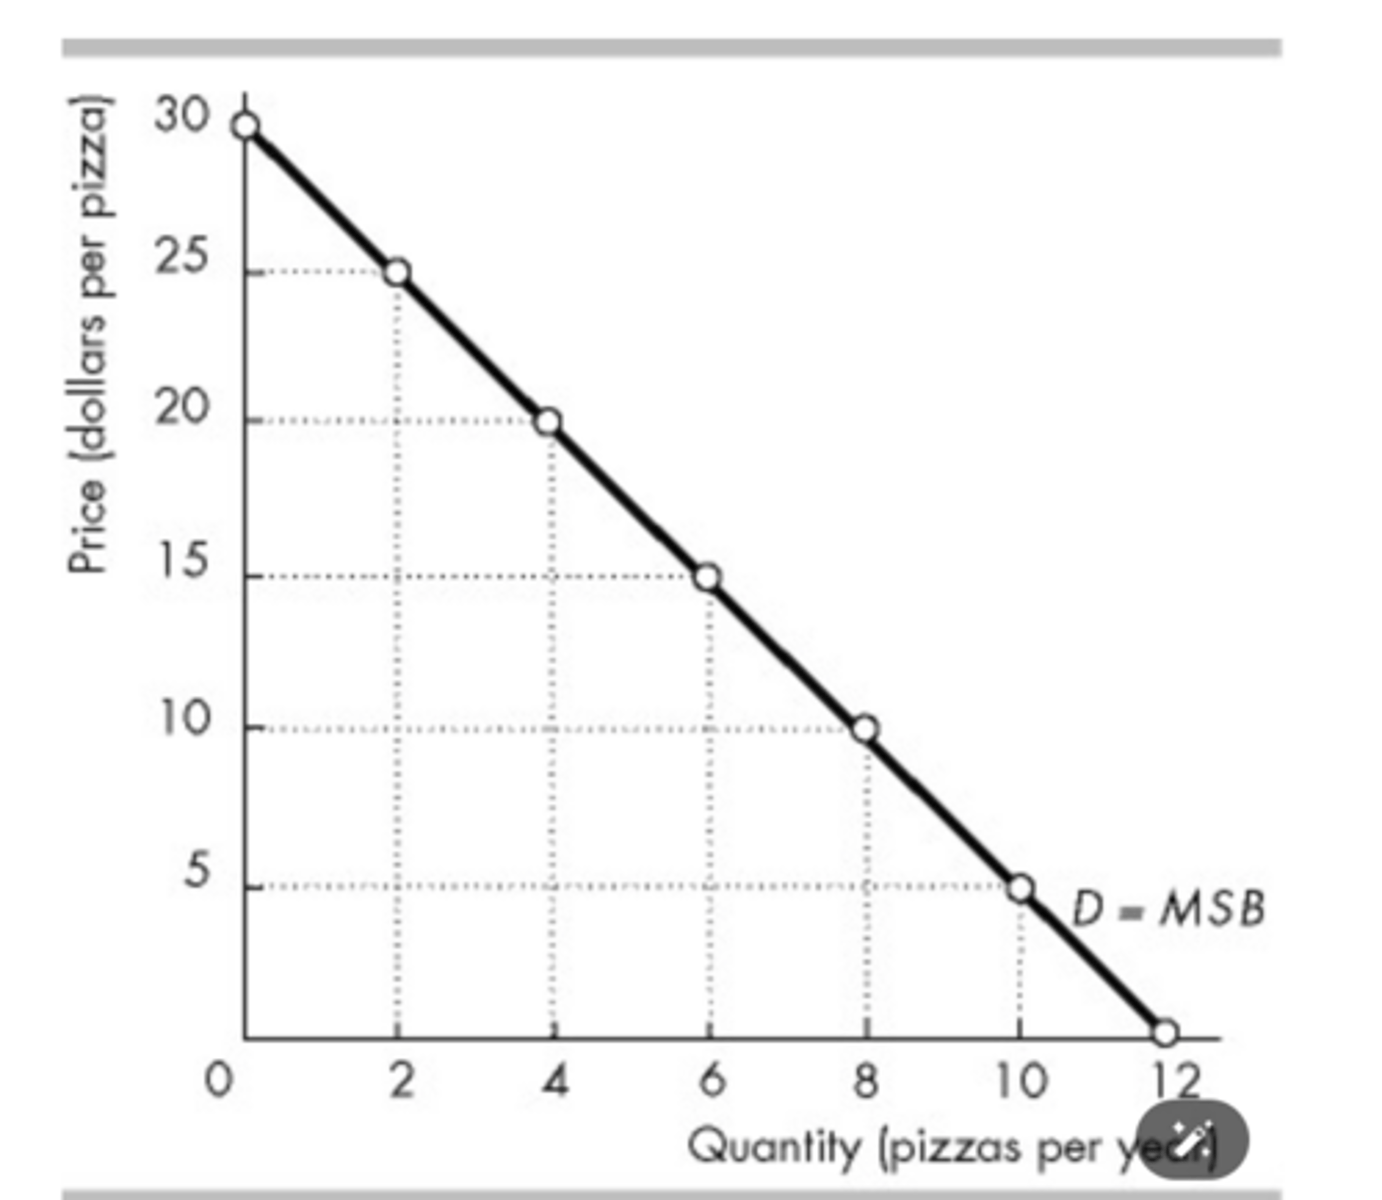
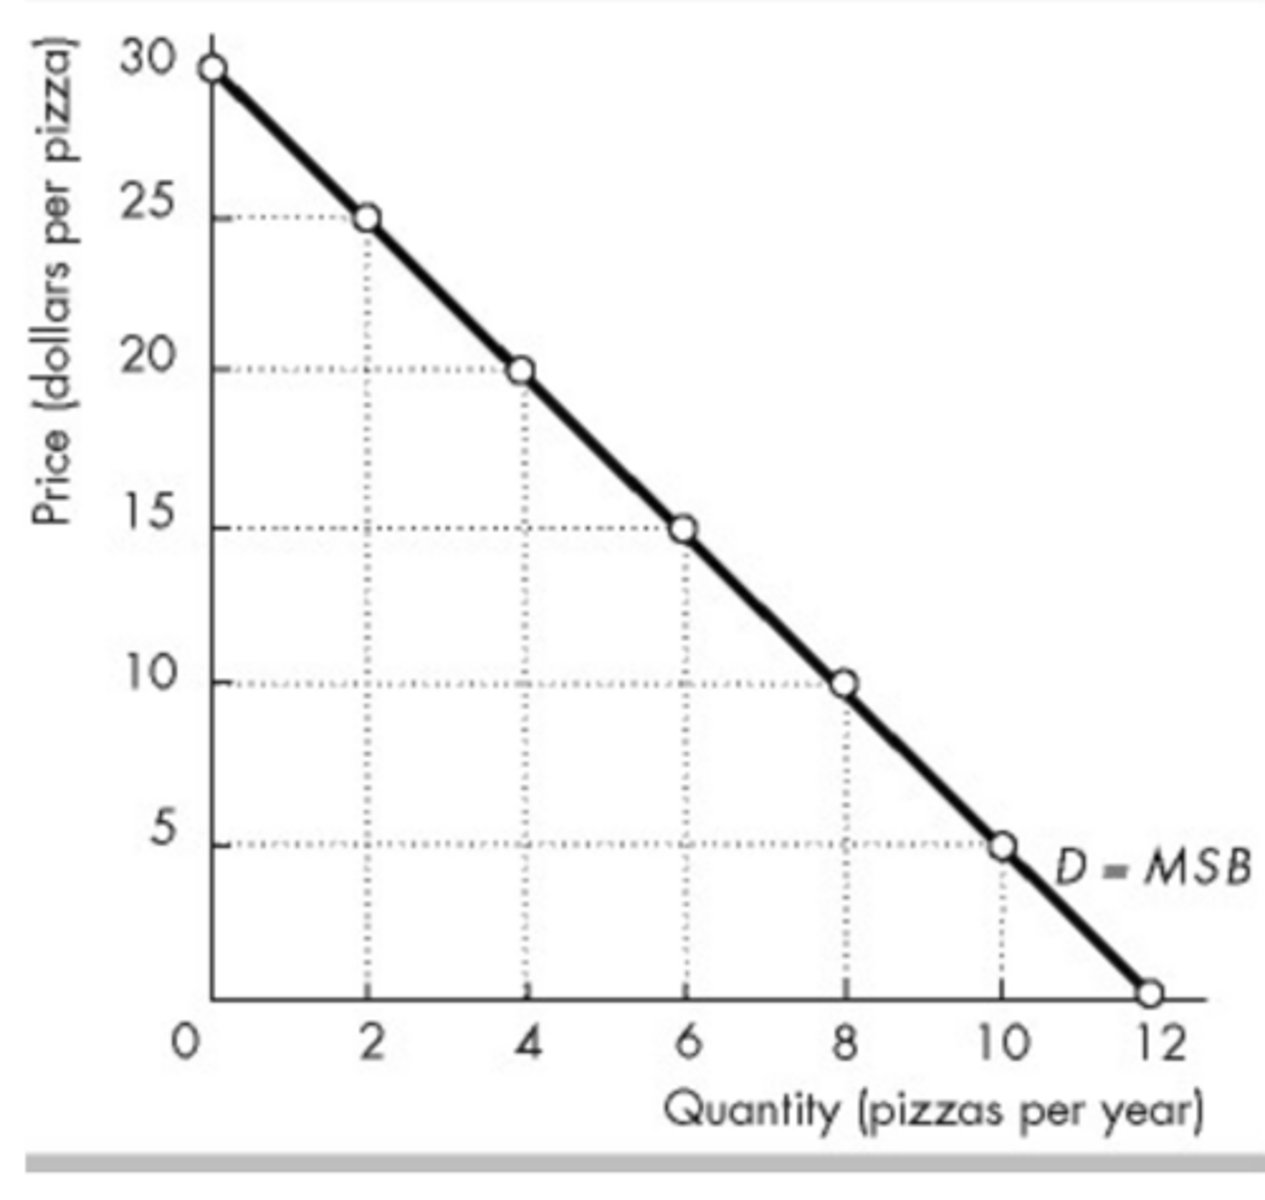
The figure above shows Clara's demand for pizza. If the price of a pizza were to increase from $15 to $25, Clara's total consumer surplus for all the pizzas she buys would
decrease by $40.
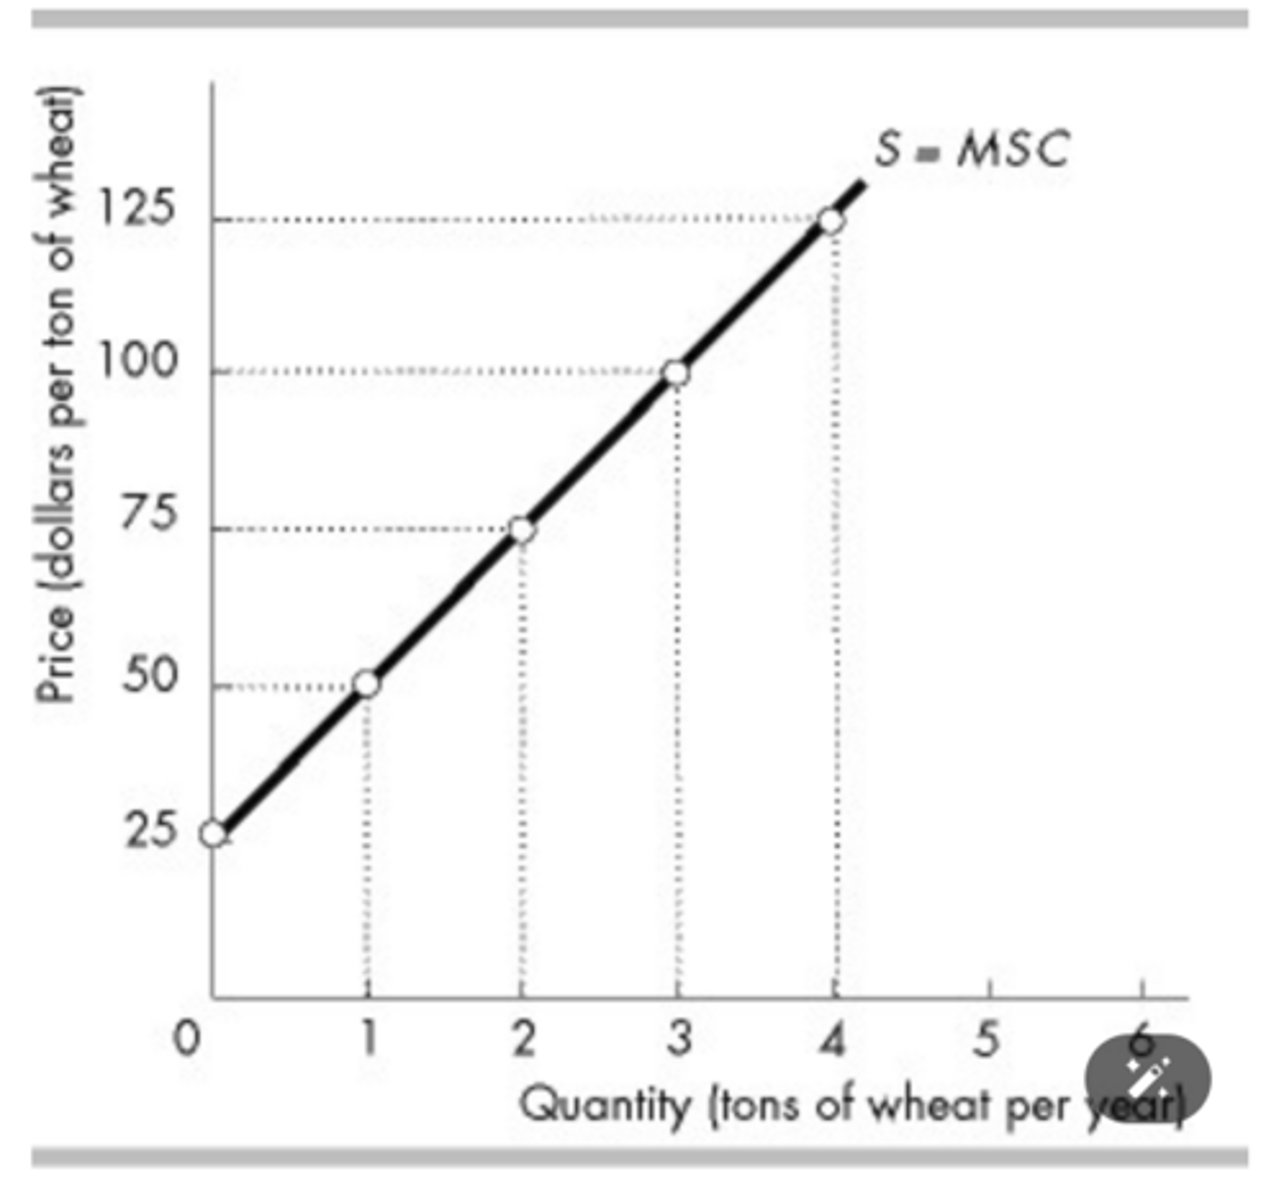
In the above figure, if the market price rises from $100 to $125 per ton of wheat, then producer surplus
increases
The figure above shows Clara's demand for pizza. If the price of a pizza is $15, then Clara
receives no consumer surplus on the 6th pizza she buys.
In the above figure, if the price is $2, then the total consumer surplus is
triangle abc.
The figure tells us about the market for red roses. The consumer surplus is ________ a day.
$200
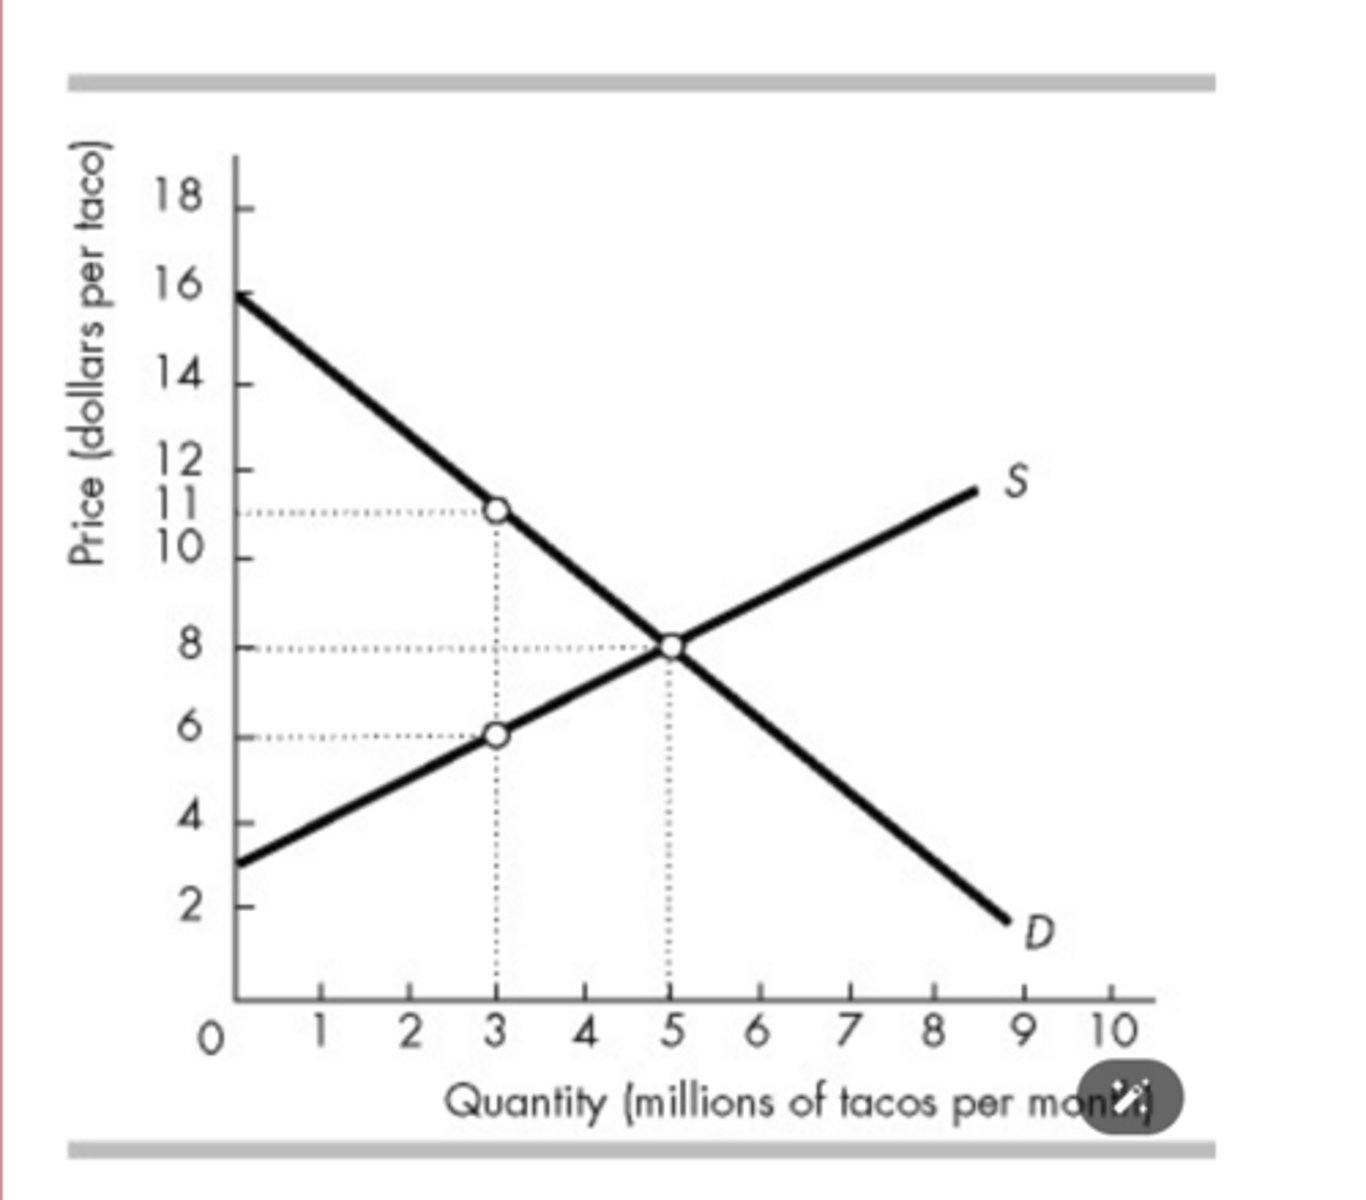
In the figure above, what is the marginal social benefit of the 3,000,000th taco per month?
$11.00 per taco
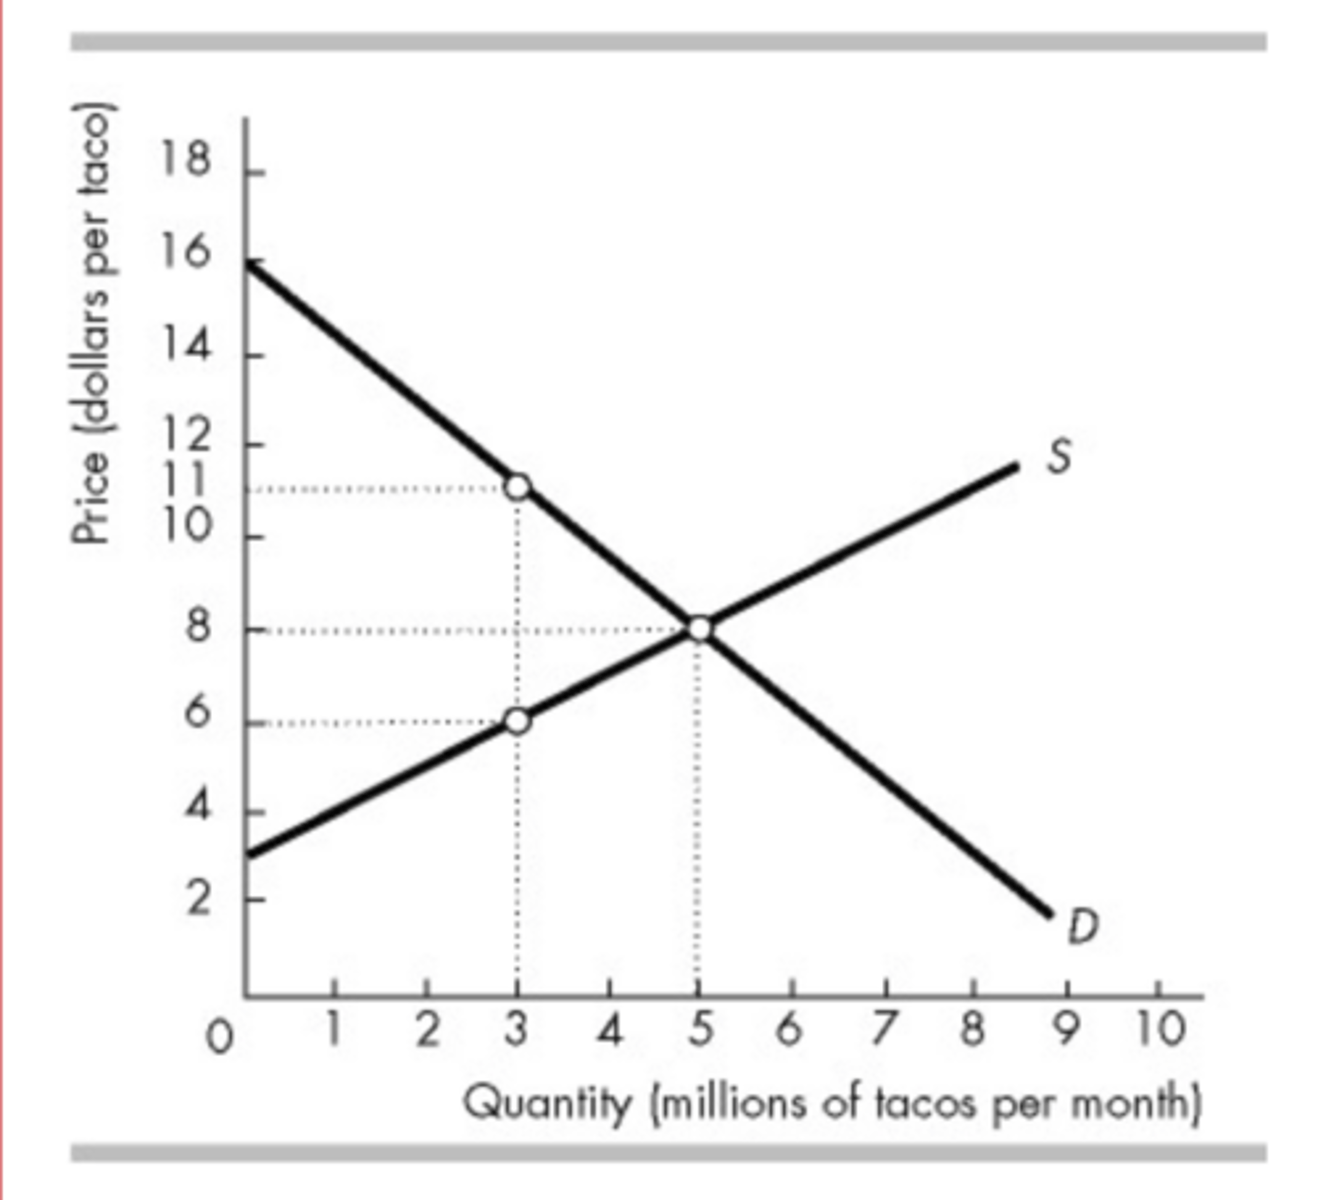
In the figure above, when the market is in equilibrium, total consumer surplus on all the tacos bought will be
$20 million.
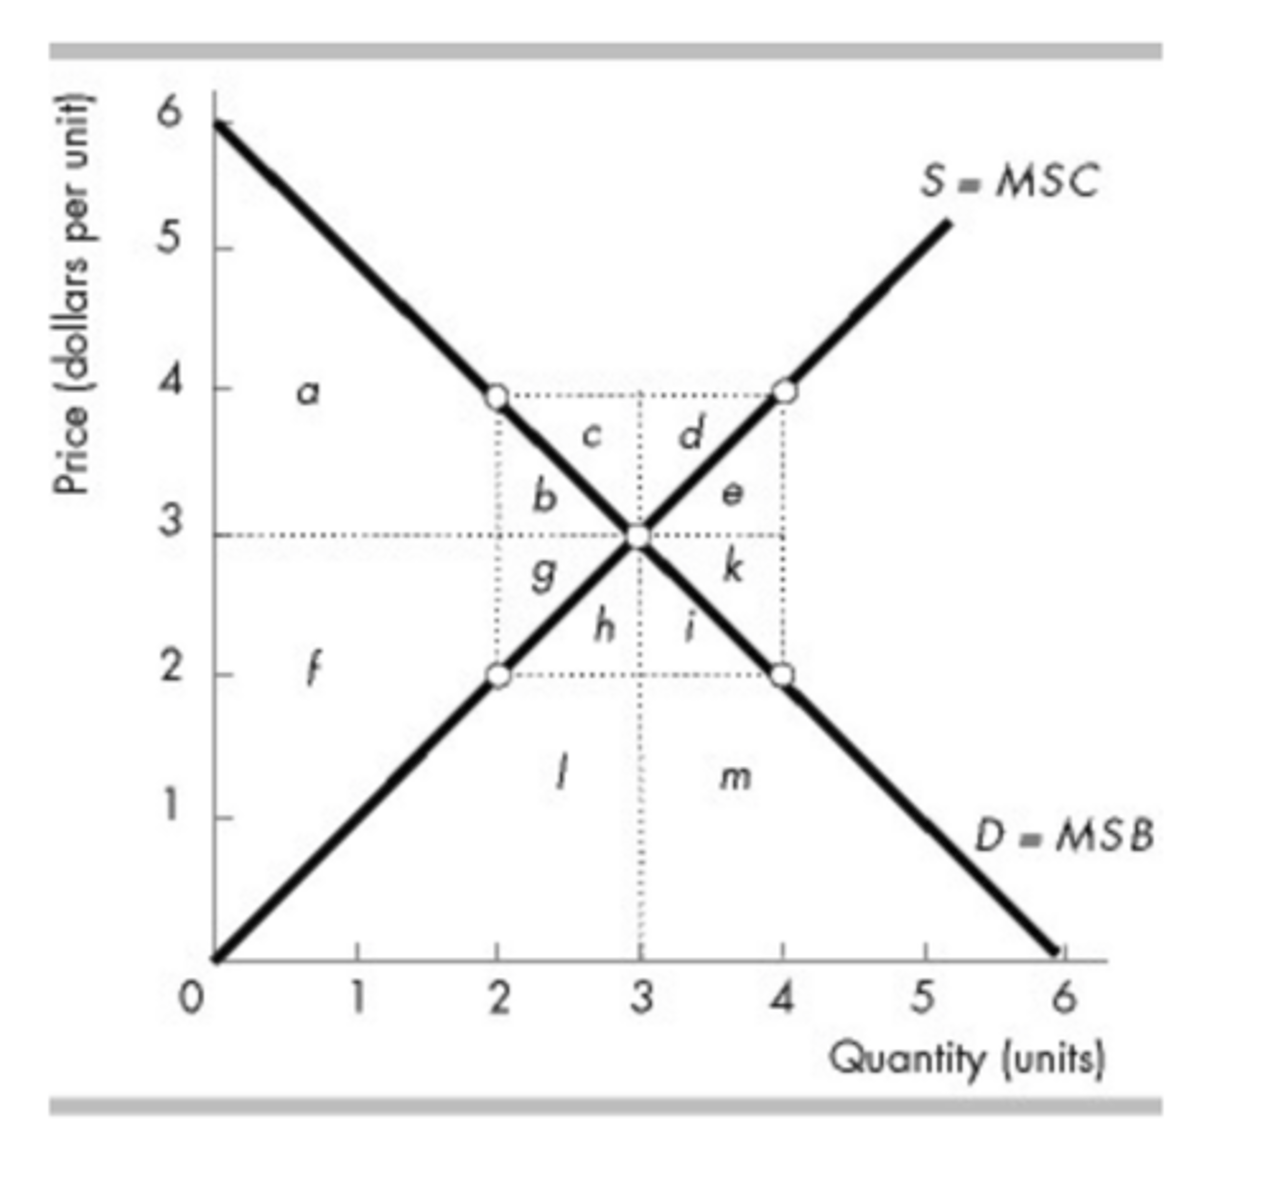
In the figure above, if the quantity is restricted to 2, then the deadweight loss in this market equals
b + g.
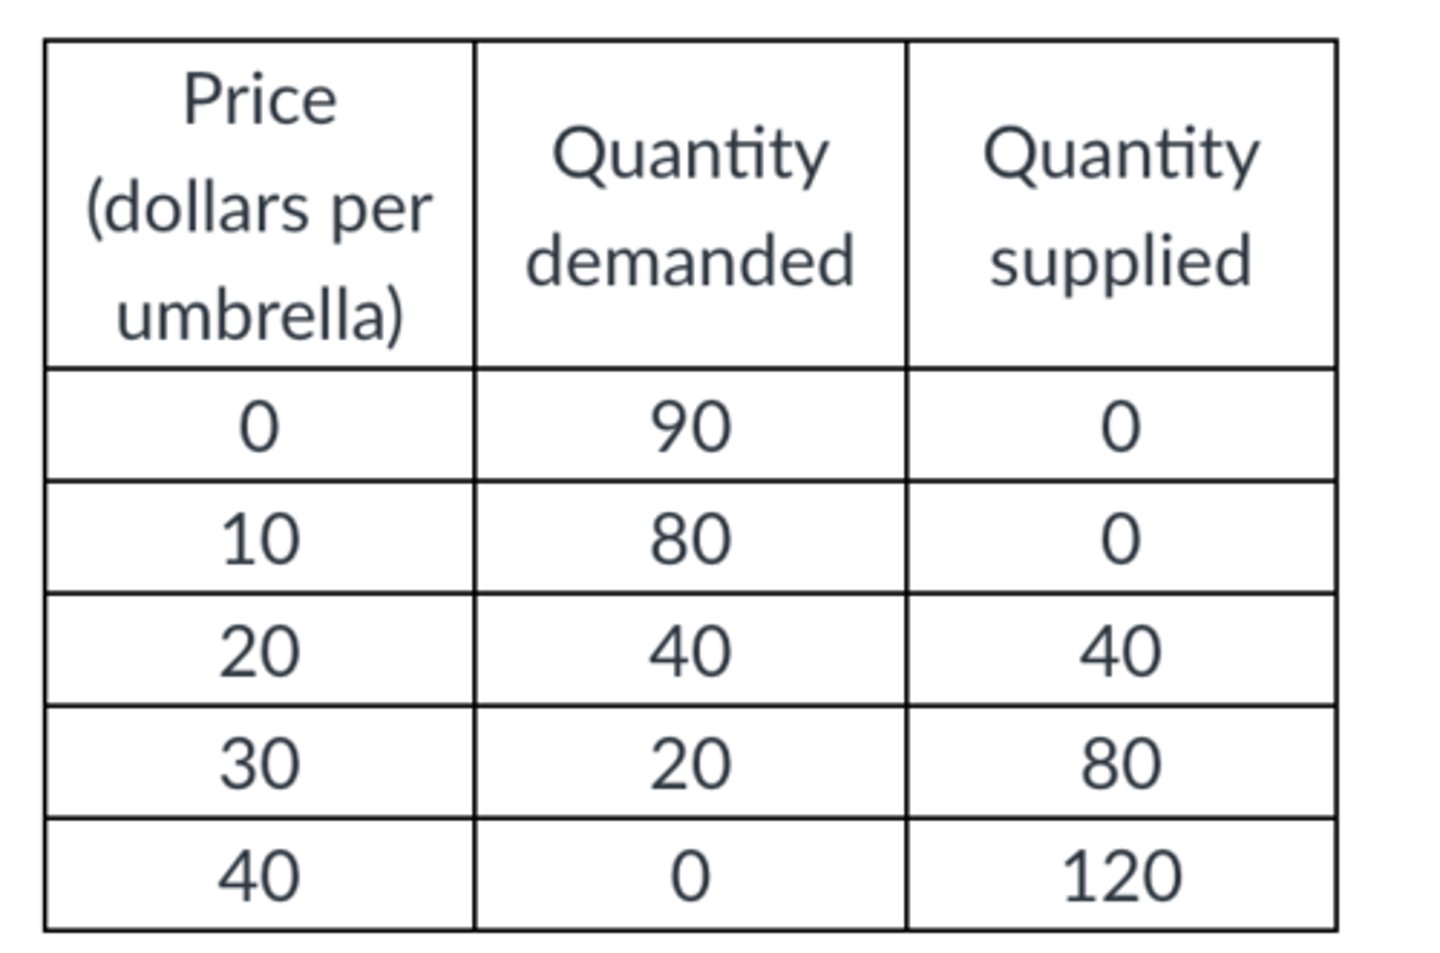
In the table above, if there are 80 umbrellas produced, the deadweight loss from the 80th umbrella is
$20
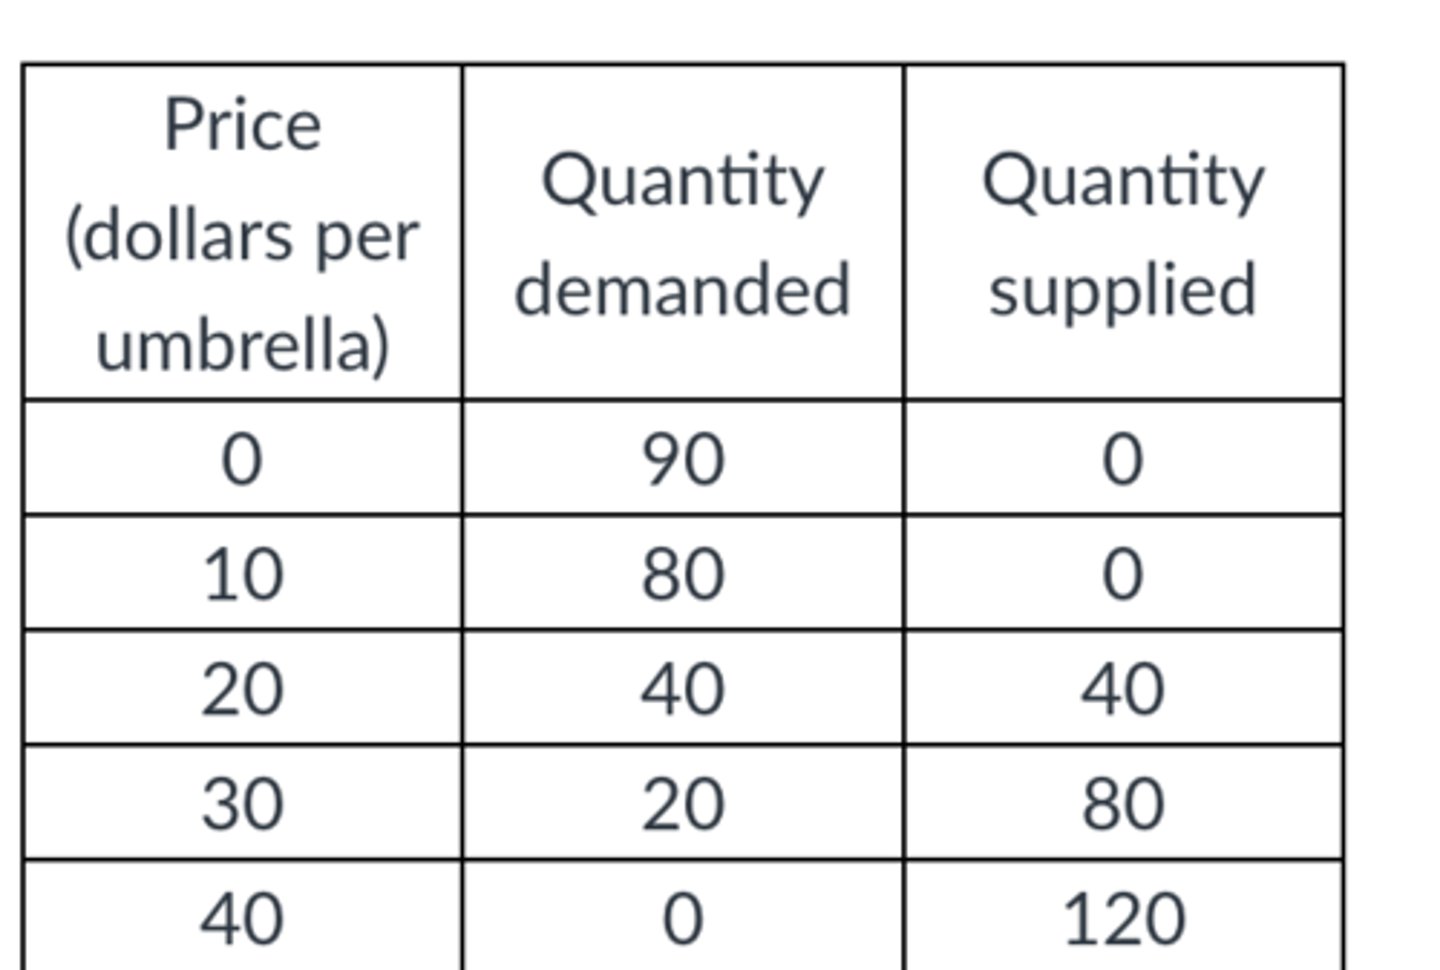
In the table above, the deadweight loss is zero when ________ umbrellas are produced and sold.
40
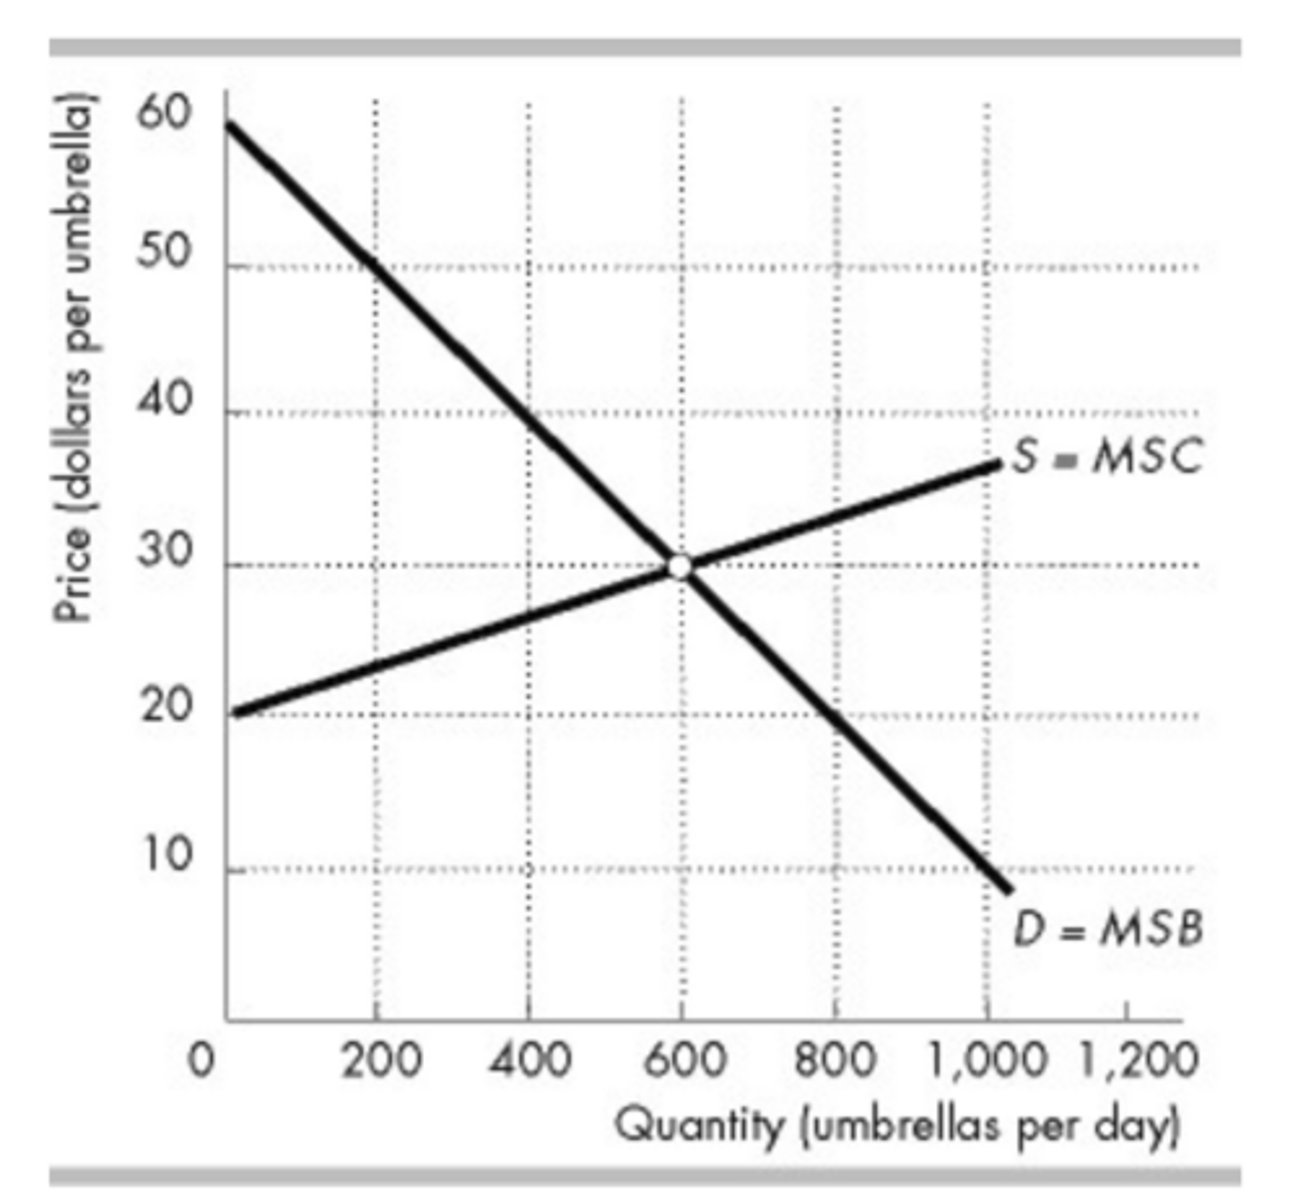
The figure above shows the market for umbrellas in Sunville. What is the marginal social benefit that Sunville consumers receive from the 200th umbrella bought?
$50.00
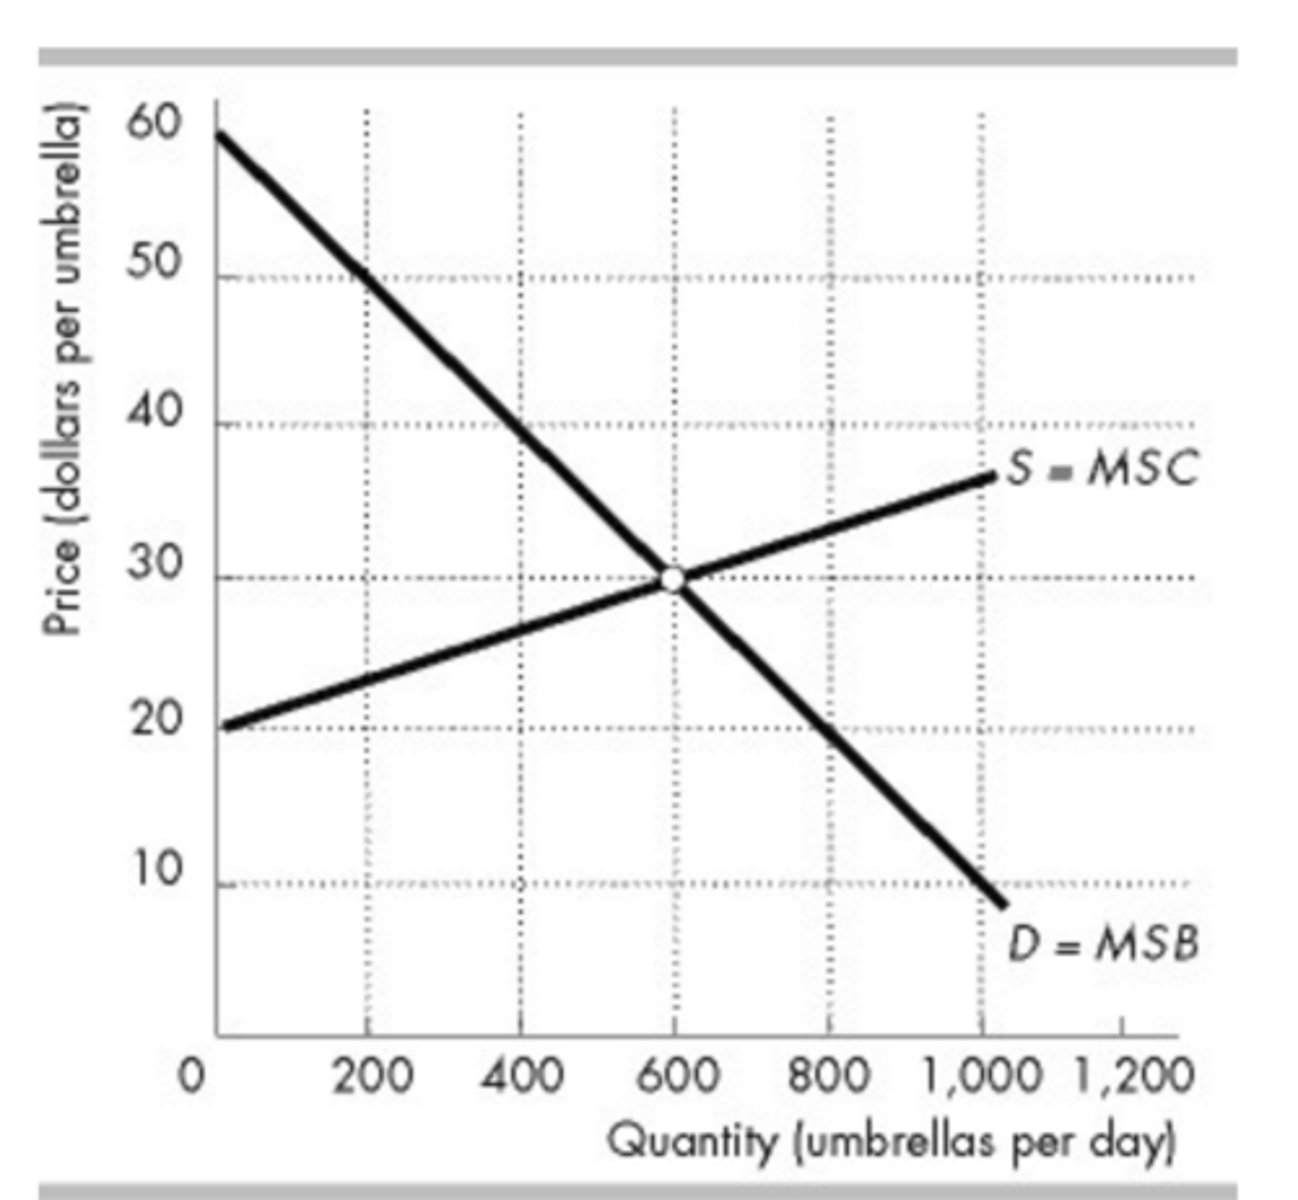
The figure above shows the market for umbrellas in Sunville. When the market for umbrellas in Sunville is in equilibrium, what is the total deadweight loss?
$0
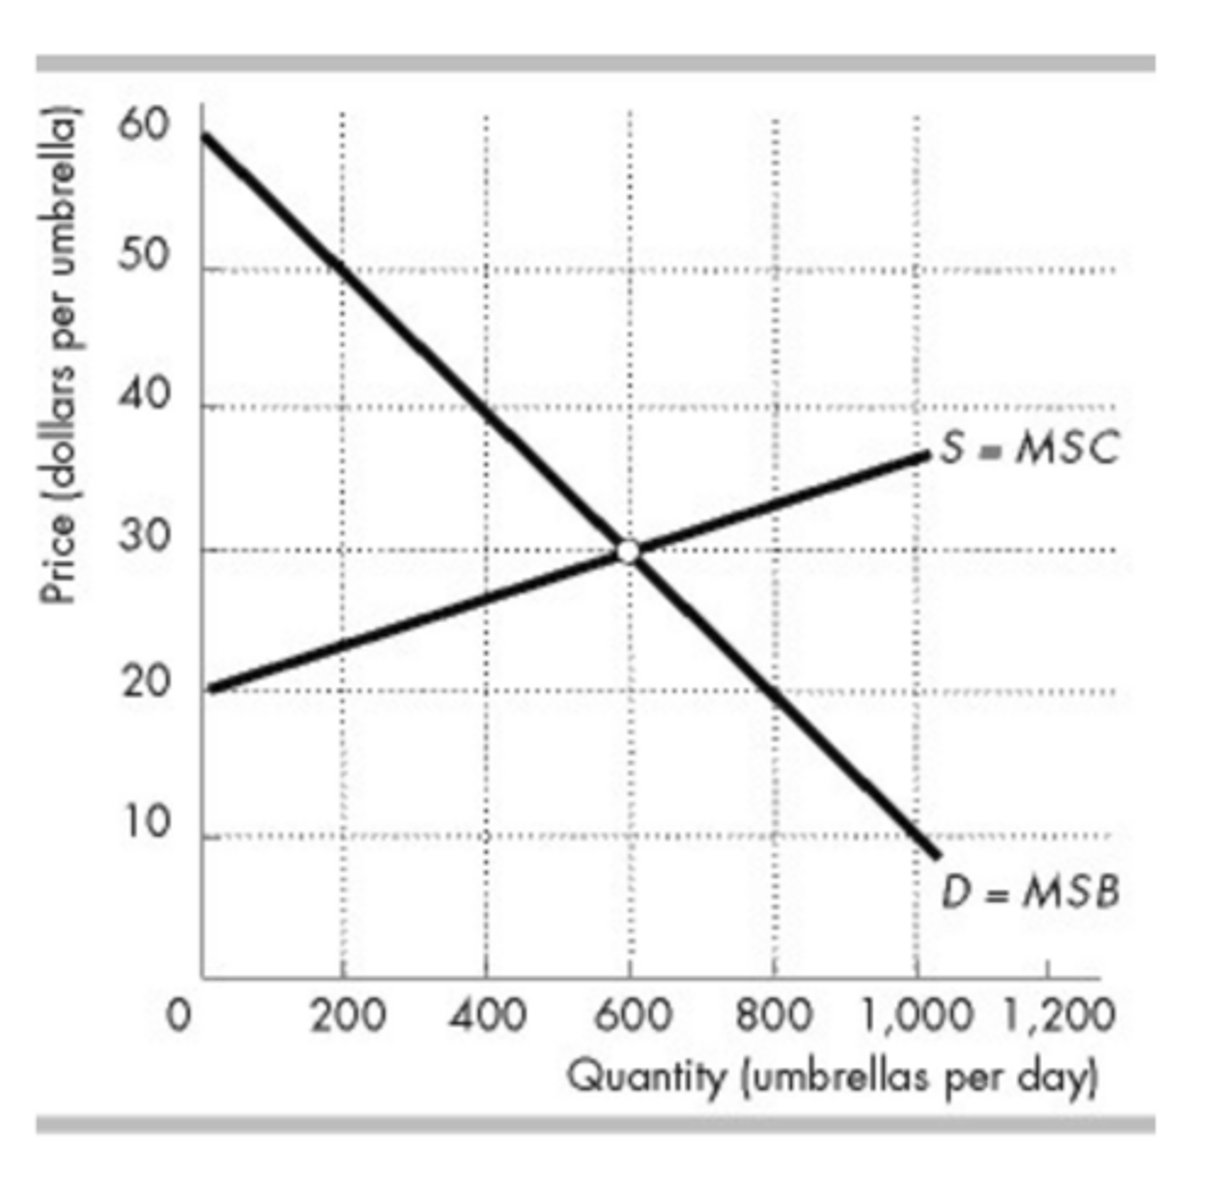
The figure above shows the market for umbrellas in Sunville. When the market for umbrellas in Sunville is in equilibrium, what is the producer surplus?
$3,000
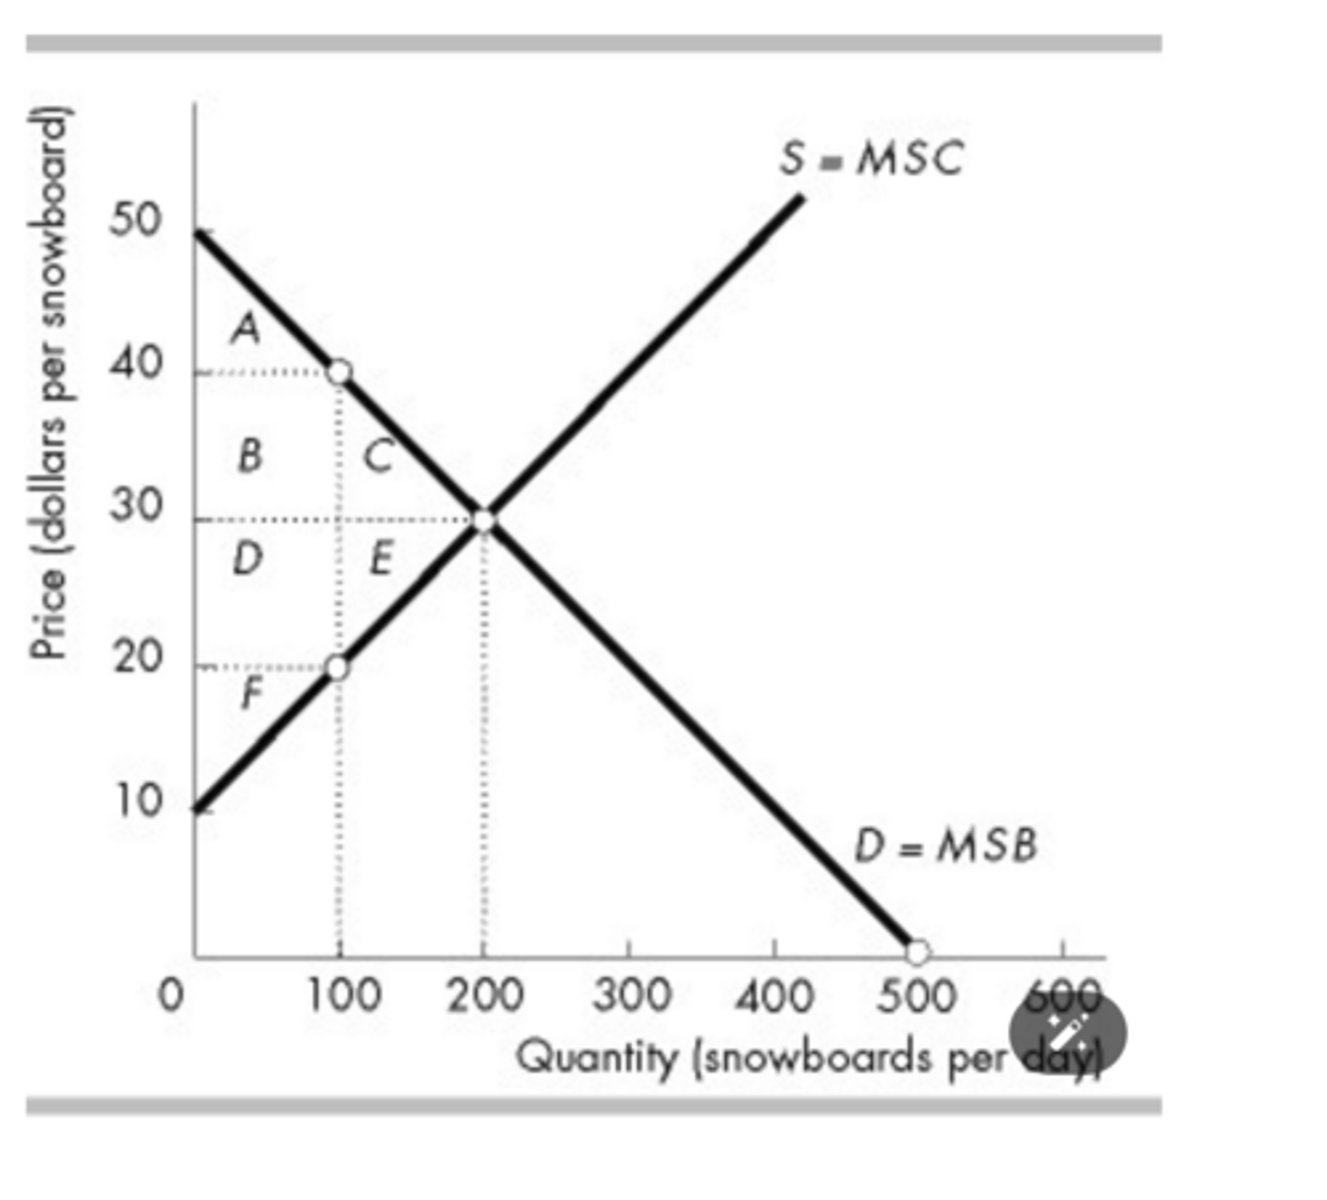
What area in the above figure is the consumer surplus at the efficient quantity?
A + B + C
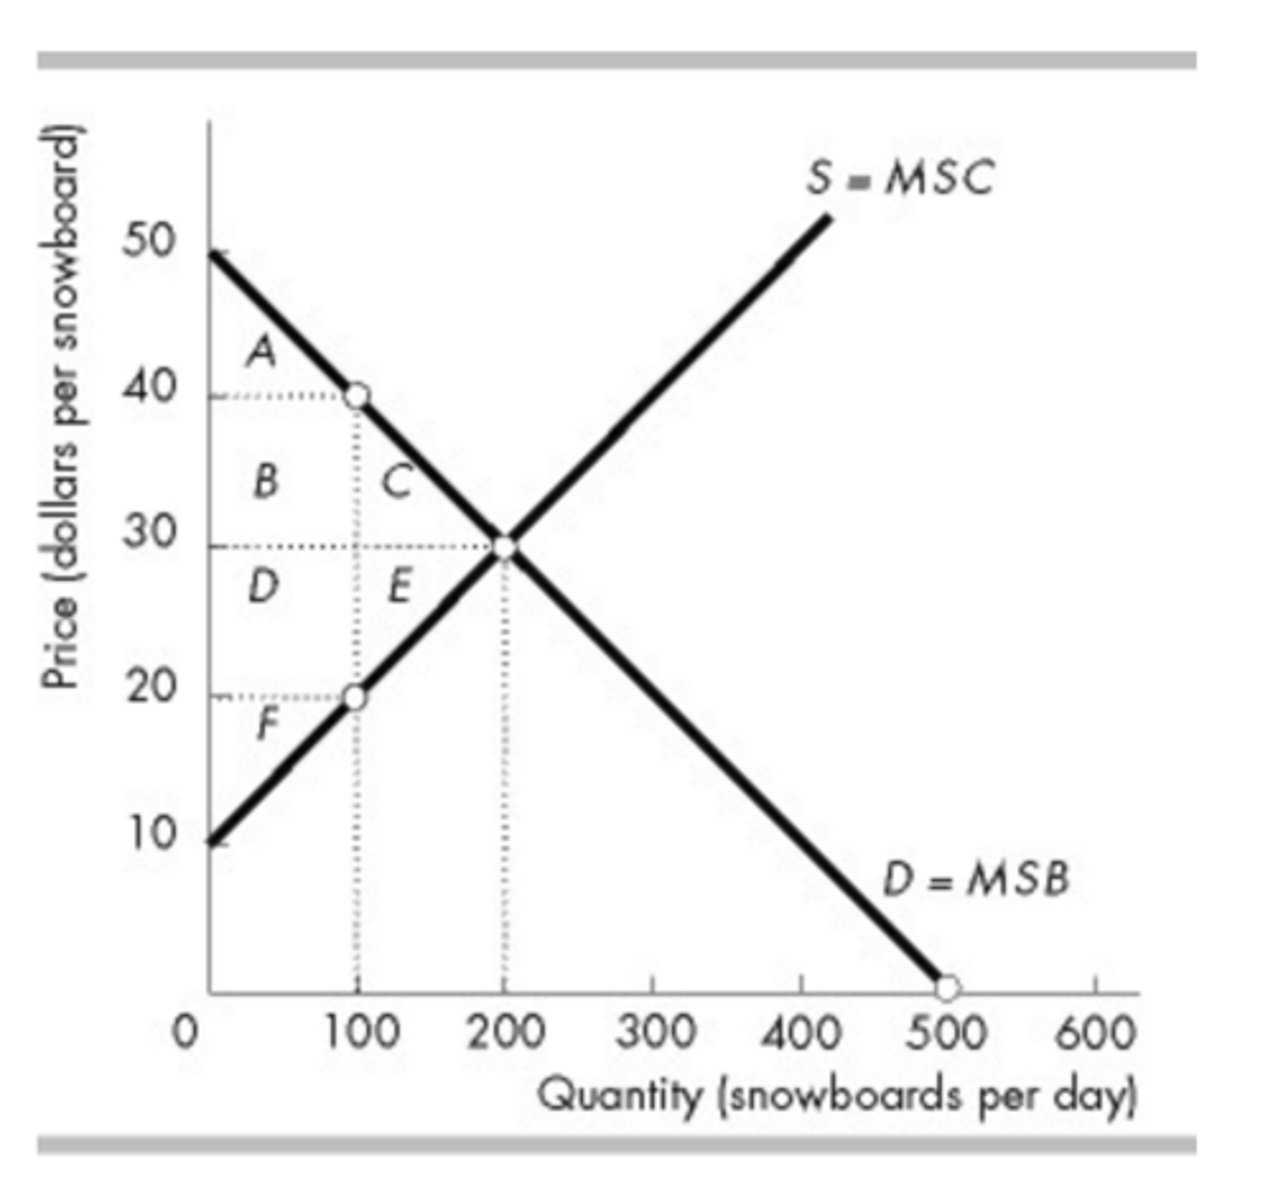
In the above figure, what is the amount of consumer surplus at the efficient quantity?
$2,000
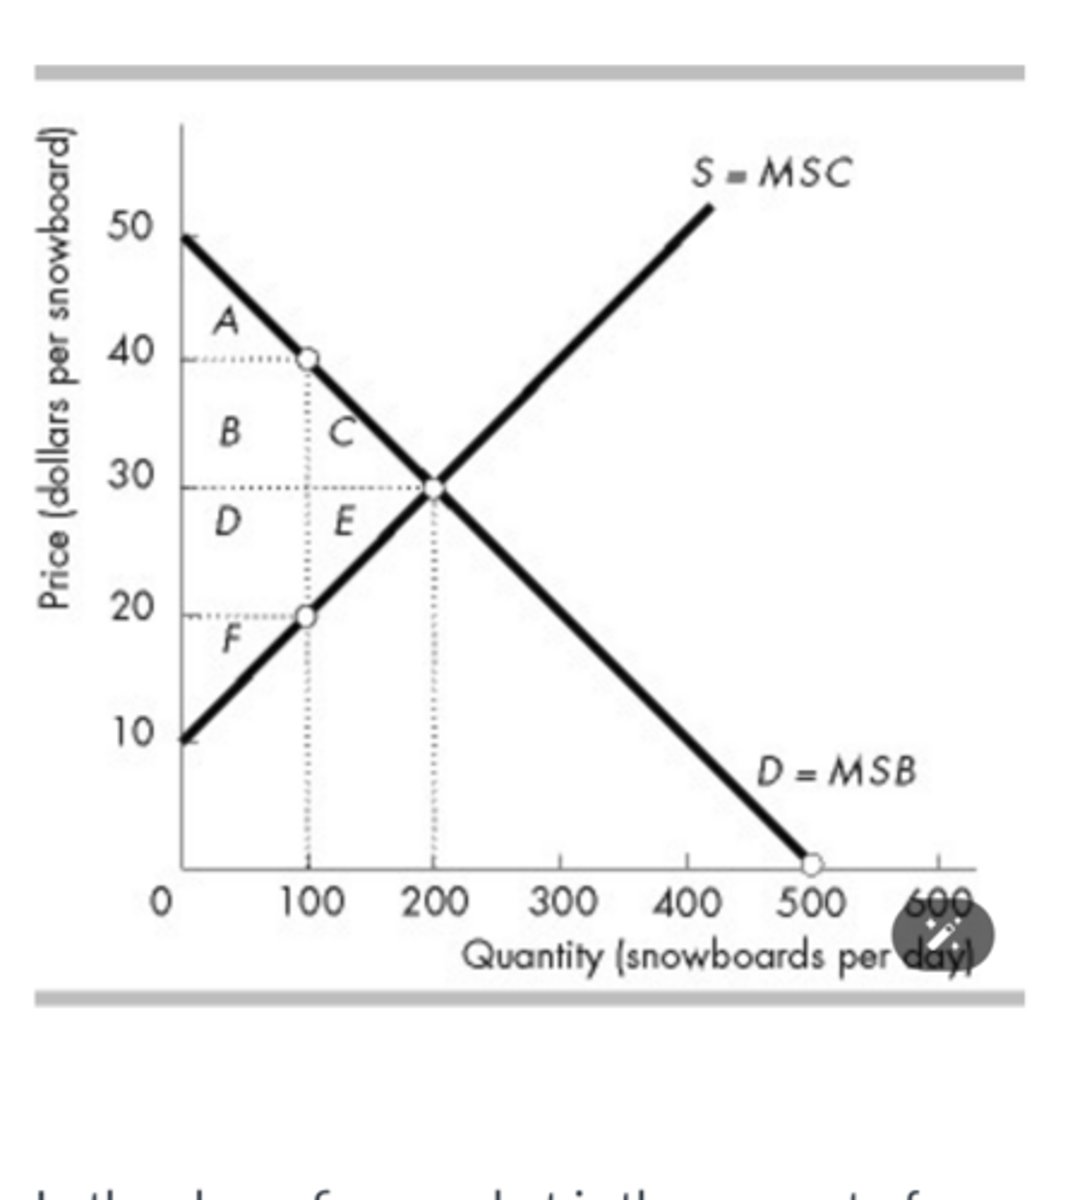
What area in the above figure is the producer surplus at the efficient quantity?
D + E + F
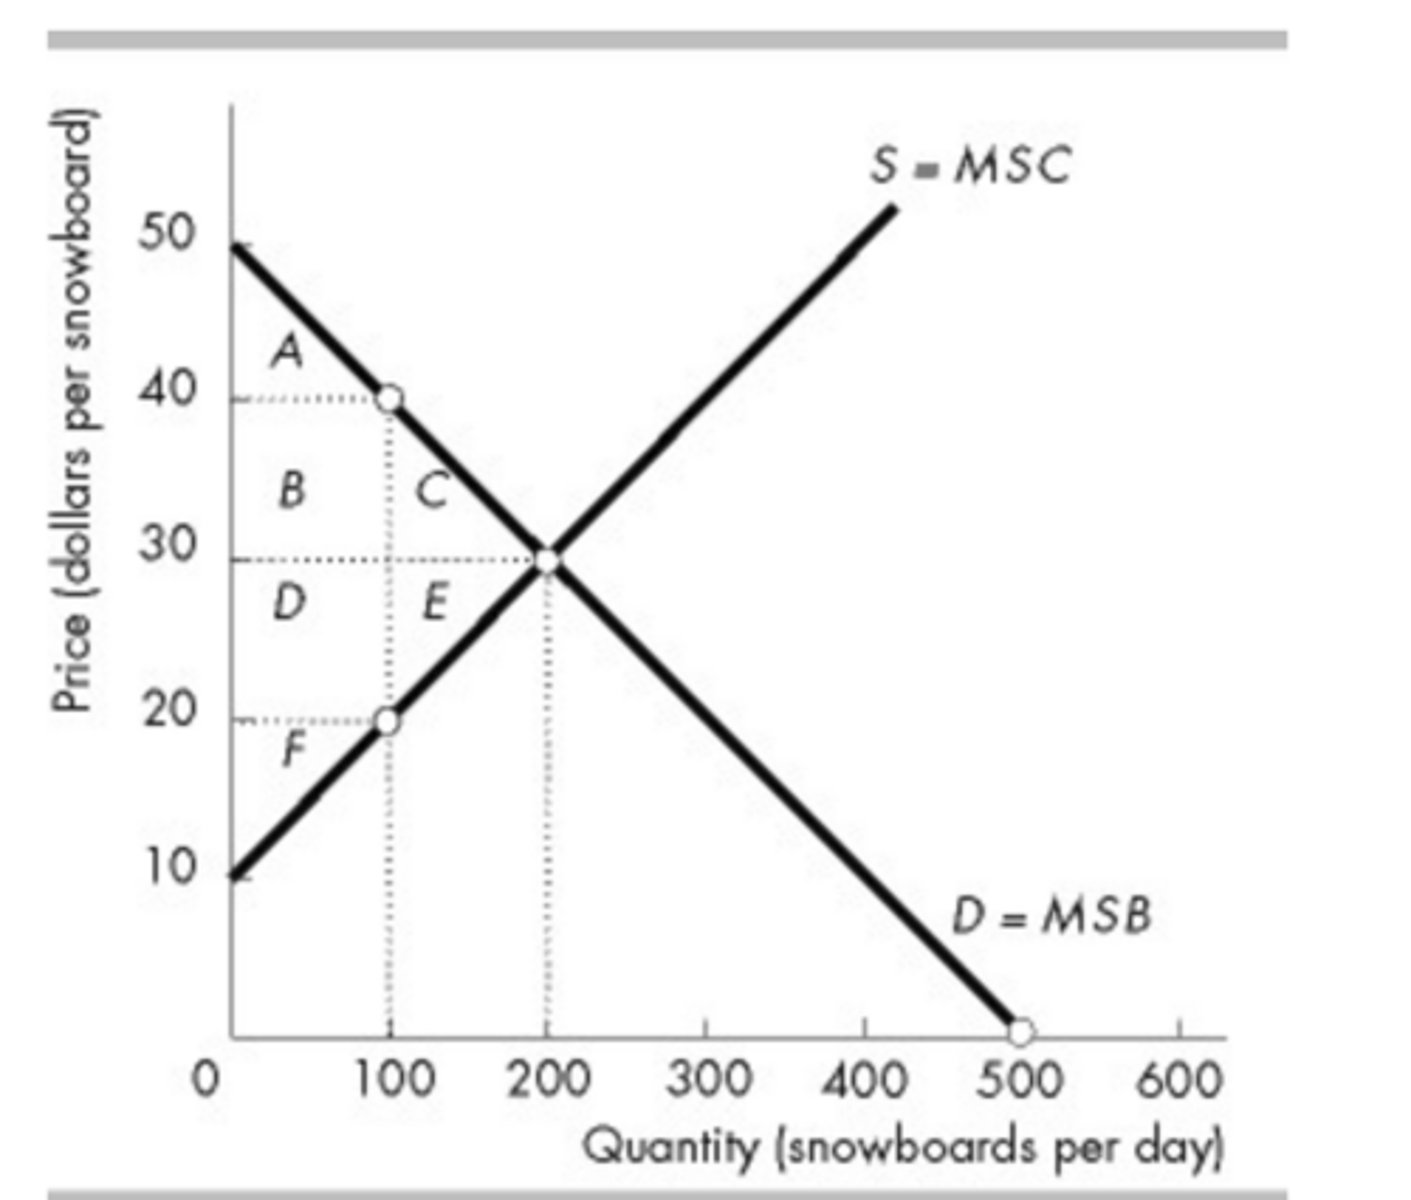
Which area in the above figure is the deadweight loss if 100 snowboards are produced?
C + E
The figure above shows the market for milk. If 100 gallons of milk a day are available, the ________ price that consumers are willing to pay for the last gallon is ________.
maximum; $4.00
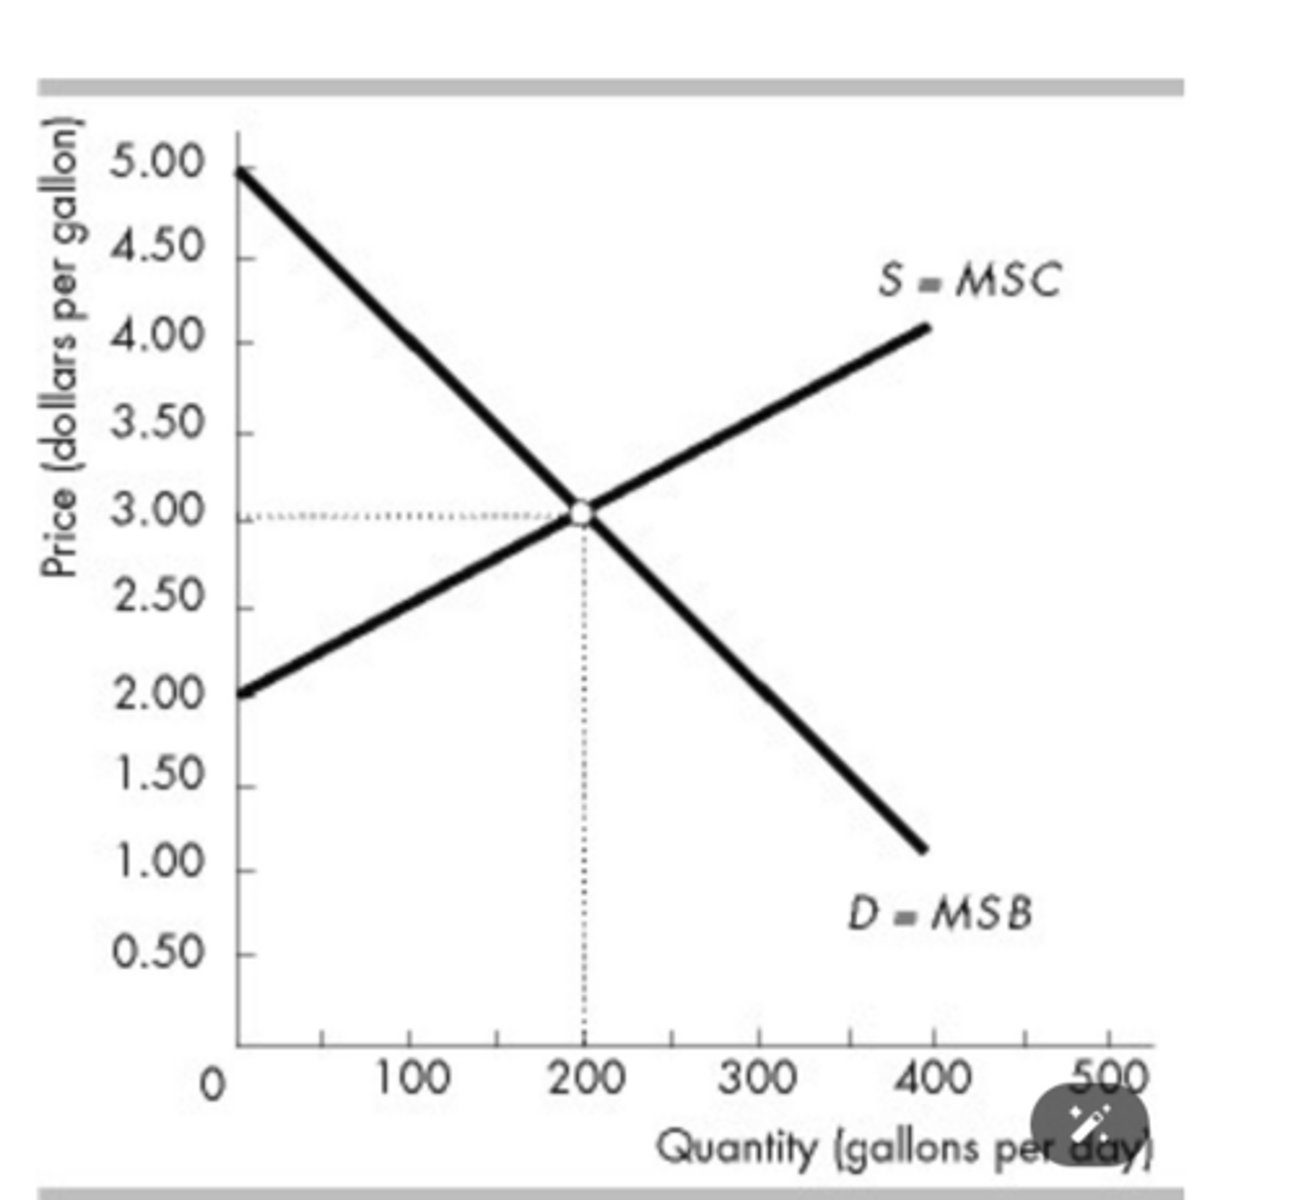
The figure above shows the market for milk. The ________ price that producers must be offered to get them to produce 100 gallons of milk per day is ________.
minimum; $2.50
The figure above shows the market for milk. When the efficient quantity of milk is produced, the marginal social benefit from the last gallon is
$3.00
The figure above shows the market for milk. If a drought lowers the productivity of dairy cows so that they give less milk, then the efficient quantity of milk ________ and the consumer surplus ________.
decreases; decreases
The figure above shows the market for milk. If the population increases, then the efficient quantity of milk ________ and the producer surplus ________.
increases; increases
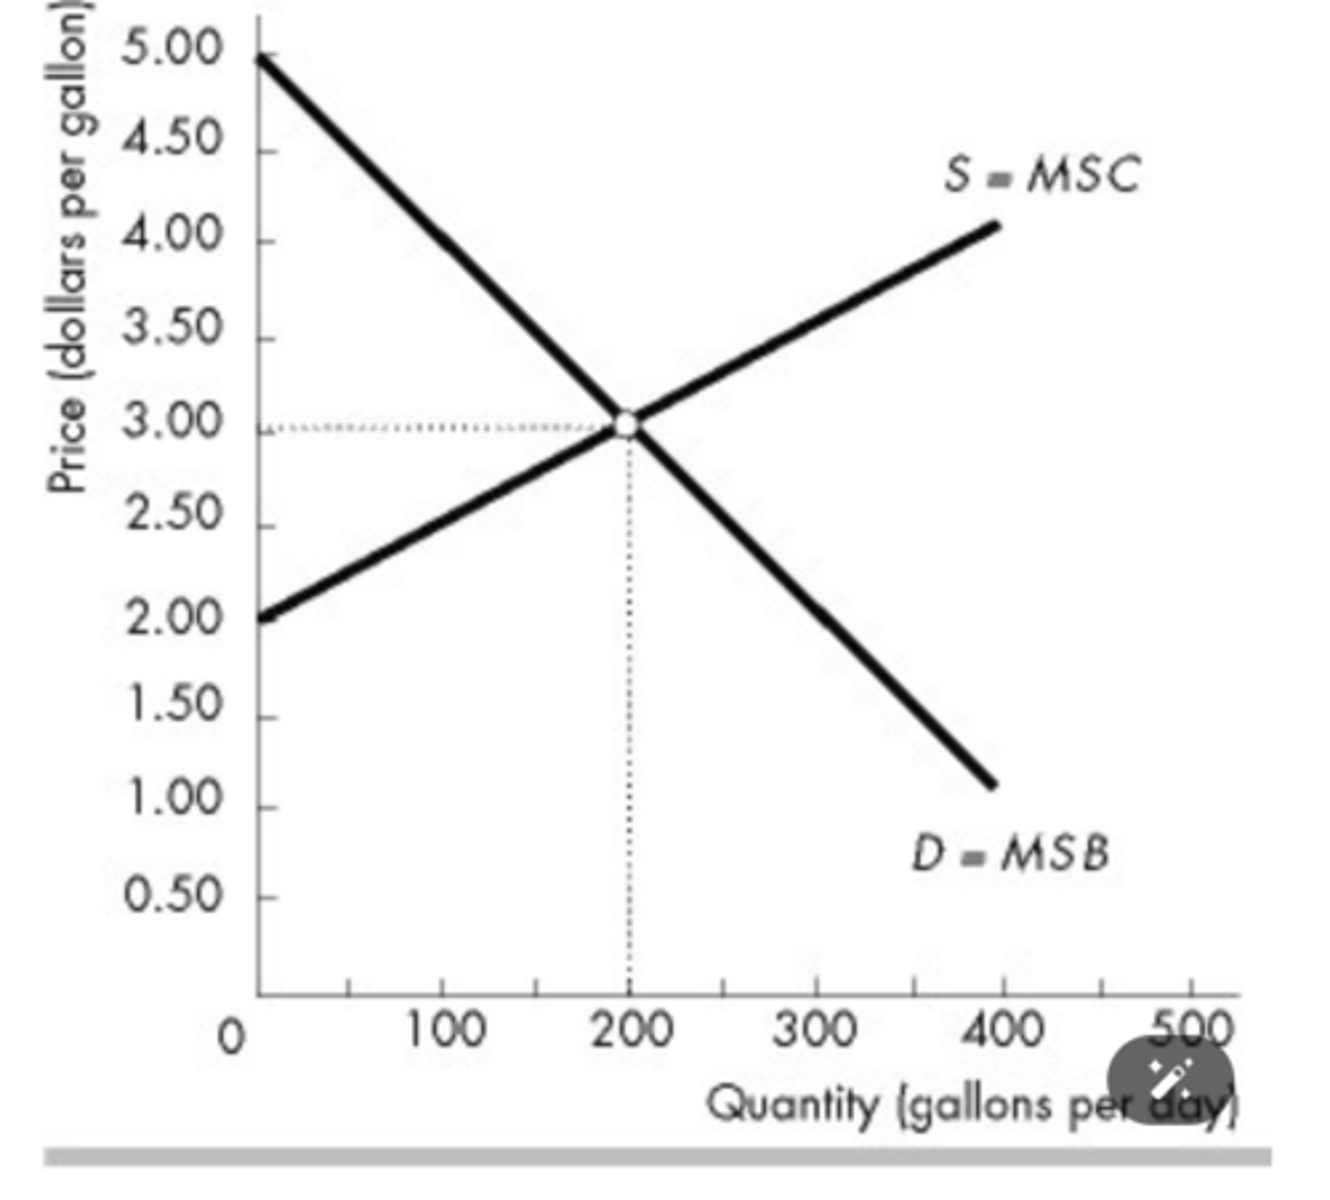
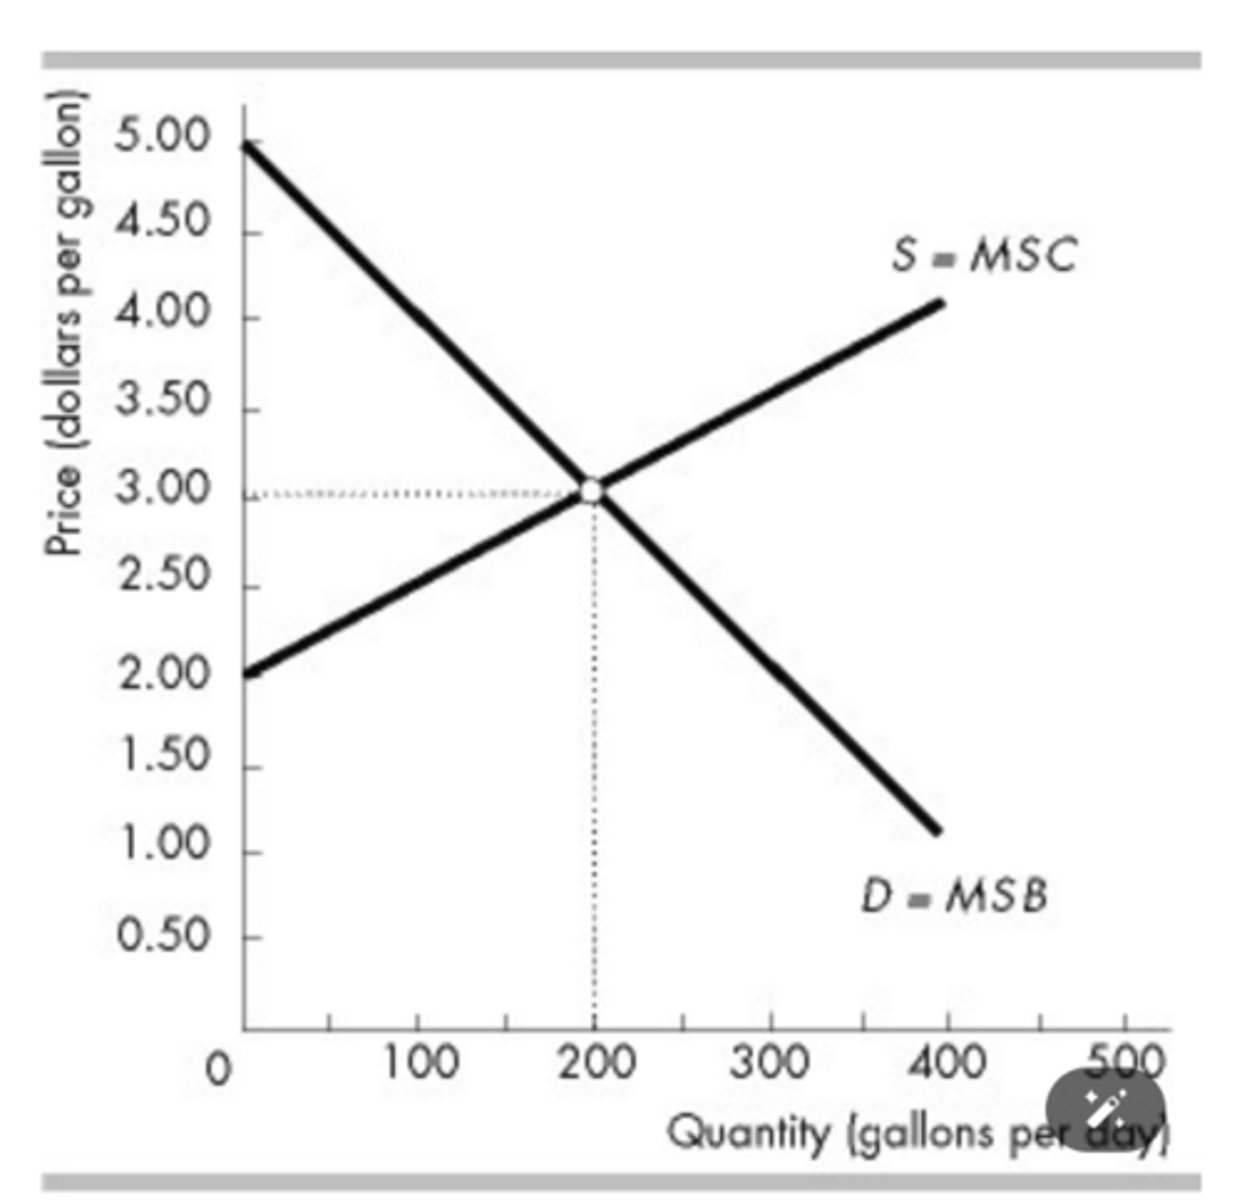
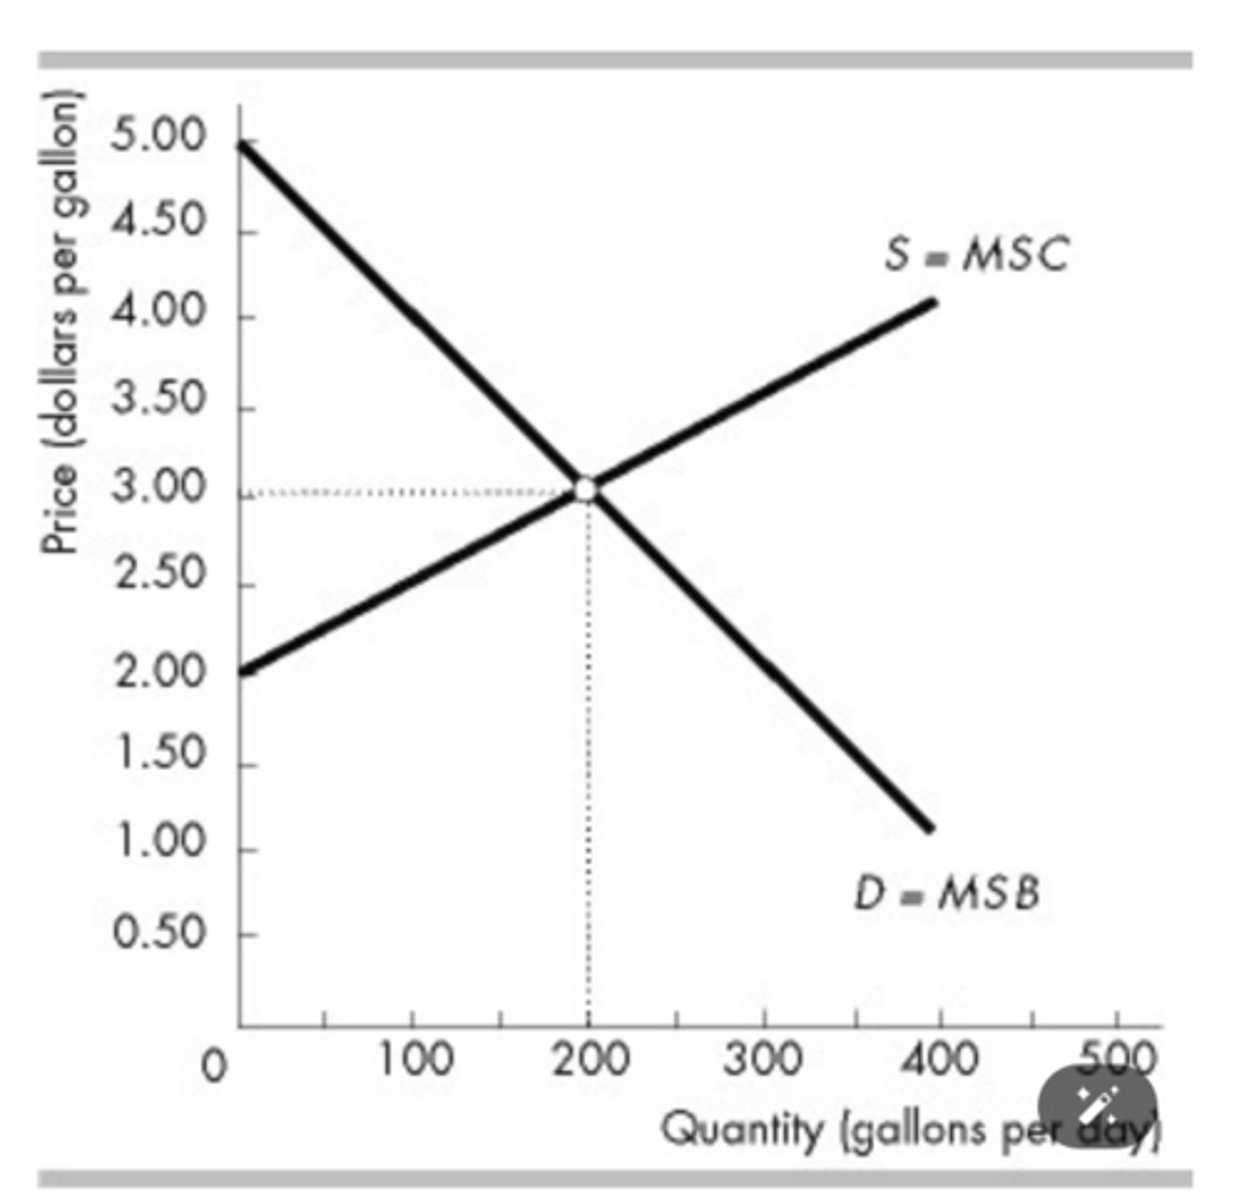
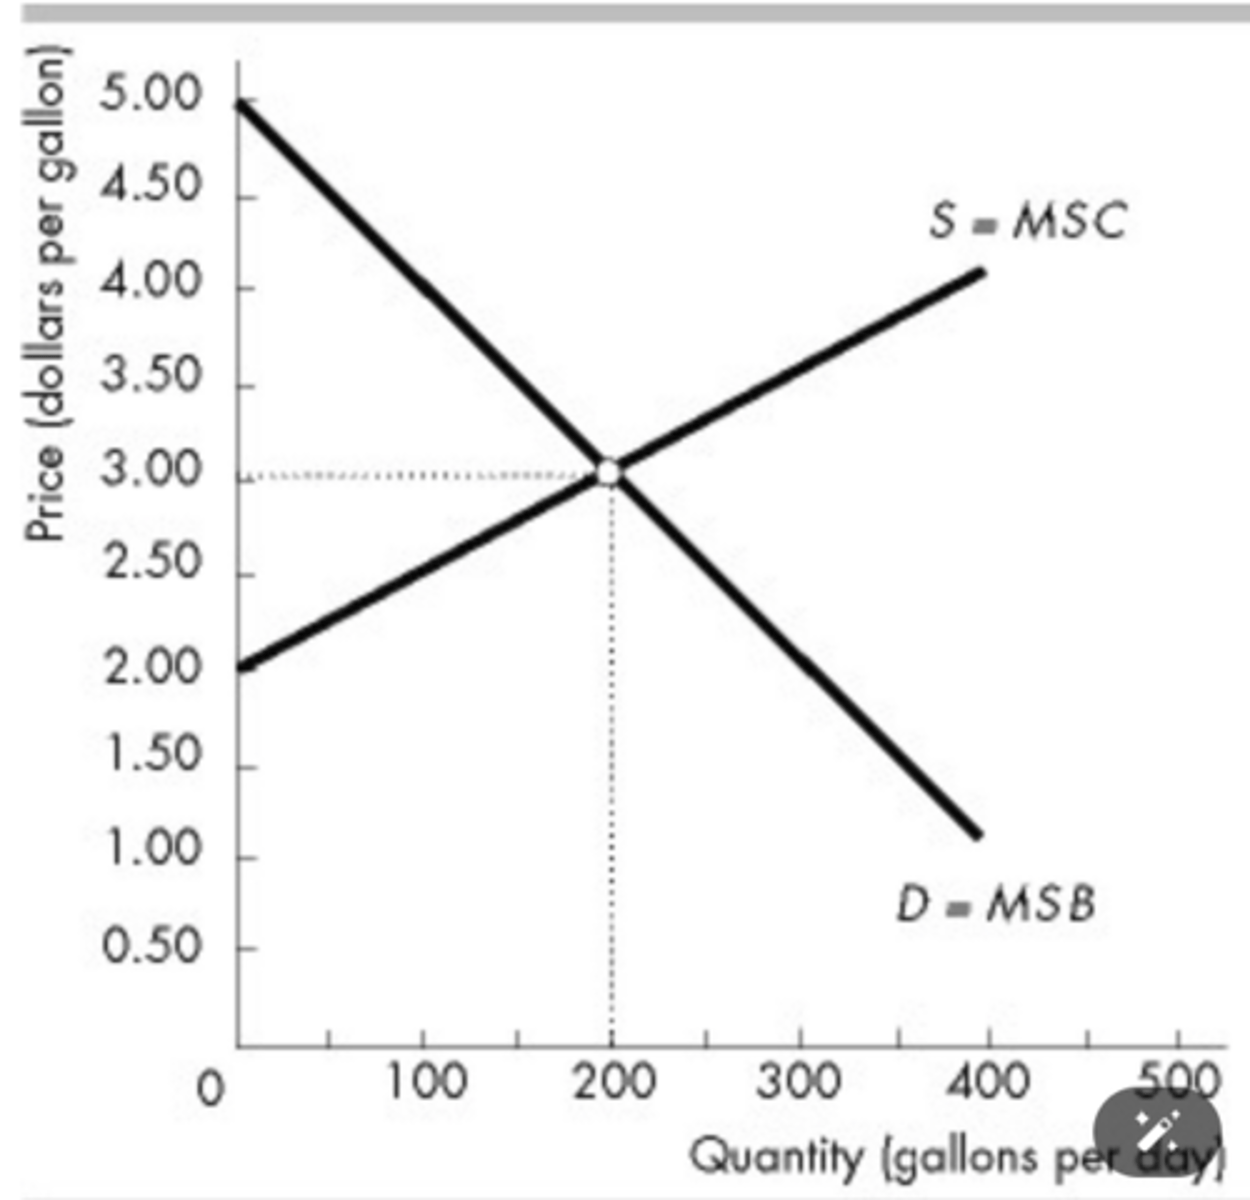
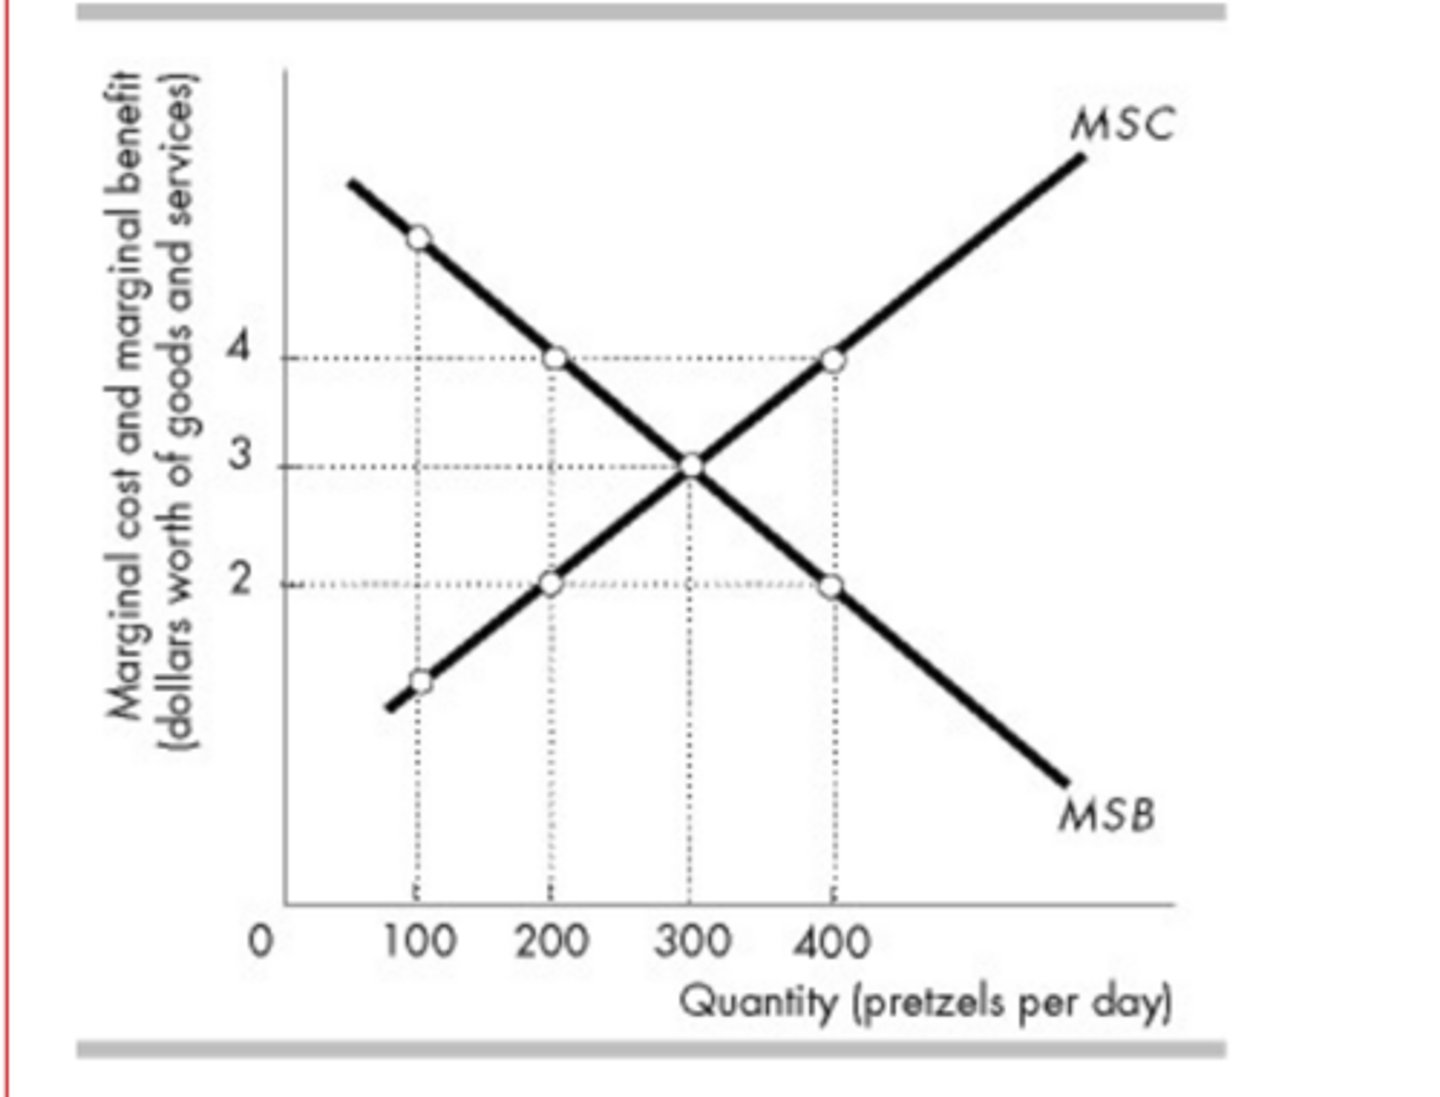
In the above figure, when the quantity equals 400 pretzels
consumers are willing to pay $2 for the 400th pretzel.
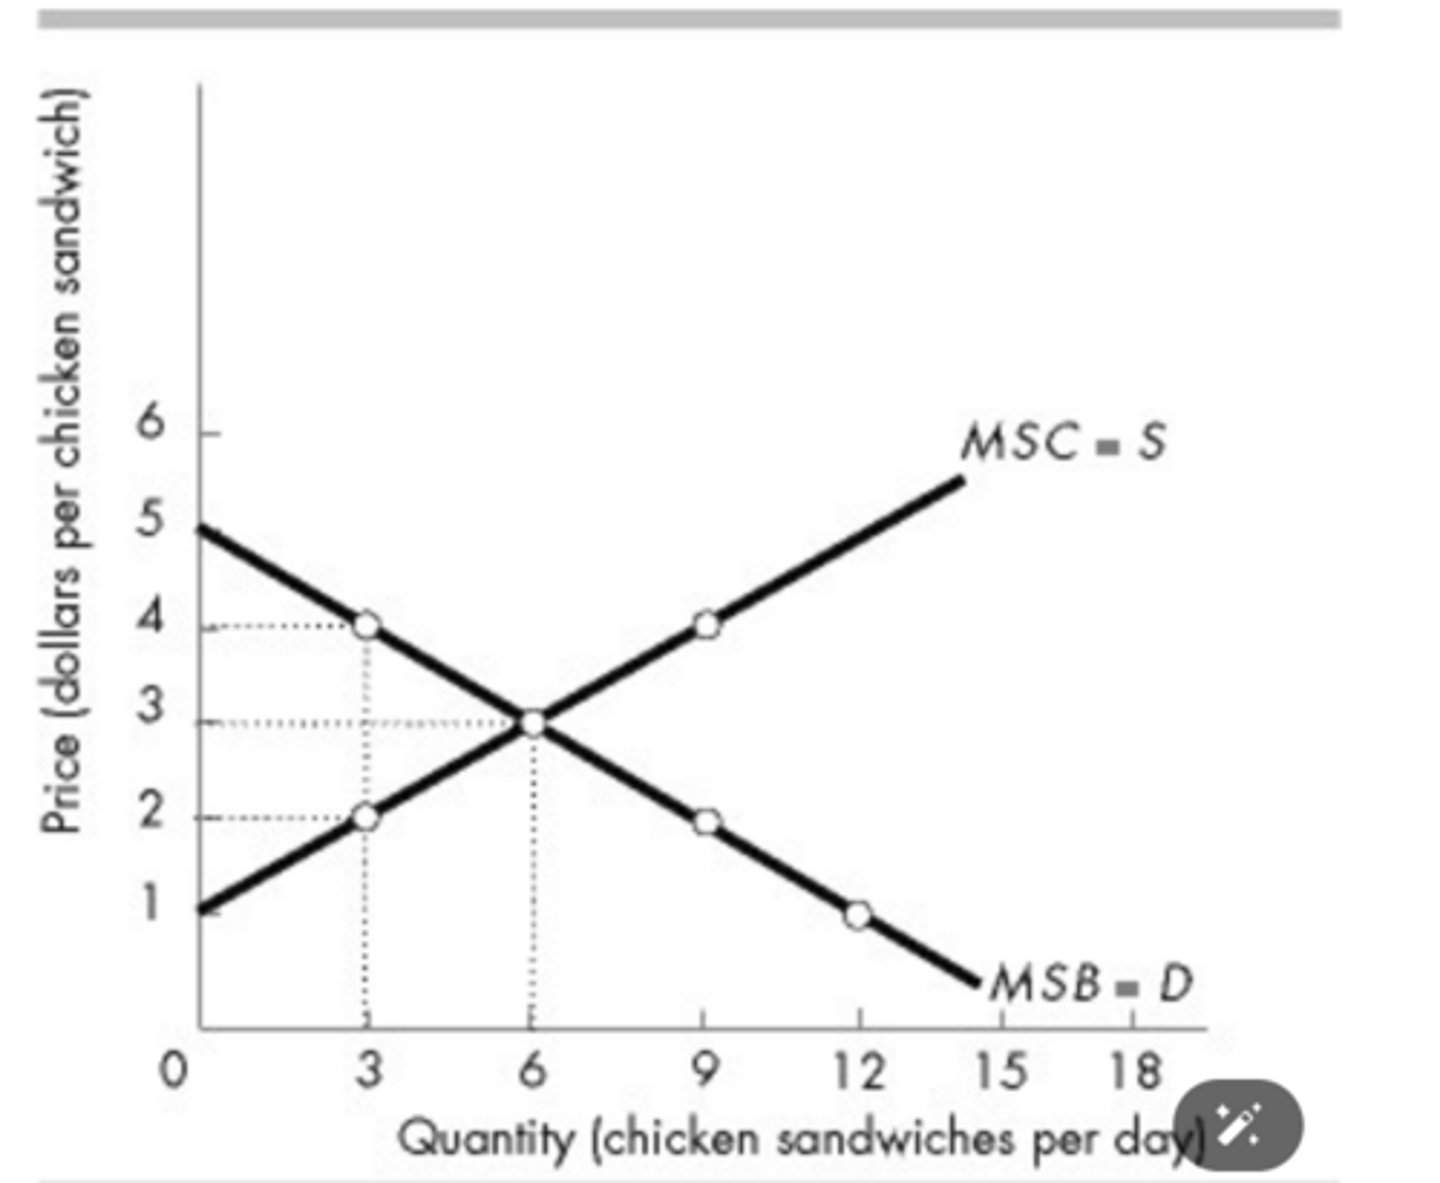
The above figure illustrates the marginal social benefit and marginal social cost for chicken sandwiches. If the quantity is decreased from 6 to 3 and the price increases from $3 to $4, consumer surplus will decrease by
$4.50.
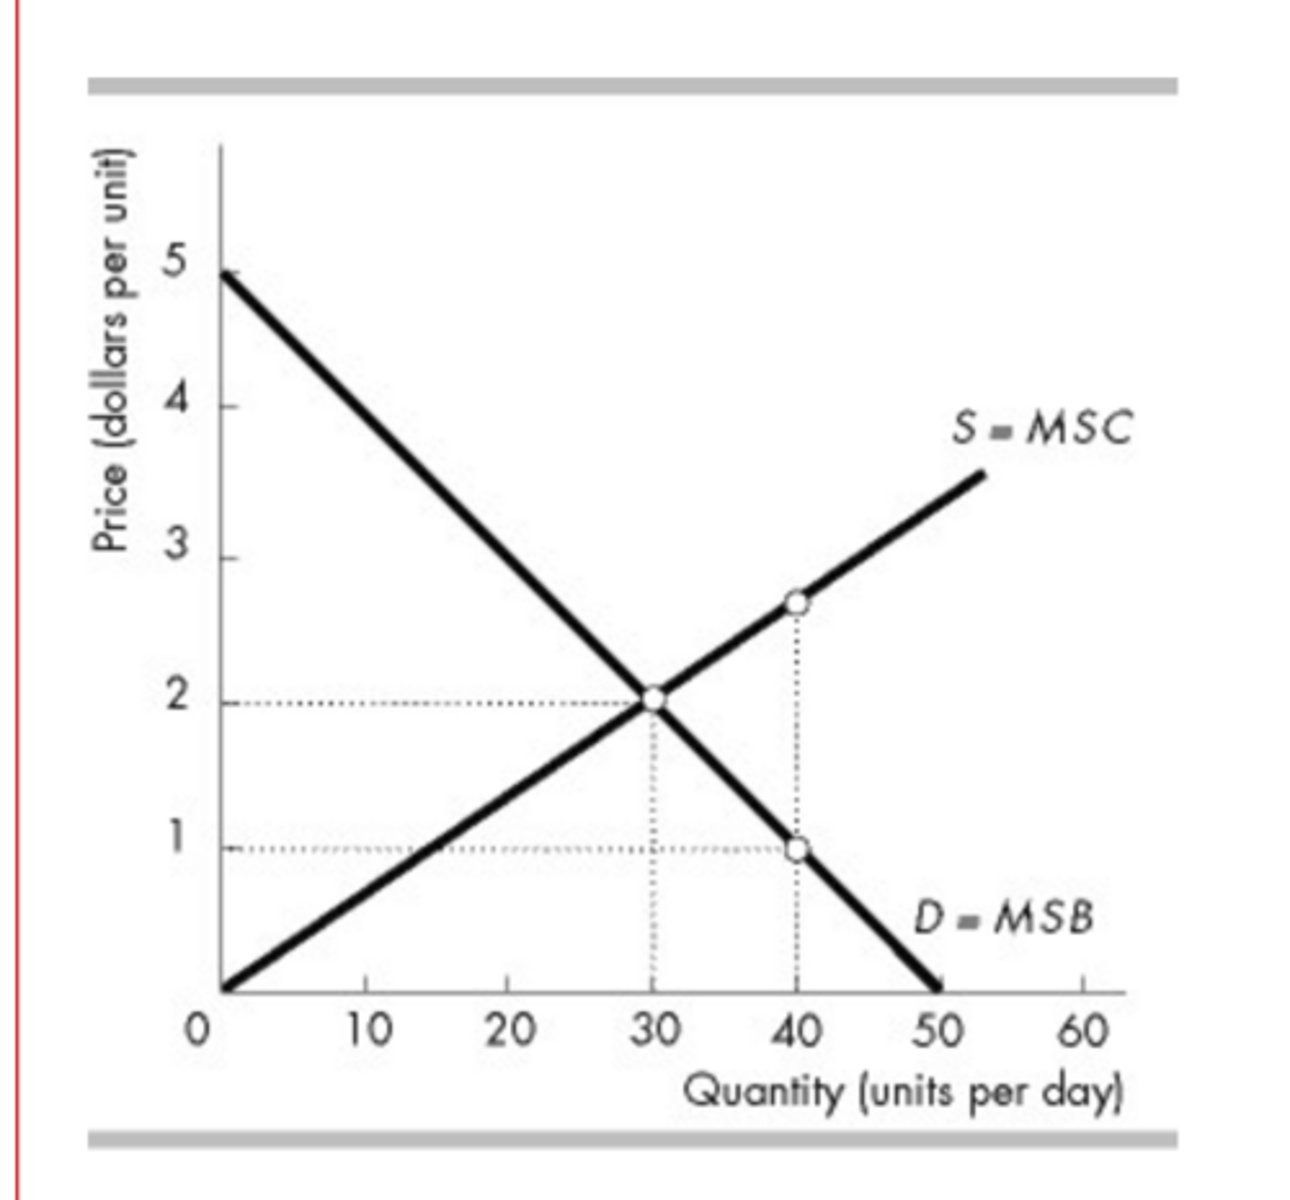
In the above figure, suppose the quantity produced is 40. Then
production is not efficient because MSC>MSB.
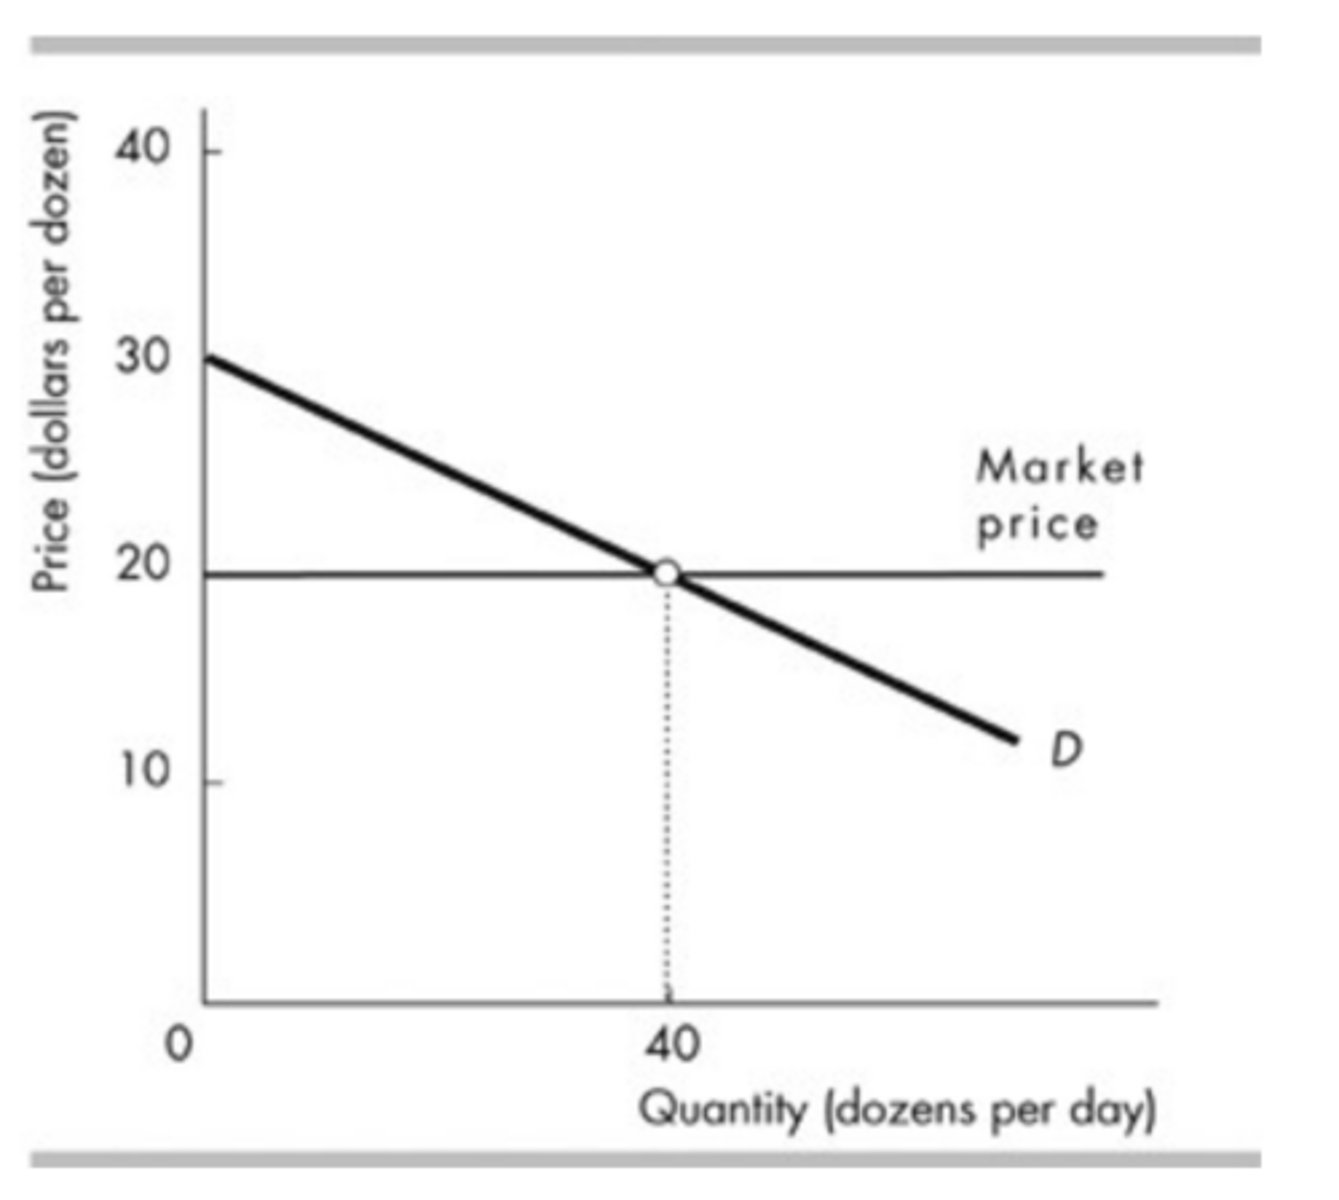
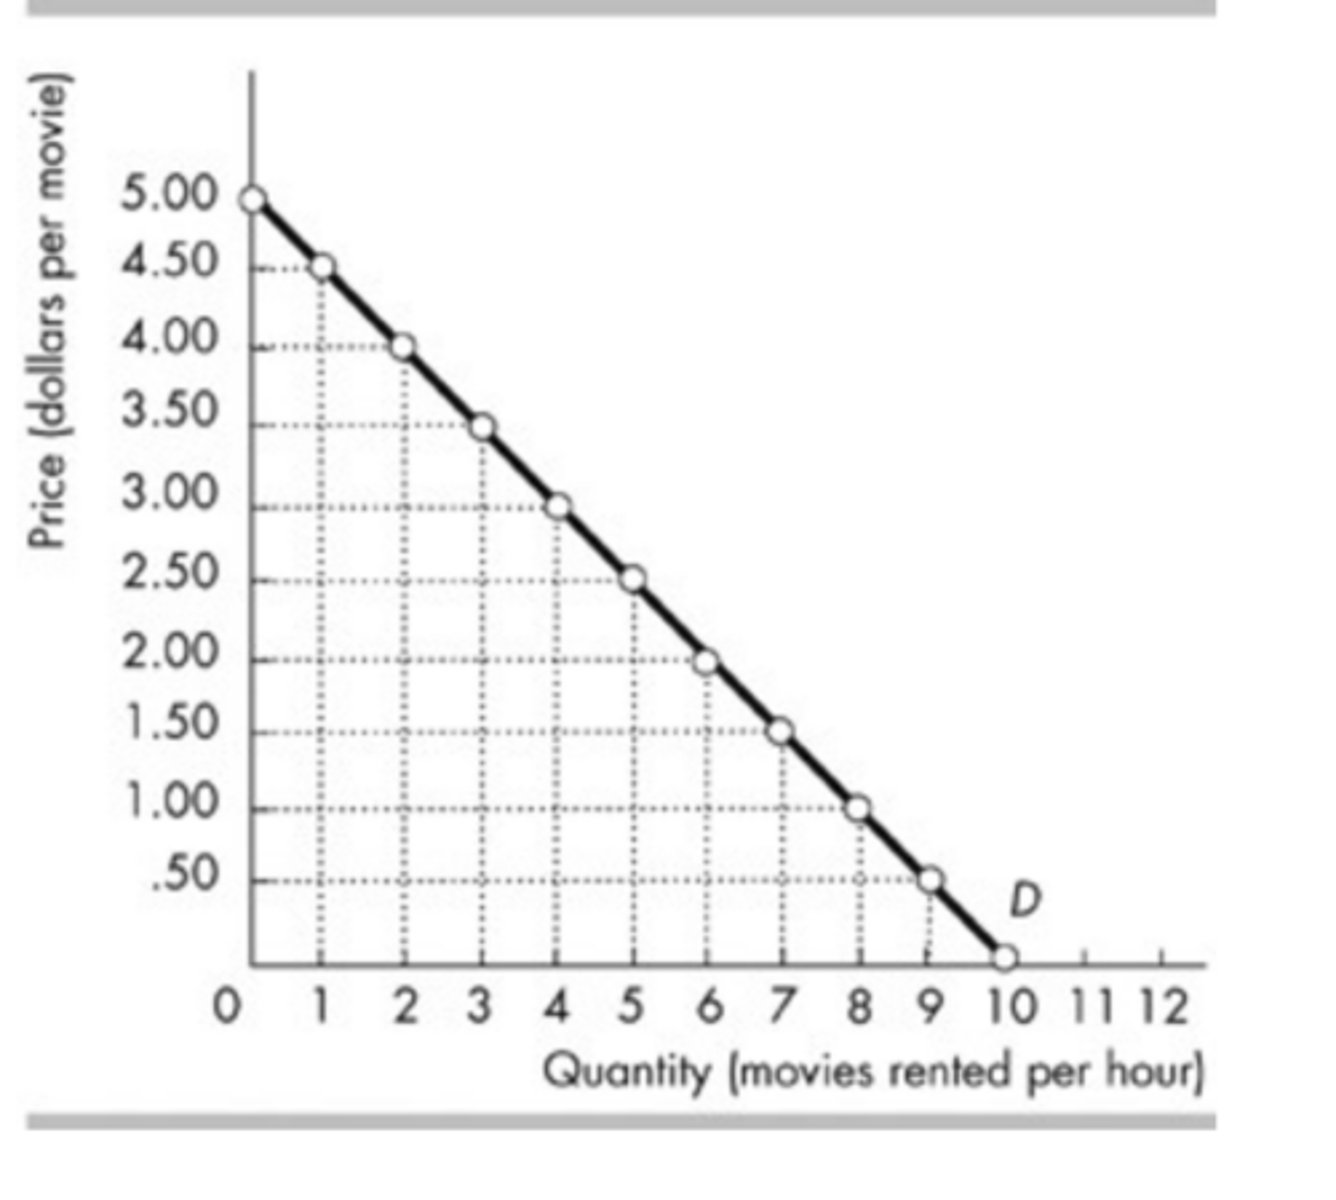
The above figure shows the demand curve for movie rentals from Redbox. At which of the following prices does Redbox have the maximum total revenue?
$2.50
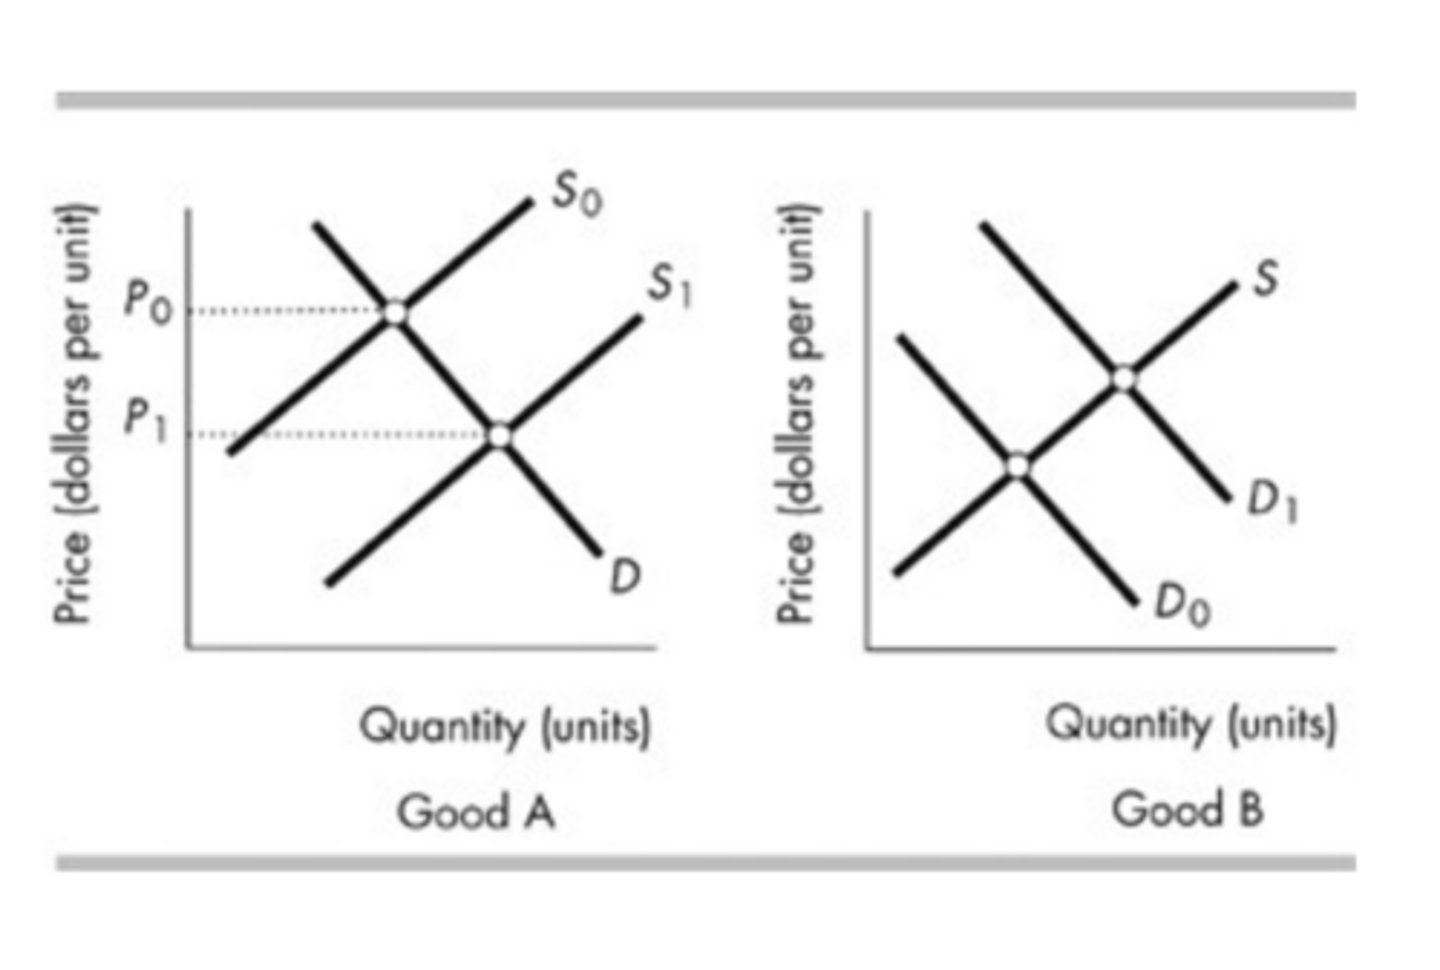
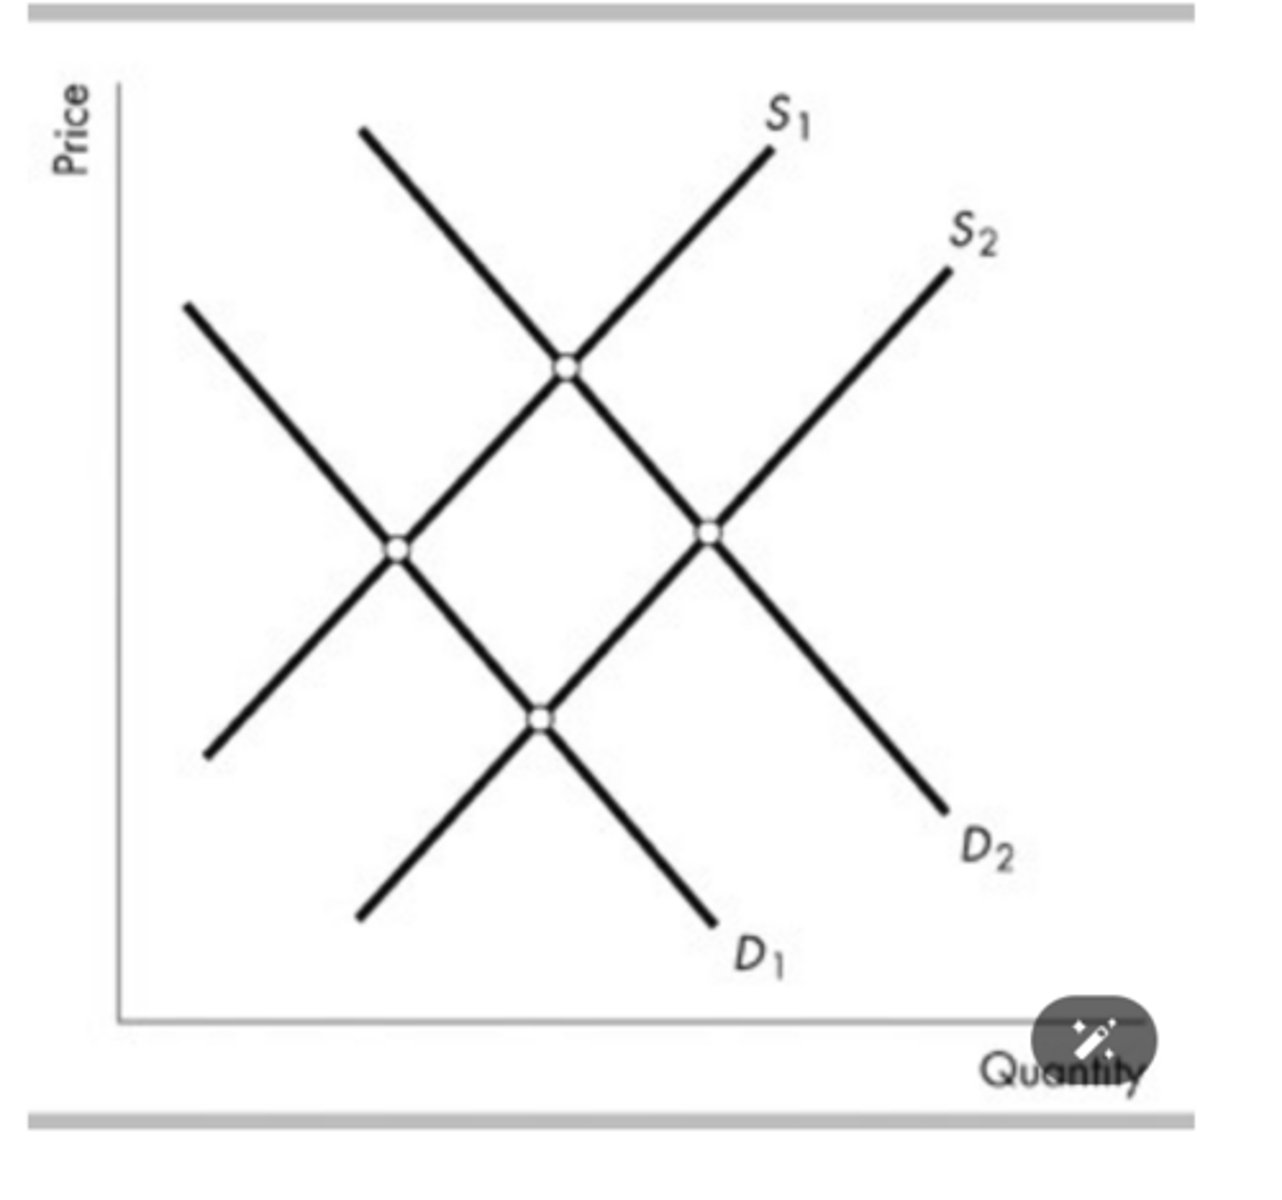
In the above figure, if the two goods A and B, are complements, which of the following is TRUE?
The shift from S0 to S1 for good A leads to the shift from D0 to D1 for good B.
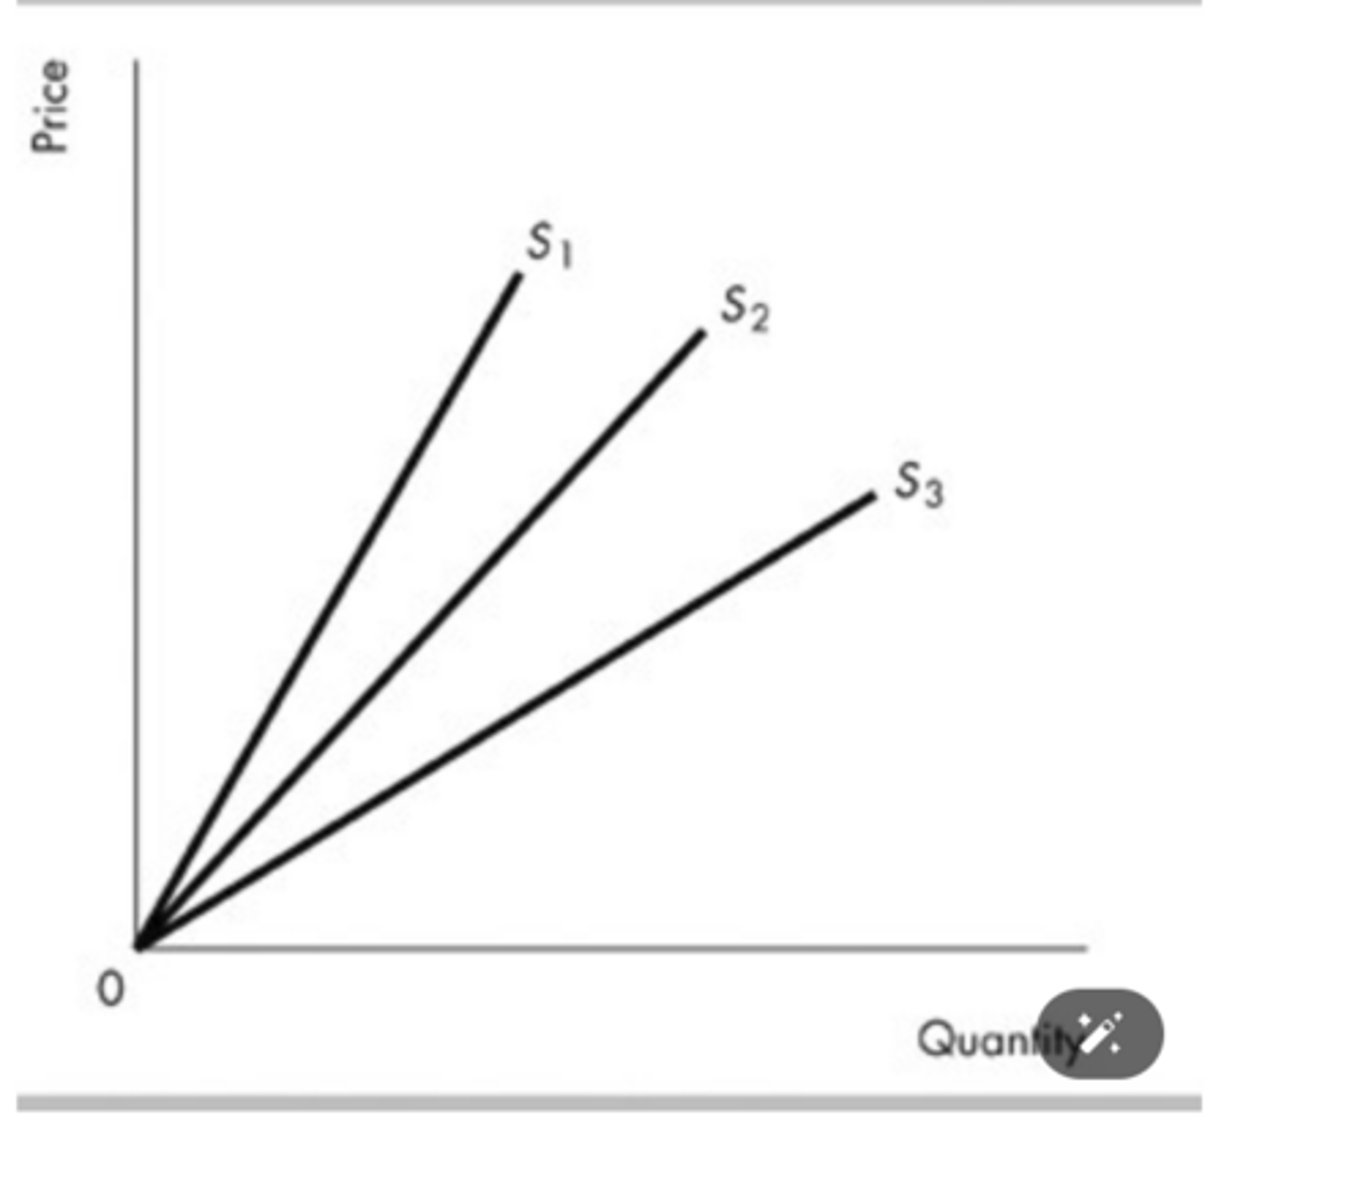
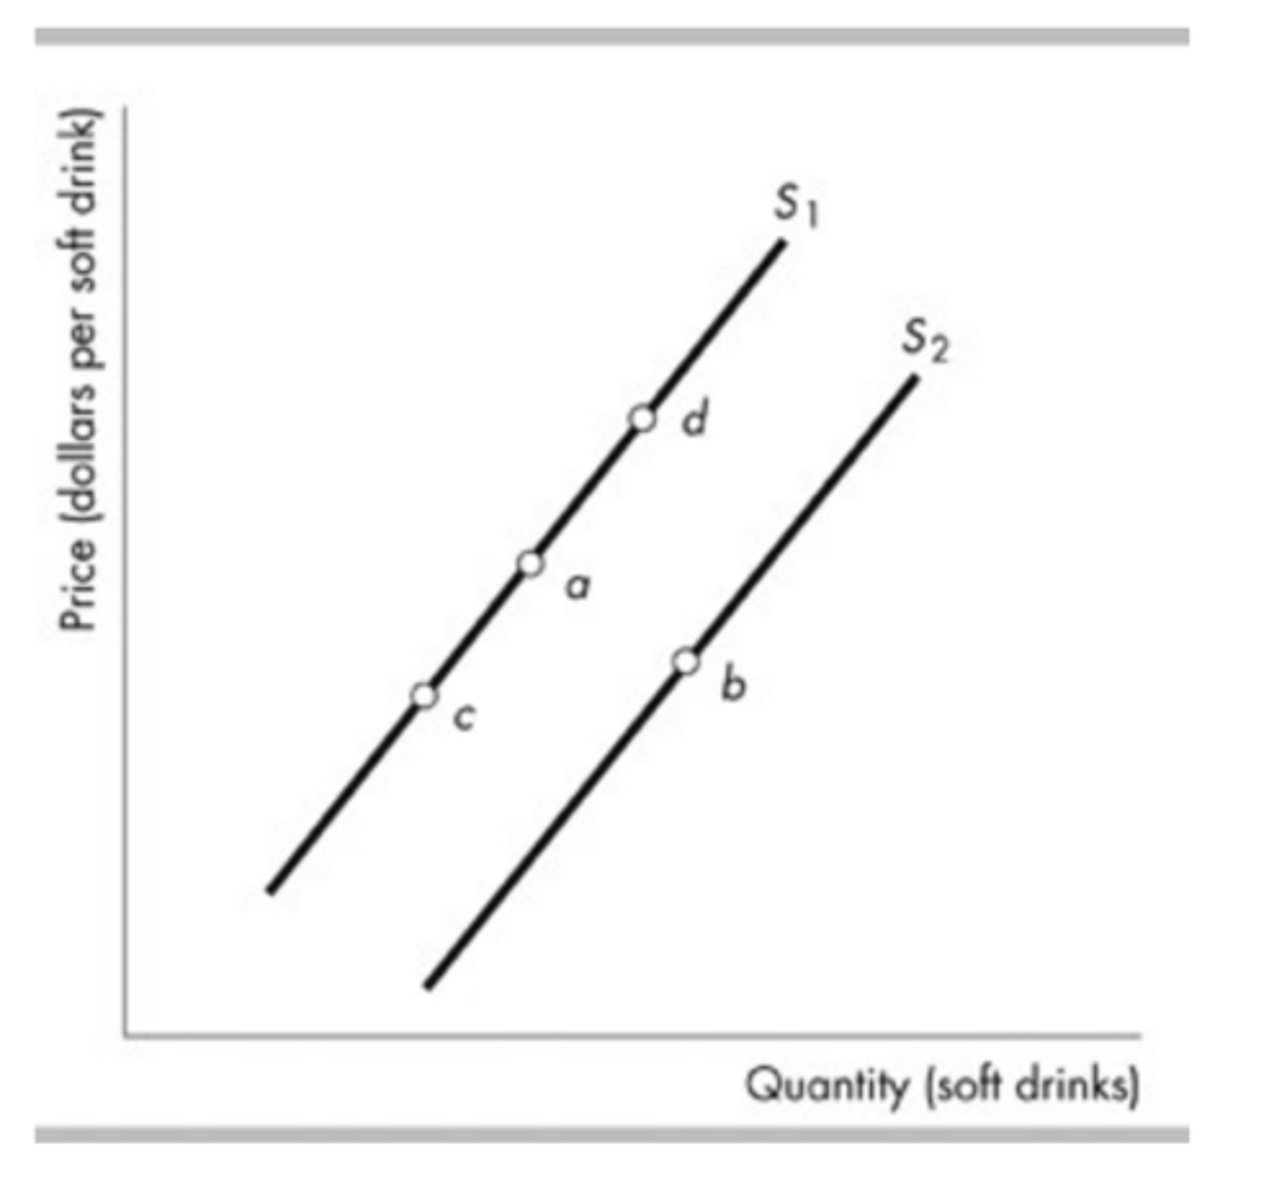
In the above figure, the price elasticity of supply at any given quantity is
equal to one on each of the three supply curves.
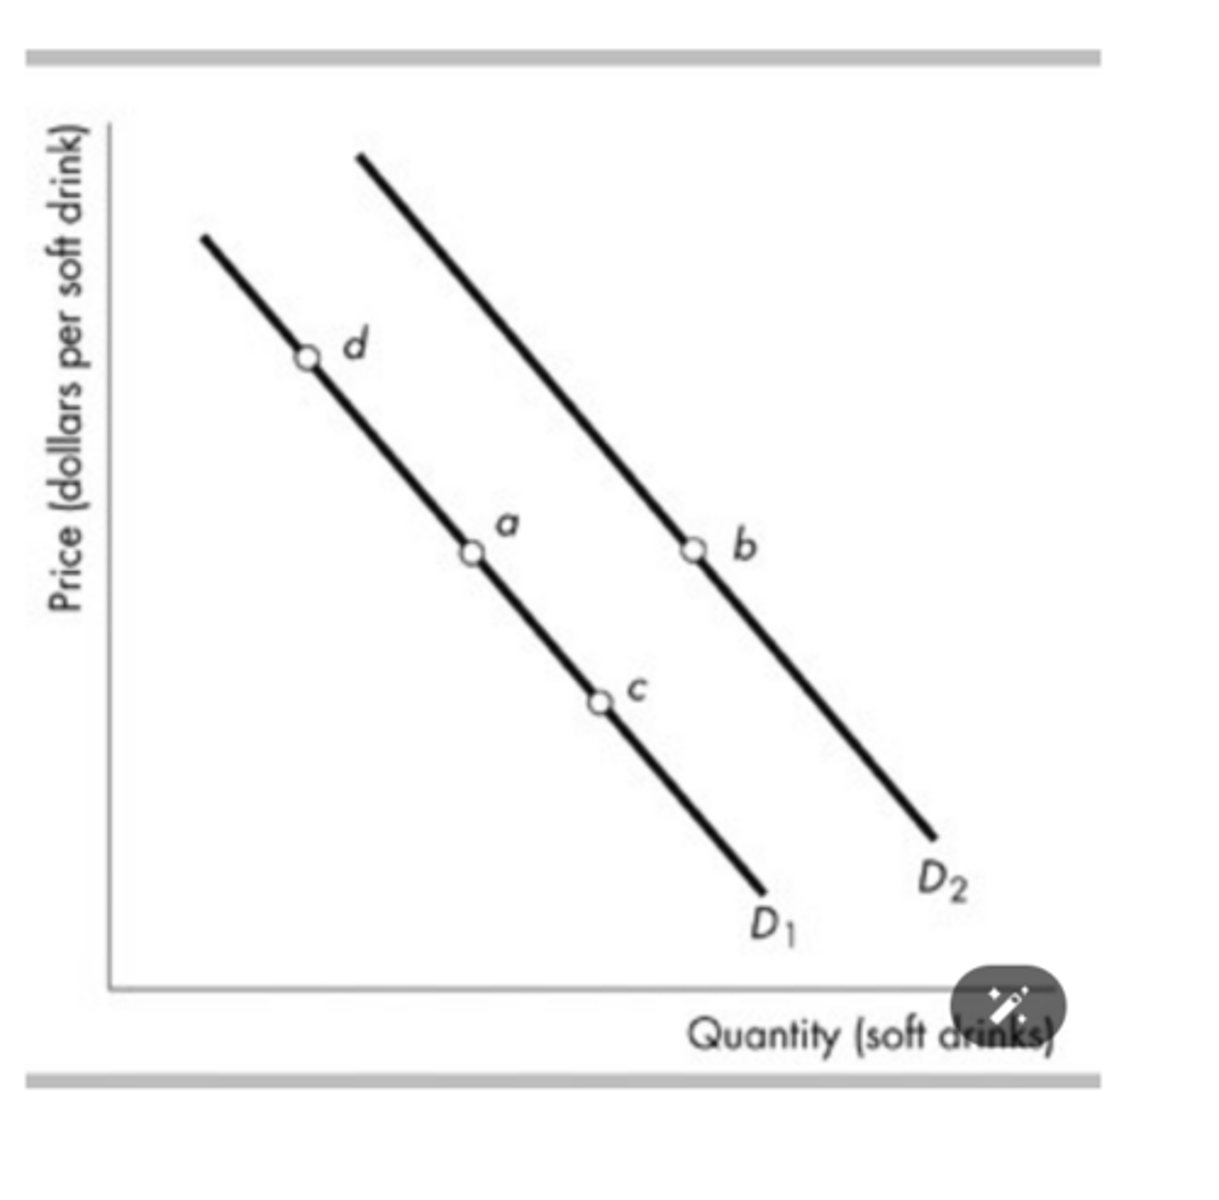
Consider the demand curves for soft drinks shown in the figure above. Moving from point a to point c means that
the marginal benefit of each additional soft drink falls.
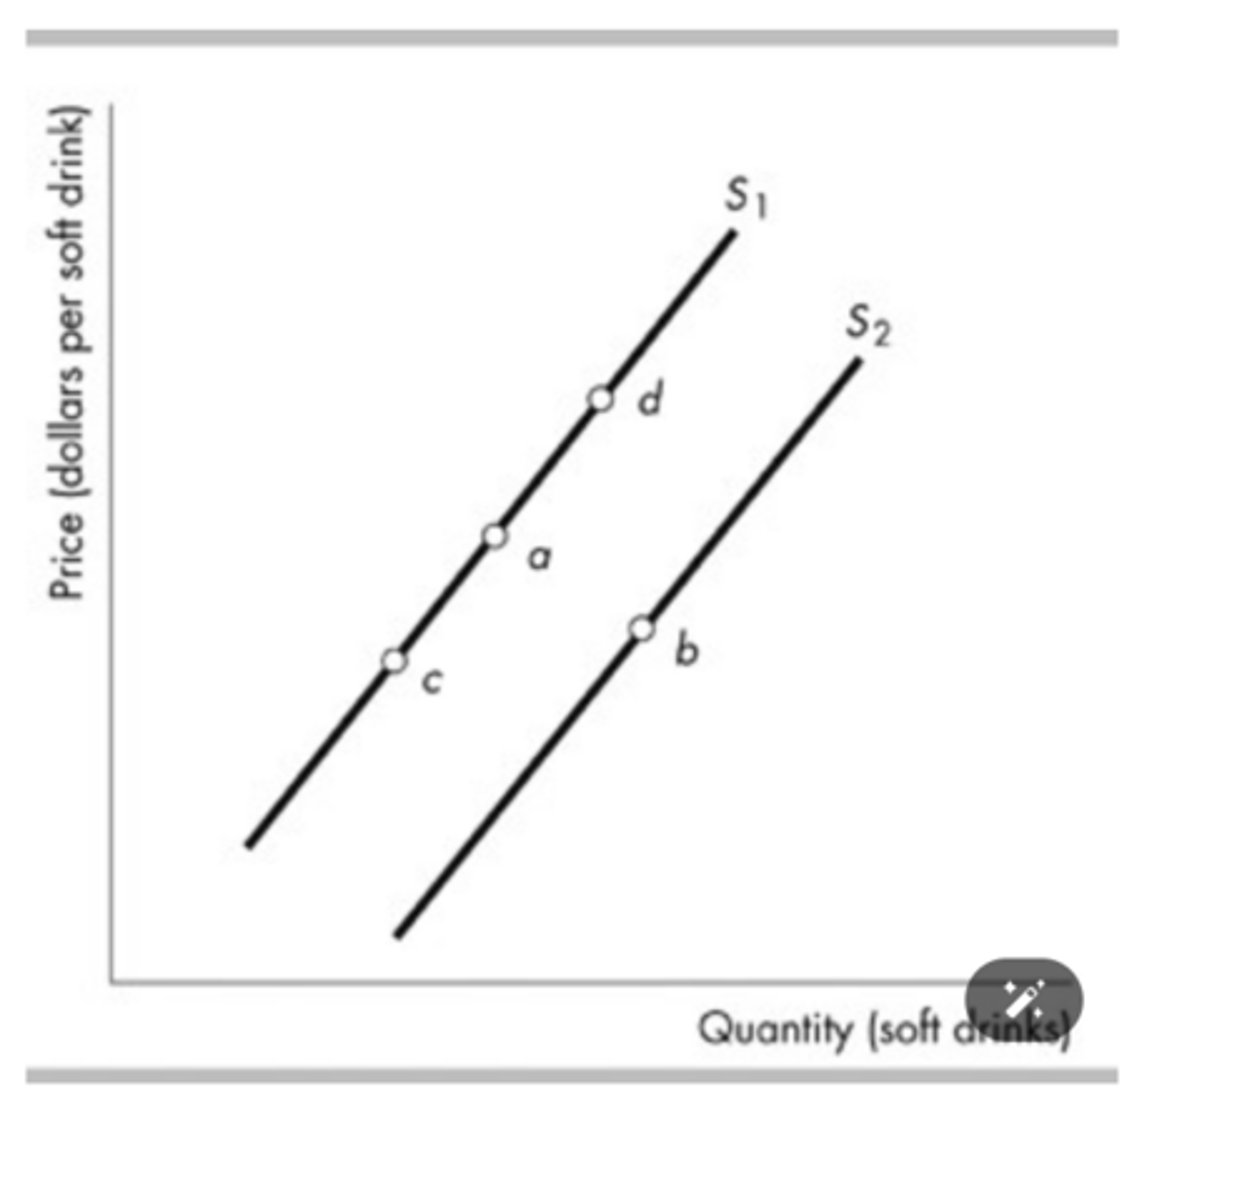
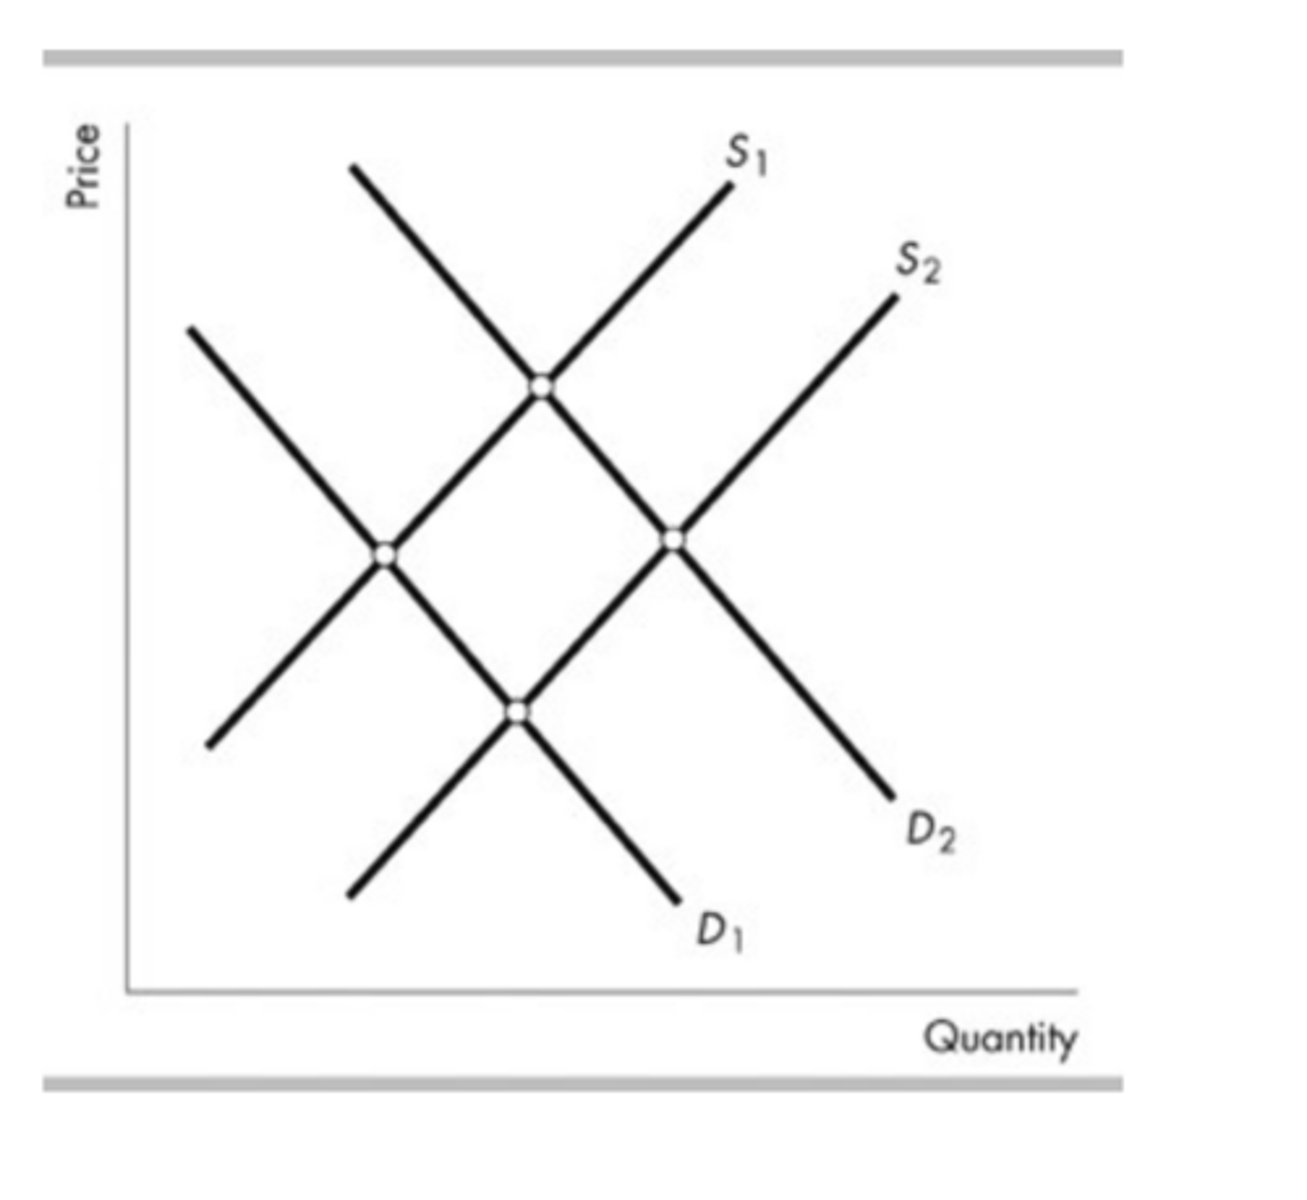
The figure above shows supply curves for soft drinks. Suppose the economy is at point a. A decrease in the price of sugar used to make soft drinks is shown as a movement from point a to a point such as
point b.
The above figure shows the market for bicycles. When there is a physical fitness craze so that everyone wants to exercise the
demand curve for bicycles shifts from D1 to D2.
The figure above shows the market for candy. People become more concerned that eating candy causes them to gain weight, which they do not like. As a result, the
demand curve shifts from D2 to D1 and the supply curve does not shift.
The figure above shows supply curves for soft drinks. Suppose the economy is at point a. An increase in the number of suppliers would be shown as a movement from point a to a point such as
point b
The above figure shows the market for french fries at fast food restaurants. If the price of potatoes rises and simultaneously people become concerned that french fries can cause heart attacks the
demand curve for french fries shifts from D2 to D1 and the supply curve of french fries shifts from S2 to S1.
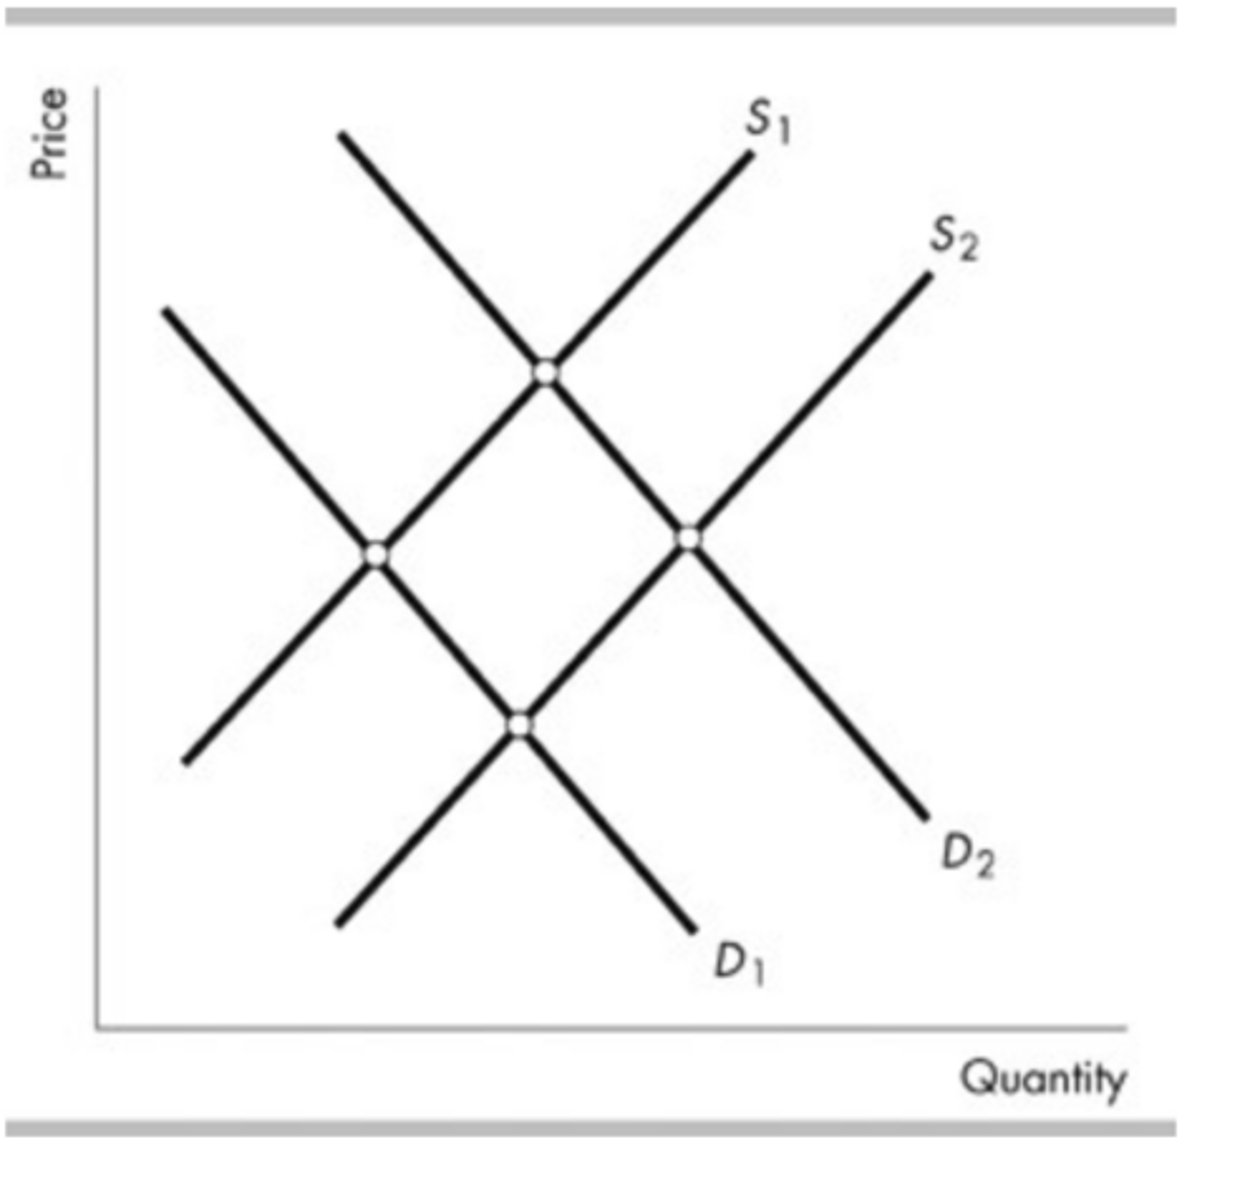
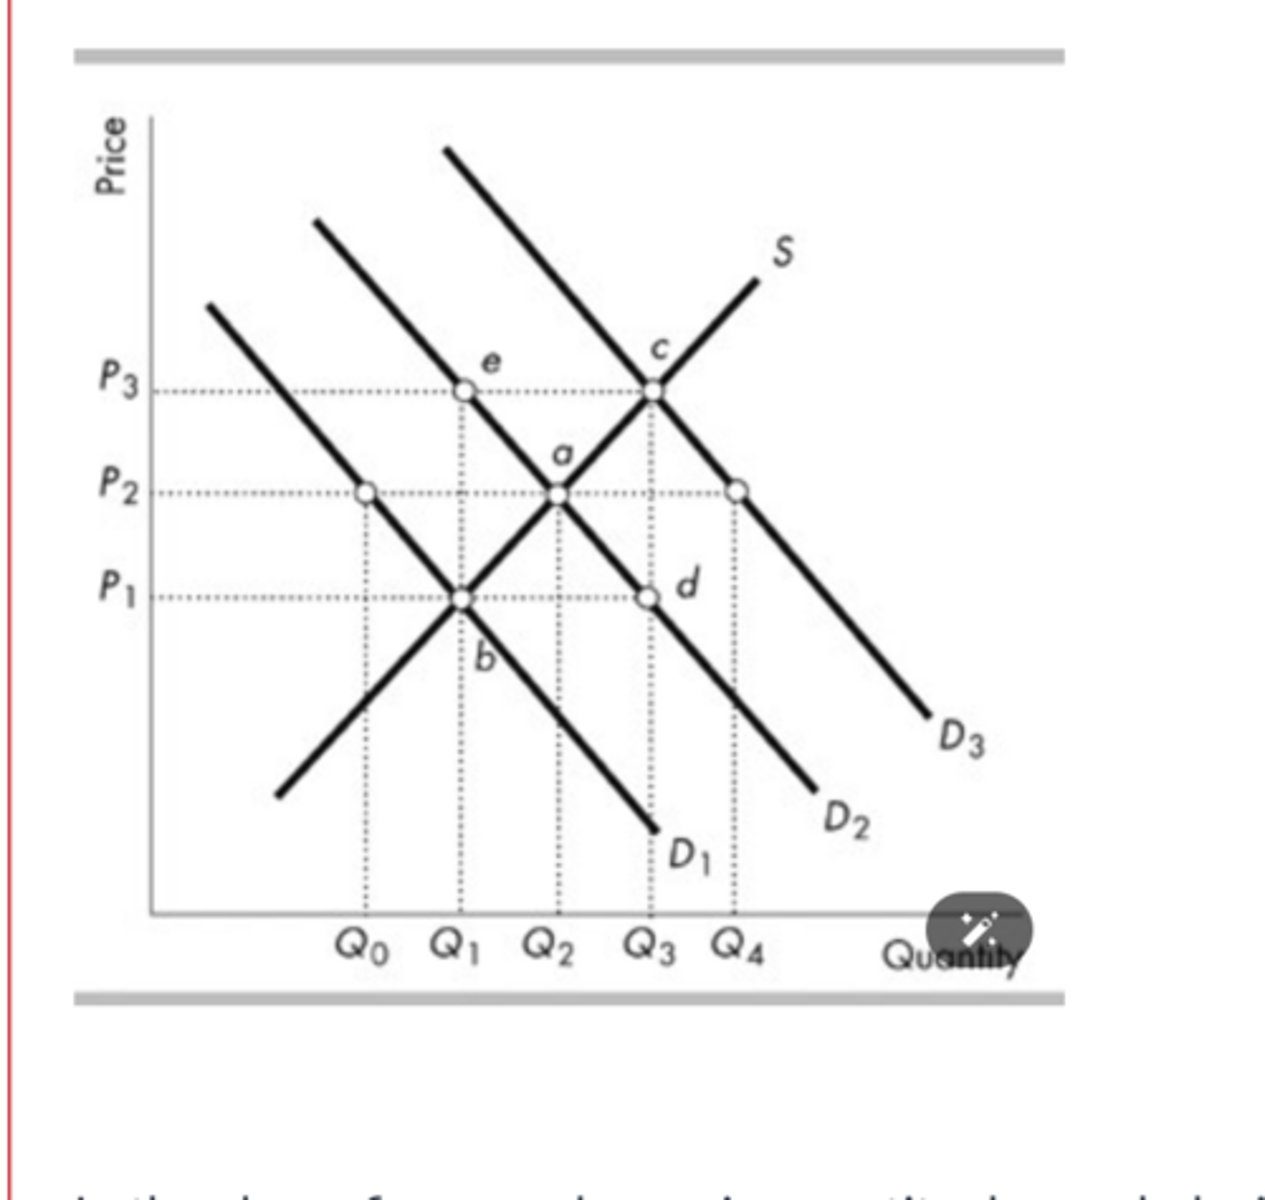
In the above figure, a change in quantity demanded with unchanged demand is represented by a movement from
point a to point e.
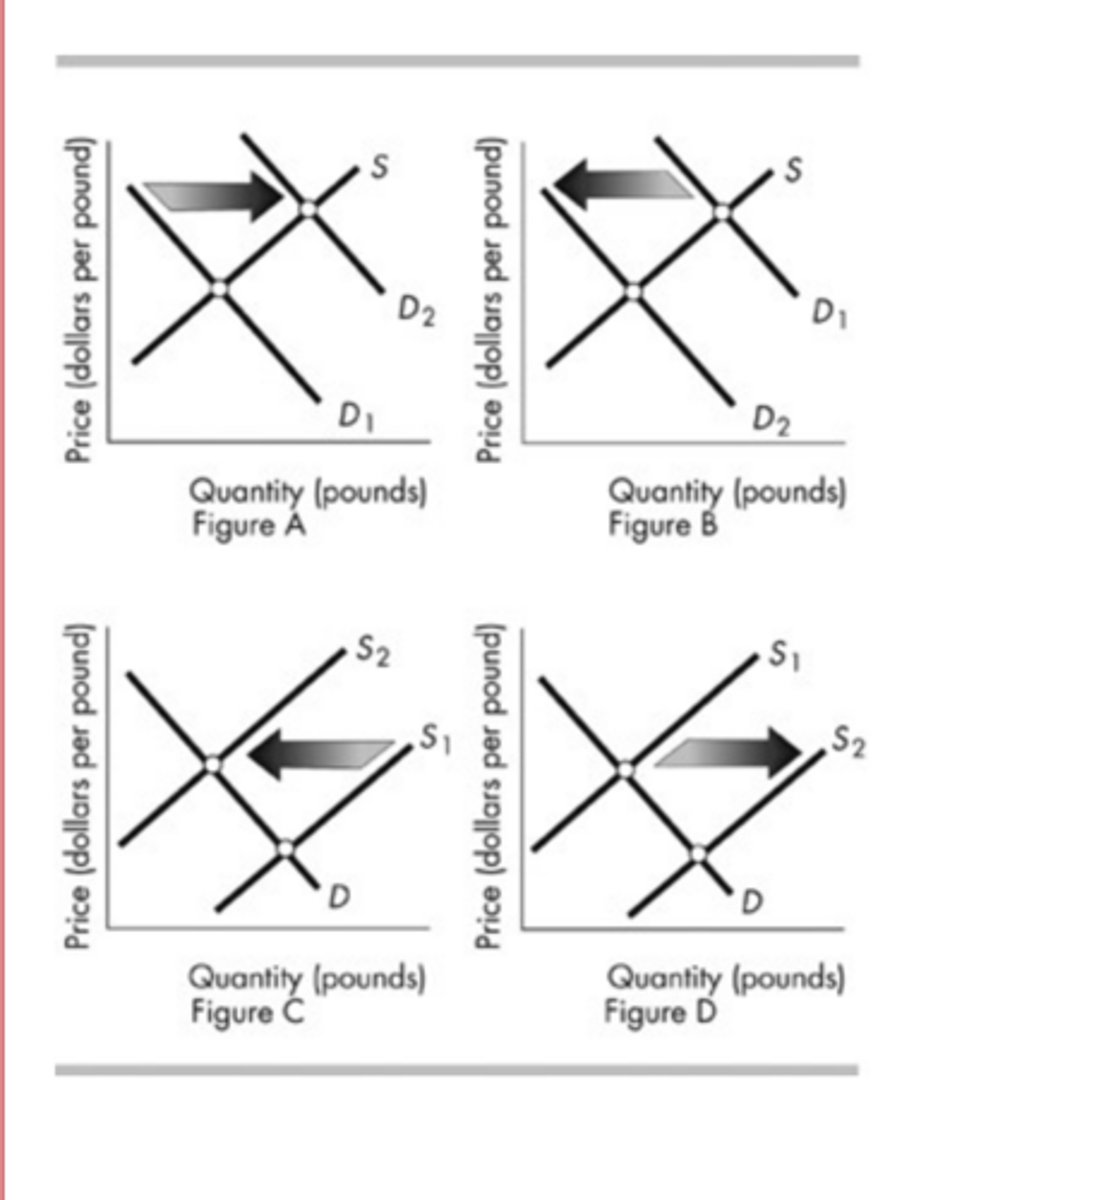
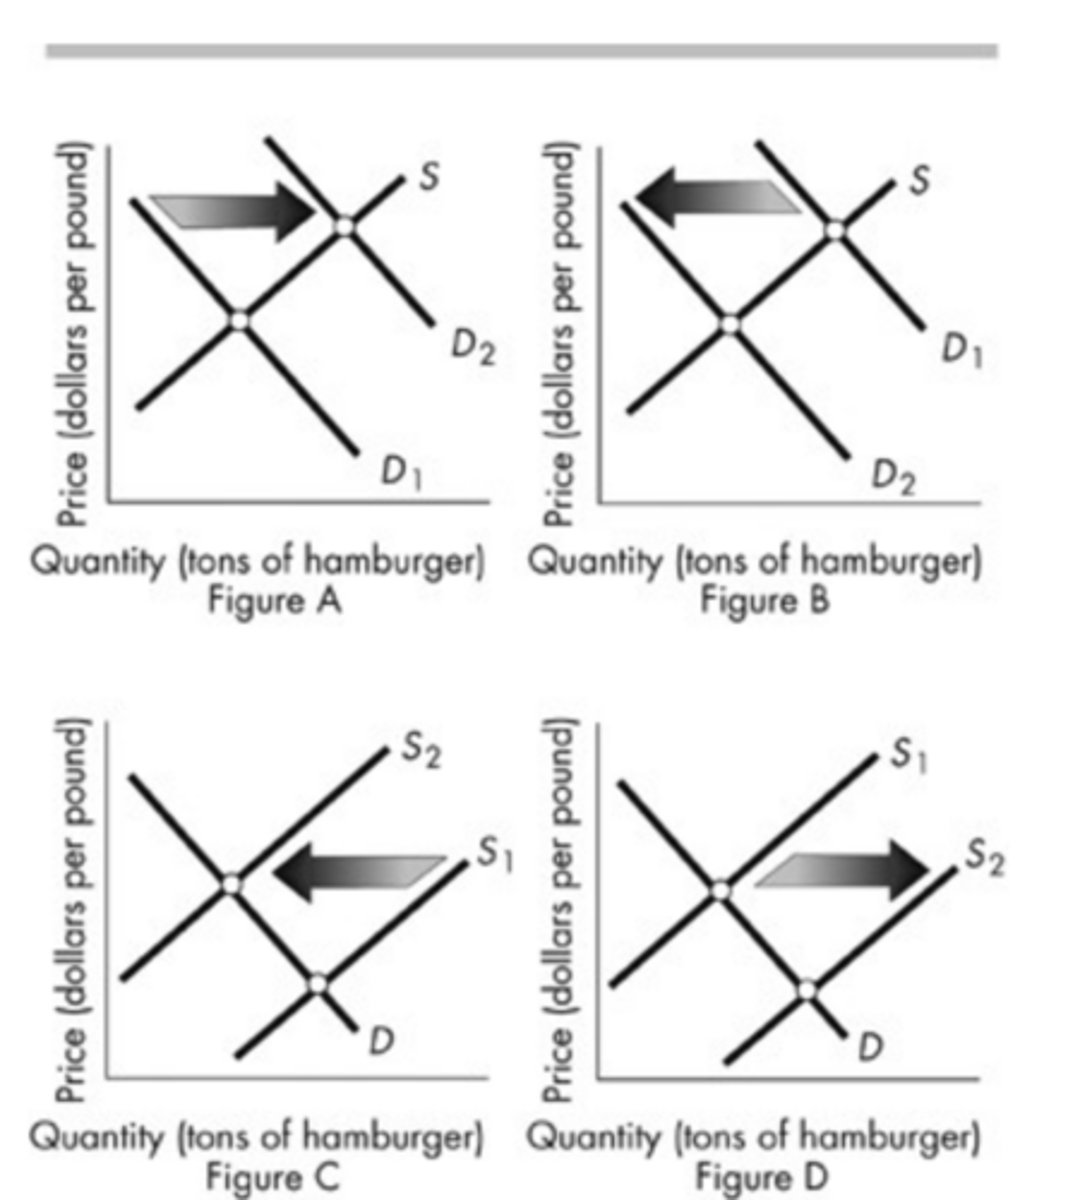
The above figure shows the market for hamburger. Which figure shows the effect of an announcement by the U.S. Food and Drug Administration (FDA)that eating hamburger causes early death?
Figure B
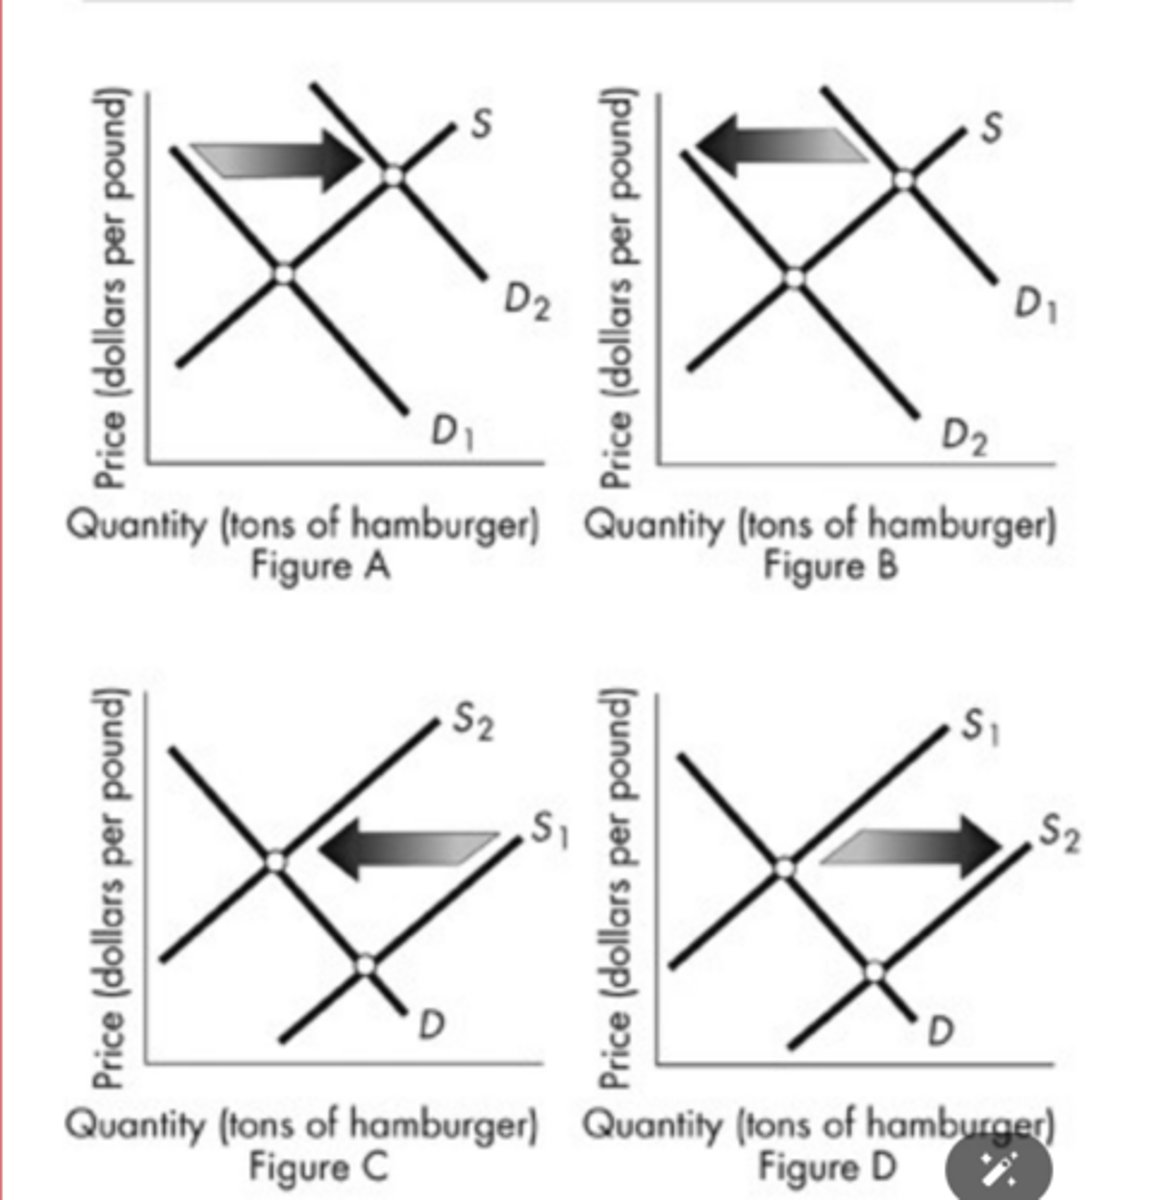
The above figure shows the market for hamburger. Which panel shows the effect of a new excise tax on all beef products?
Figure C
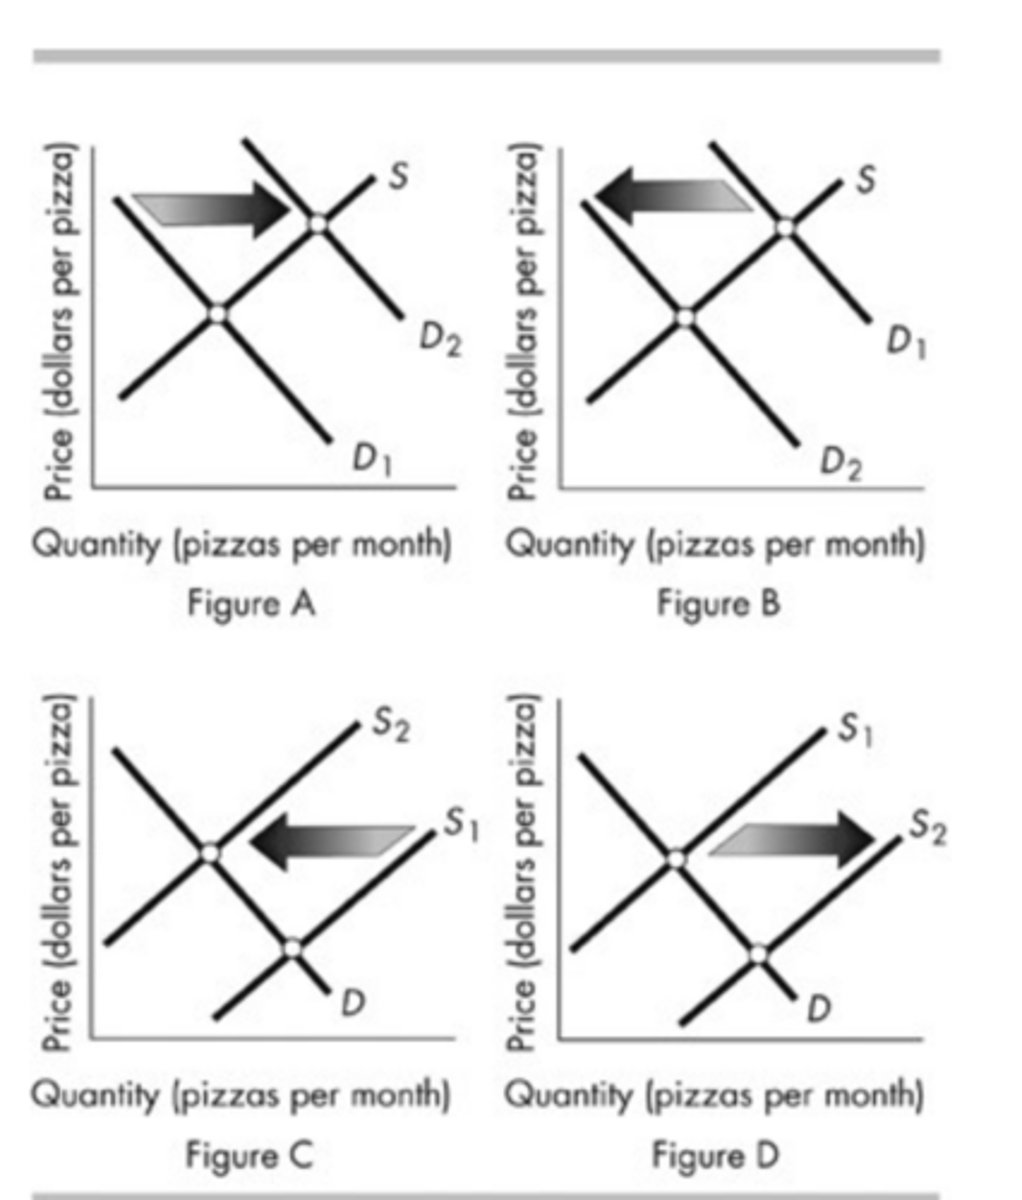
The above figure shows the market for pizza. Which figure shows the effect of an increase in the price of the tomato sauce used to produce pizza?
Figure C
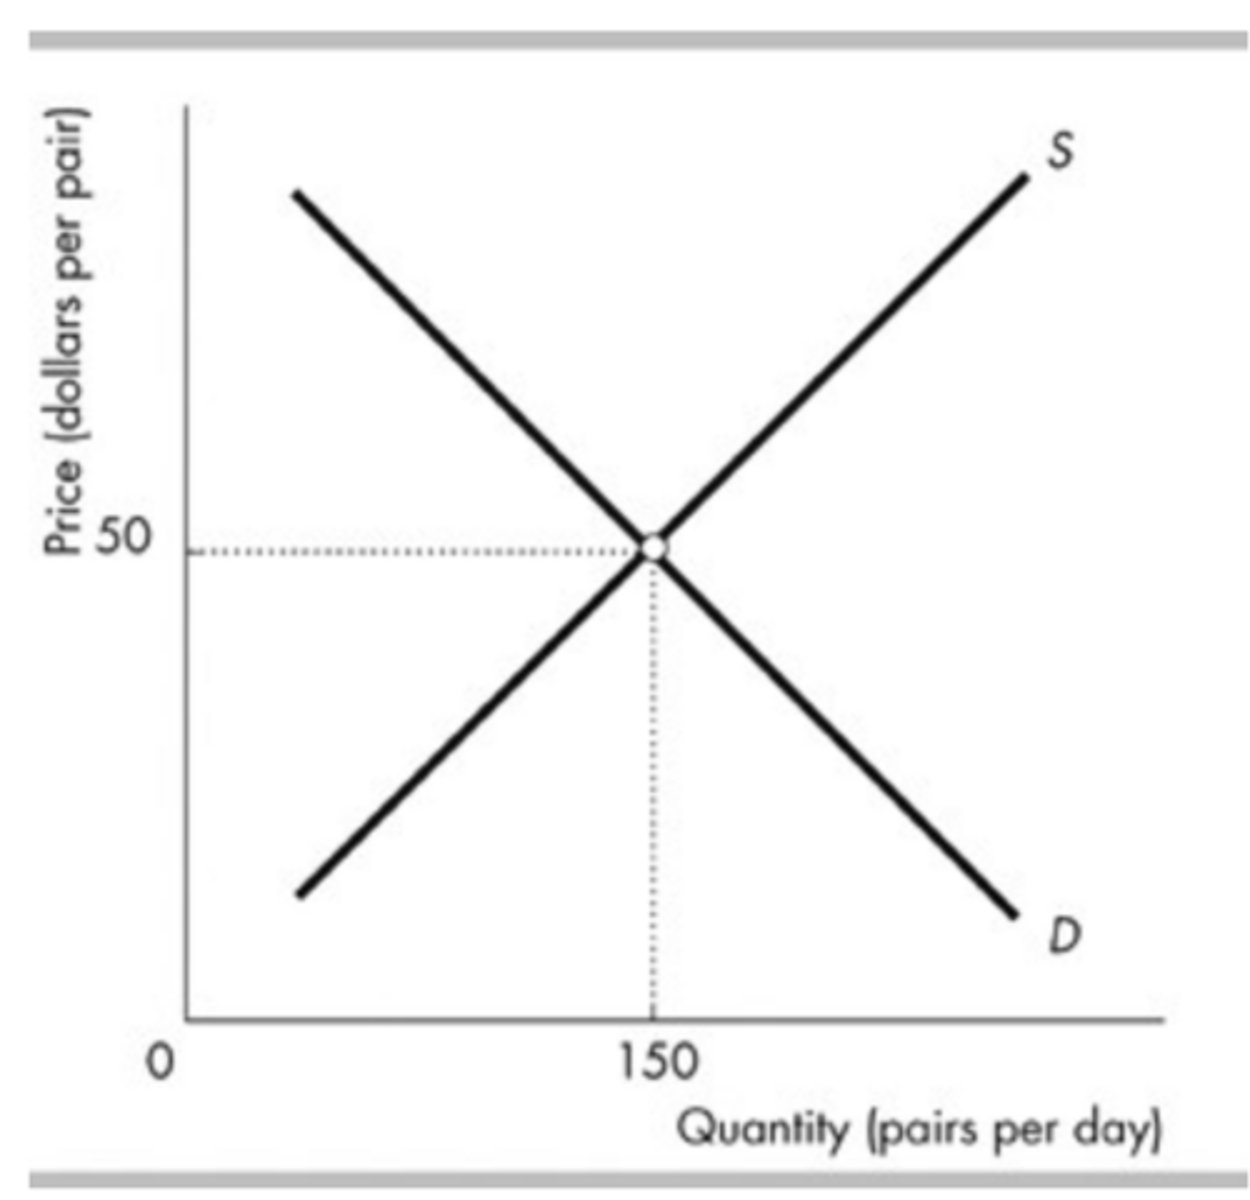
The figure illustrates the demand for and supply for jeans. Suppose jeans are a normal good and people's incomes increase. At the initial price of $50 for a pair of jeans, after the increase in income the quantity demanded is ________ than the equilibrium quantity and there is a ________ of jeans.
greater; shortage
The above figures show the market for oranges. Which figure(s) shows the effect of an increase in the price of bananas, a substitute for oranges?
Figure A