EVE 100 midterm #2
1/80
There's no tags or description
Looks like no tags are added yet.
Name | Mastery | Learn | Test | Matching | Spaced | Call with Kai |
|---|
No analytics yet
Send a link to your students to track their progress
81 Terms
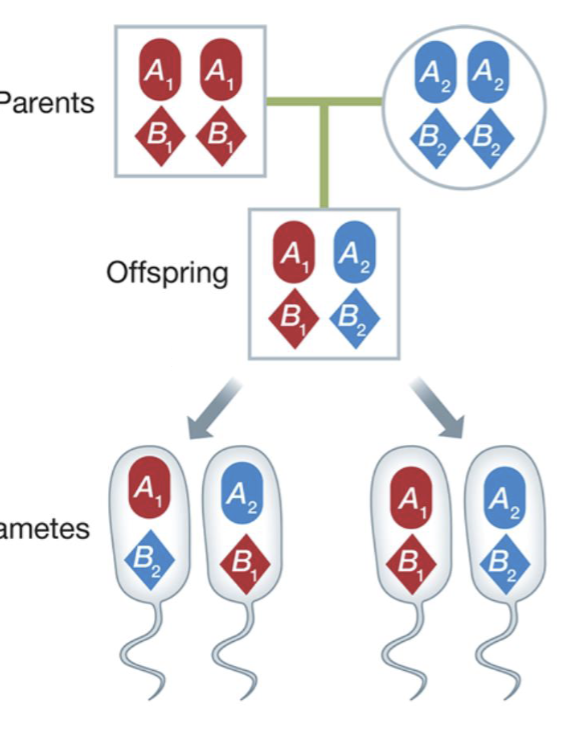
Recombination
A type of inheritance where gene mixing occurs
where genetic material from different sources is exchanged
occurs in sexual organisms during meiosis
epistasis
The effect of an allele at one locus depends on the allele at a second locus
Additive allele
An allele that yields twice the phenotypic effect when two copies are present at a given locus than when a single copy is present
Additive alleles are not influenced by the presence of other alleles (e.g dominance)
Qualitative traits
Simple traits, Mendelian traits
dominance or recessive
Phenotypic distribution; discontinuous/desecrate
Number of genes involved; one to a few (monogenic)
Effects of environment; small
ex; sickle cell, blood group
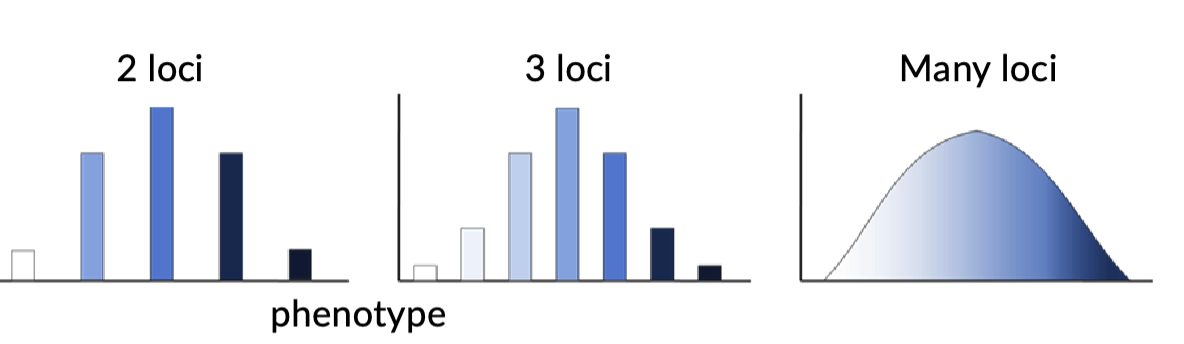
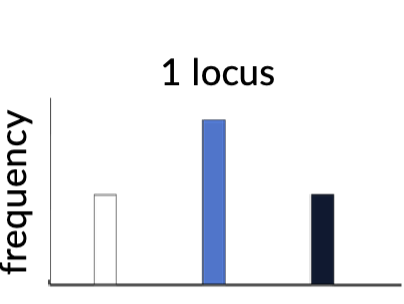
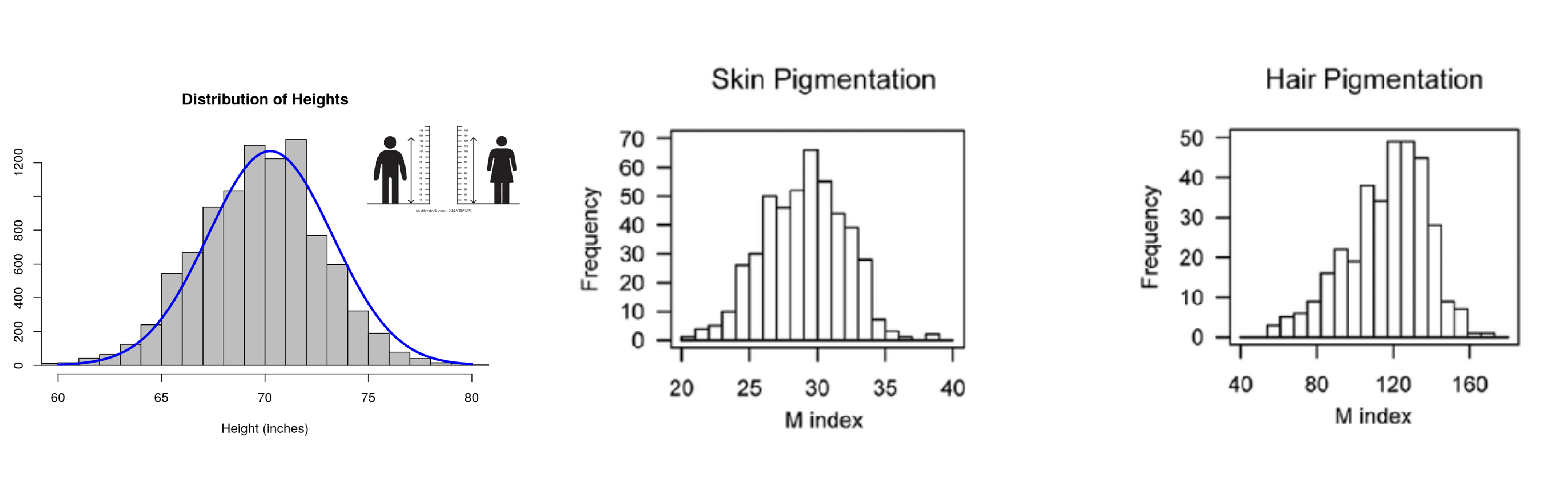
Quantitive Traits
studies the genetic and environmental factors that influence variation in complex traits
Additive alleles
Phenotypic distribution; continuous
number of genes involved; many (polygenic)
Effect of environment; moderate to large
ex; height, weight, genetic disorders
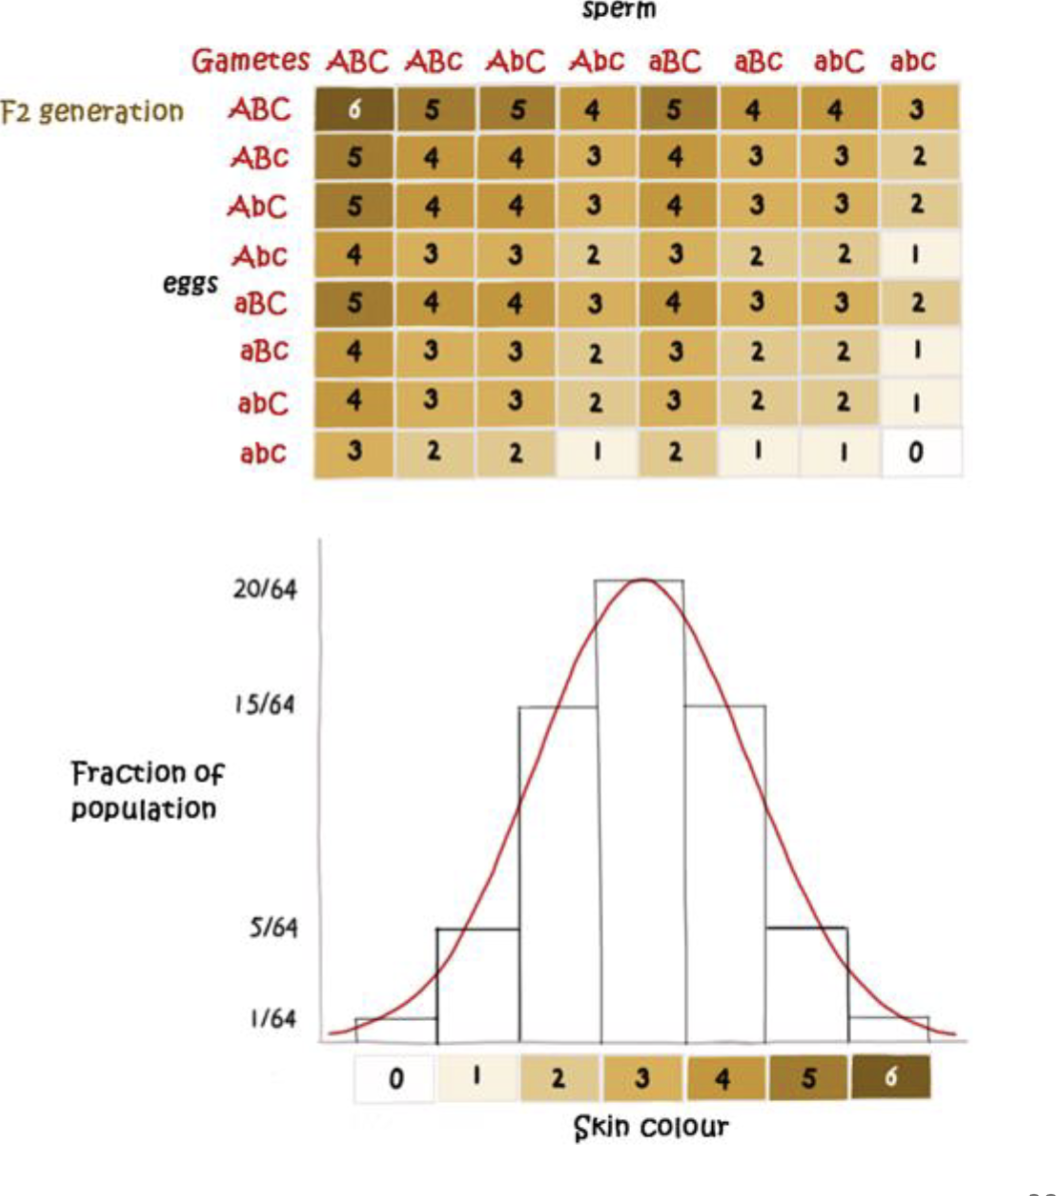
What about inheritance of continuous traits?
Multiple genes can be involved
impacted by environmental factors
How do we quantify continuous phenotypes?
using broad sense heritability (H2)
H2 = VG/VP = VG/VG+VE
H= proportion of total phenotypic variation
VG= variance from genetic differences between individuals
VE= differences in individuals from environmental conditions they were raised

Heritability
A proportion of the total phenotypic variance that is attributable to genetic variation
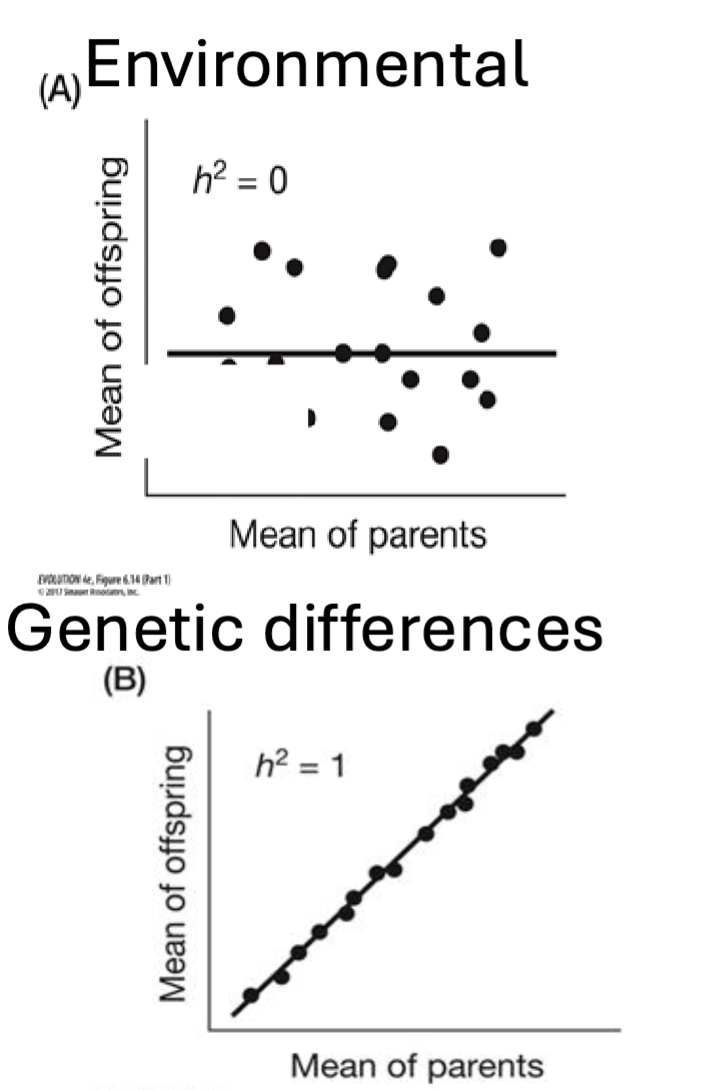
Broad Sense Heritability (H2)
Measures relative importance of genetic and environmental effects on trait expression
genes
h2=1 trait expression is influences by genes
environment —> like parental care
h2=0 trait expression is dominated by the environment
Narrow Sense Heritability (h2)
Proportion of phenotypic variance of a trait attributable to the additive effects of alleles within a population at a specific time
h2 = VA/VP = VA/VG+VE = VA/VA+VD+VI+VE
VA= additive genetic variance
VD= variance due to dominance
VI= variance due to episastic interactions amount alleles at varous genetic loci
How do we figure out which genes contribute to the phenotype?
Genome wide association analyses (GWAS)
Method for identifying genes associated with a phenotype
Scan genotype to find which loci is responsible for contributing to the genotype
what does narrow heritability tell us?
Allows us to understand how a trait in a a population is able to evolve in response to selection
what does narrow heritability not tell us?
does not tell us about “nature vs nurture”
does not tell us about differences between population
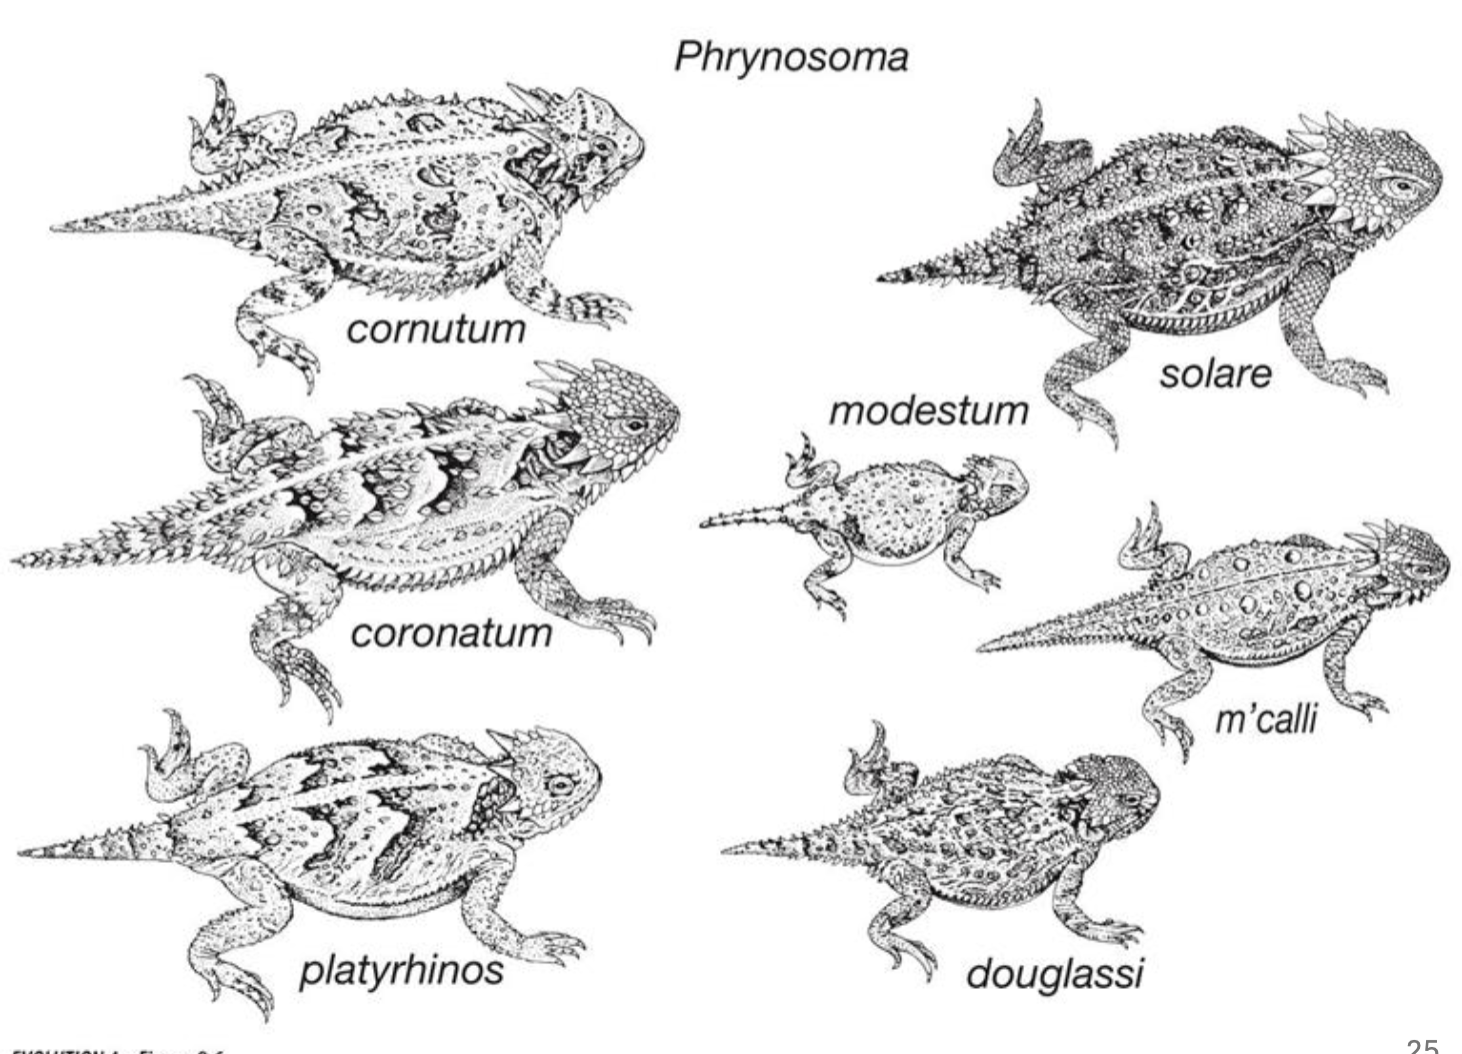
Selection on quantitative traits example
The horned lizard’s horn vary in size, phenotypic trait is being selected
Those with larger horns are less likely to experience predation from butcher bird
fitness function reveals increased horn size results in increased survival
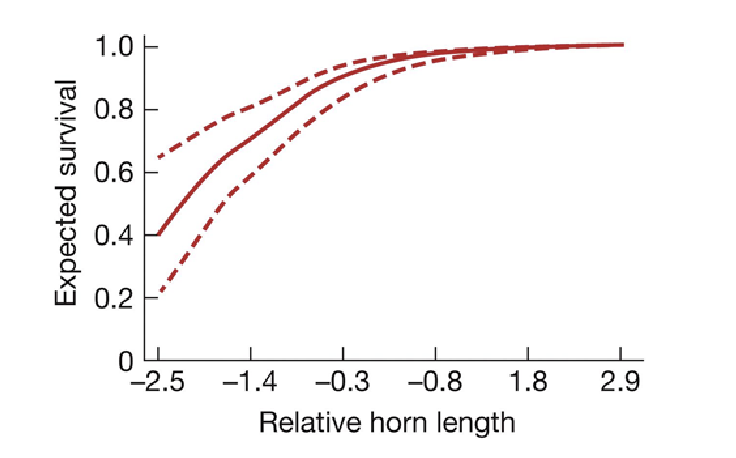
Fitness function
displays the selection on quantitative traits
The function that relates the phenotypic value for a trait to the average fitness of individuals with that trait value
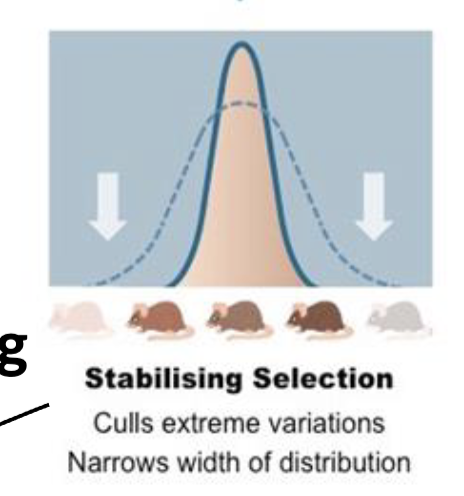
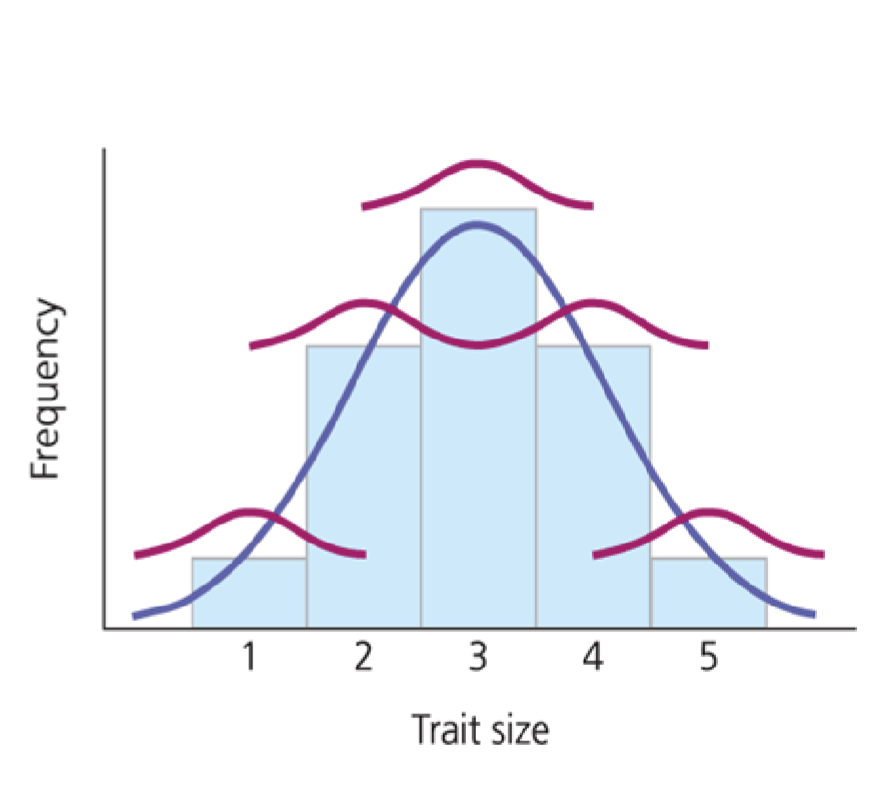
Stabilizing/Normalizing Selection
Culls extreme variation, narrow width distributions
ex; birthweight
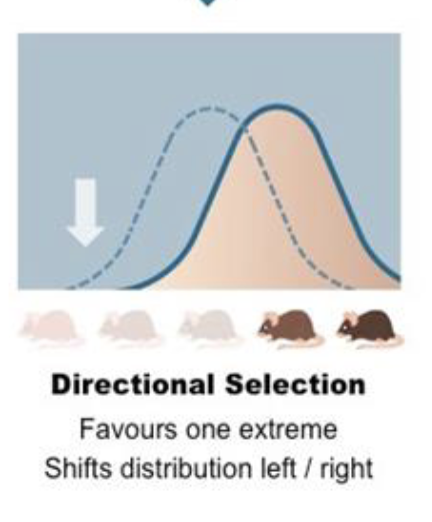
Directional Selections
Favors one extreme, shifts distribution left or right
ex; bill depth
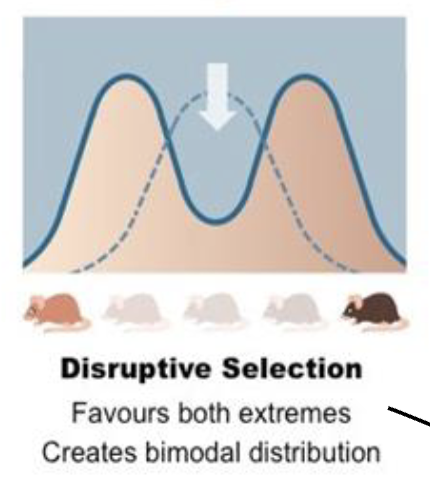
Disruptive/Diversifying Selection
Favors both extremes, creates bimodal distribution
ex; lower jawbone of birds (mandible)
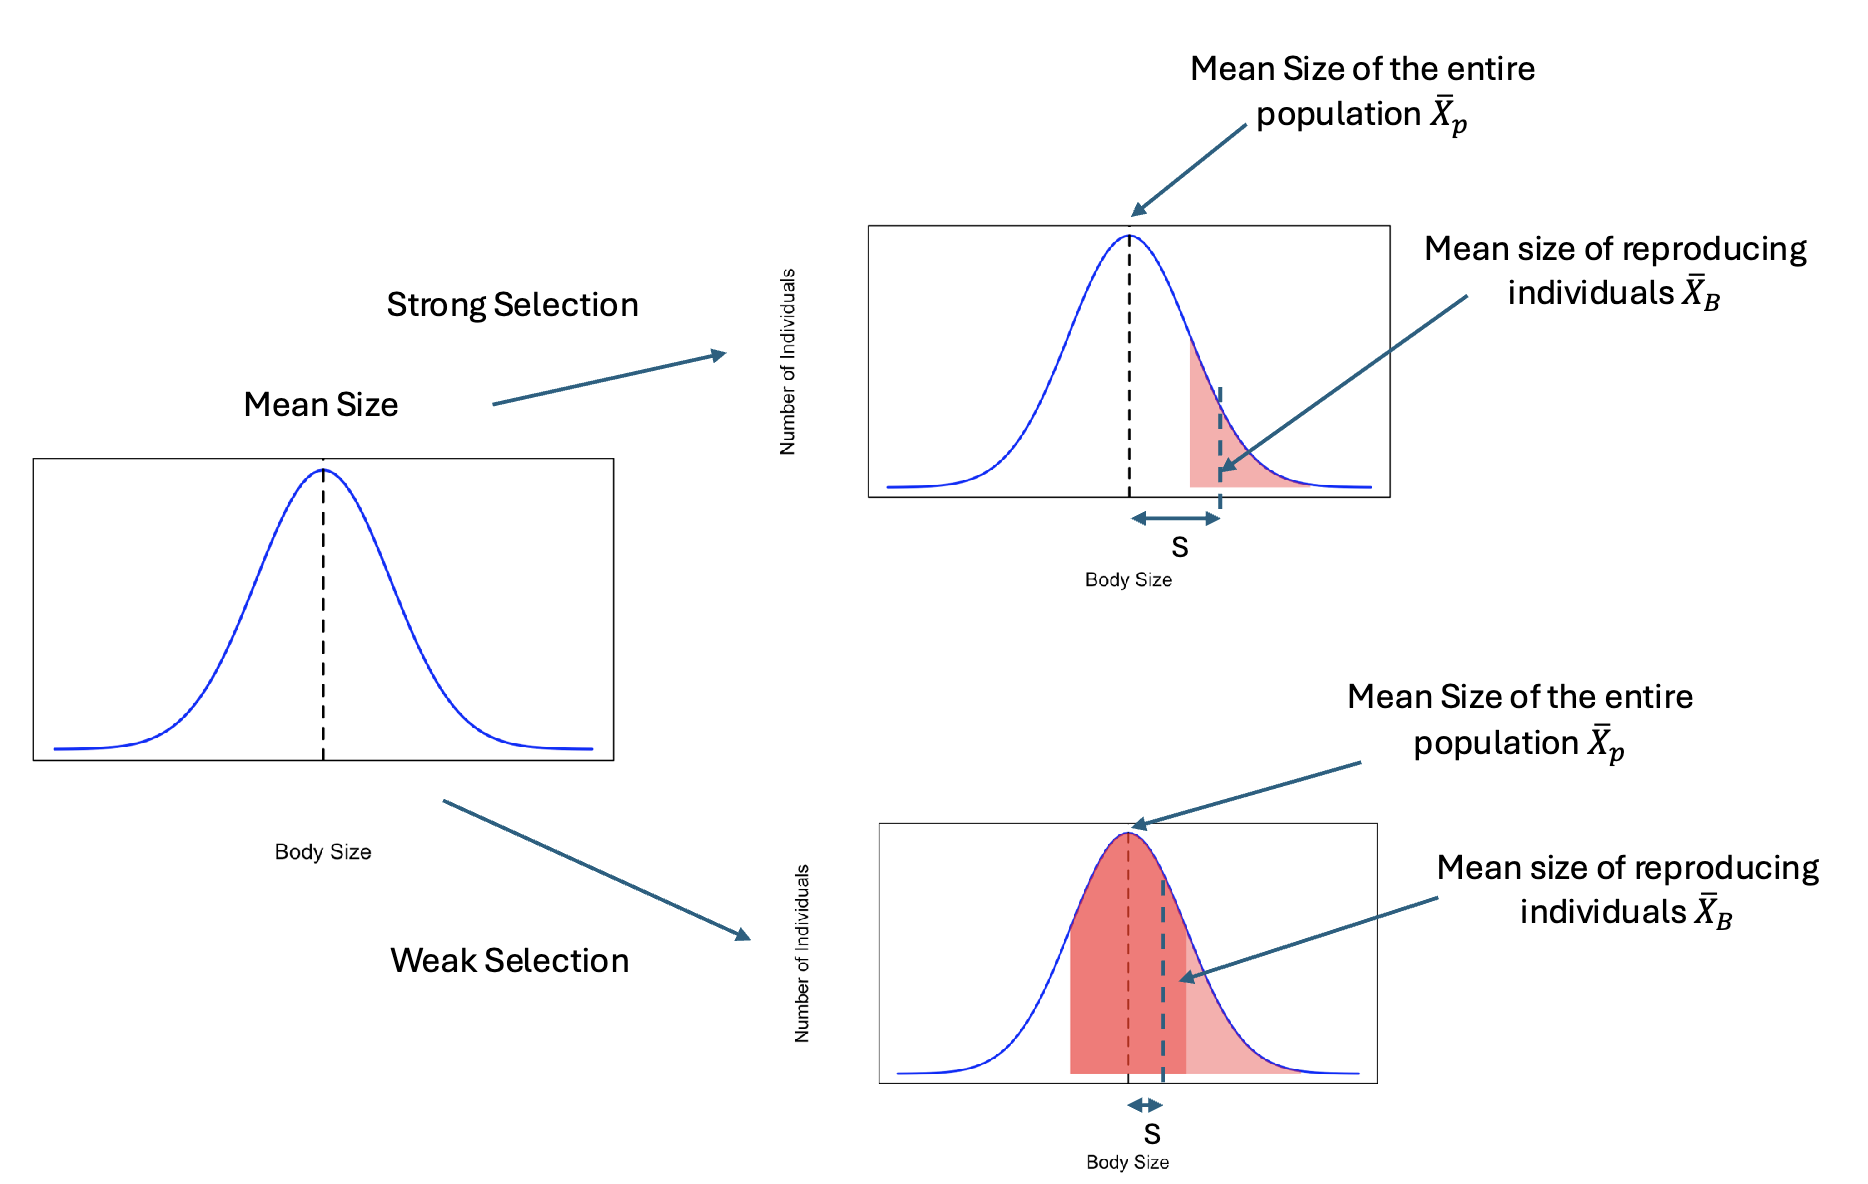
Strength of Selection (S)
A measure of the strength of phenotypic selection
Xp; all members of a population
XB; the mean of the individuals that reproduced
S = Xp - XB
Small S; weaker selection
Large S; stronger selection
S tells us the magnitude not the direction of selection!
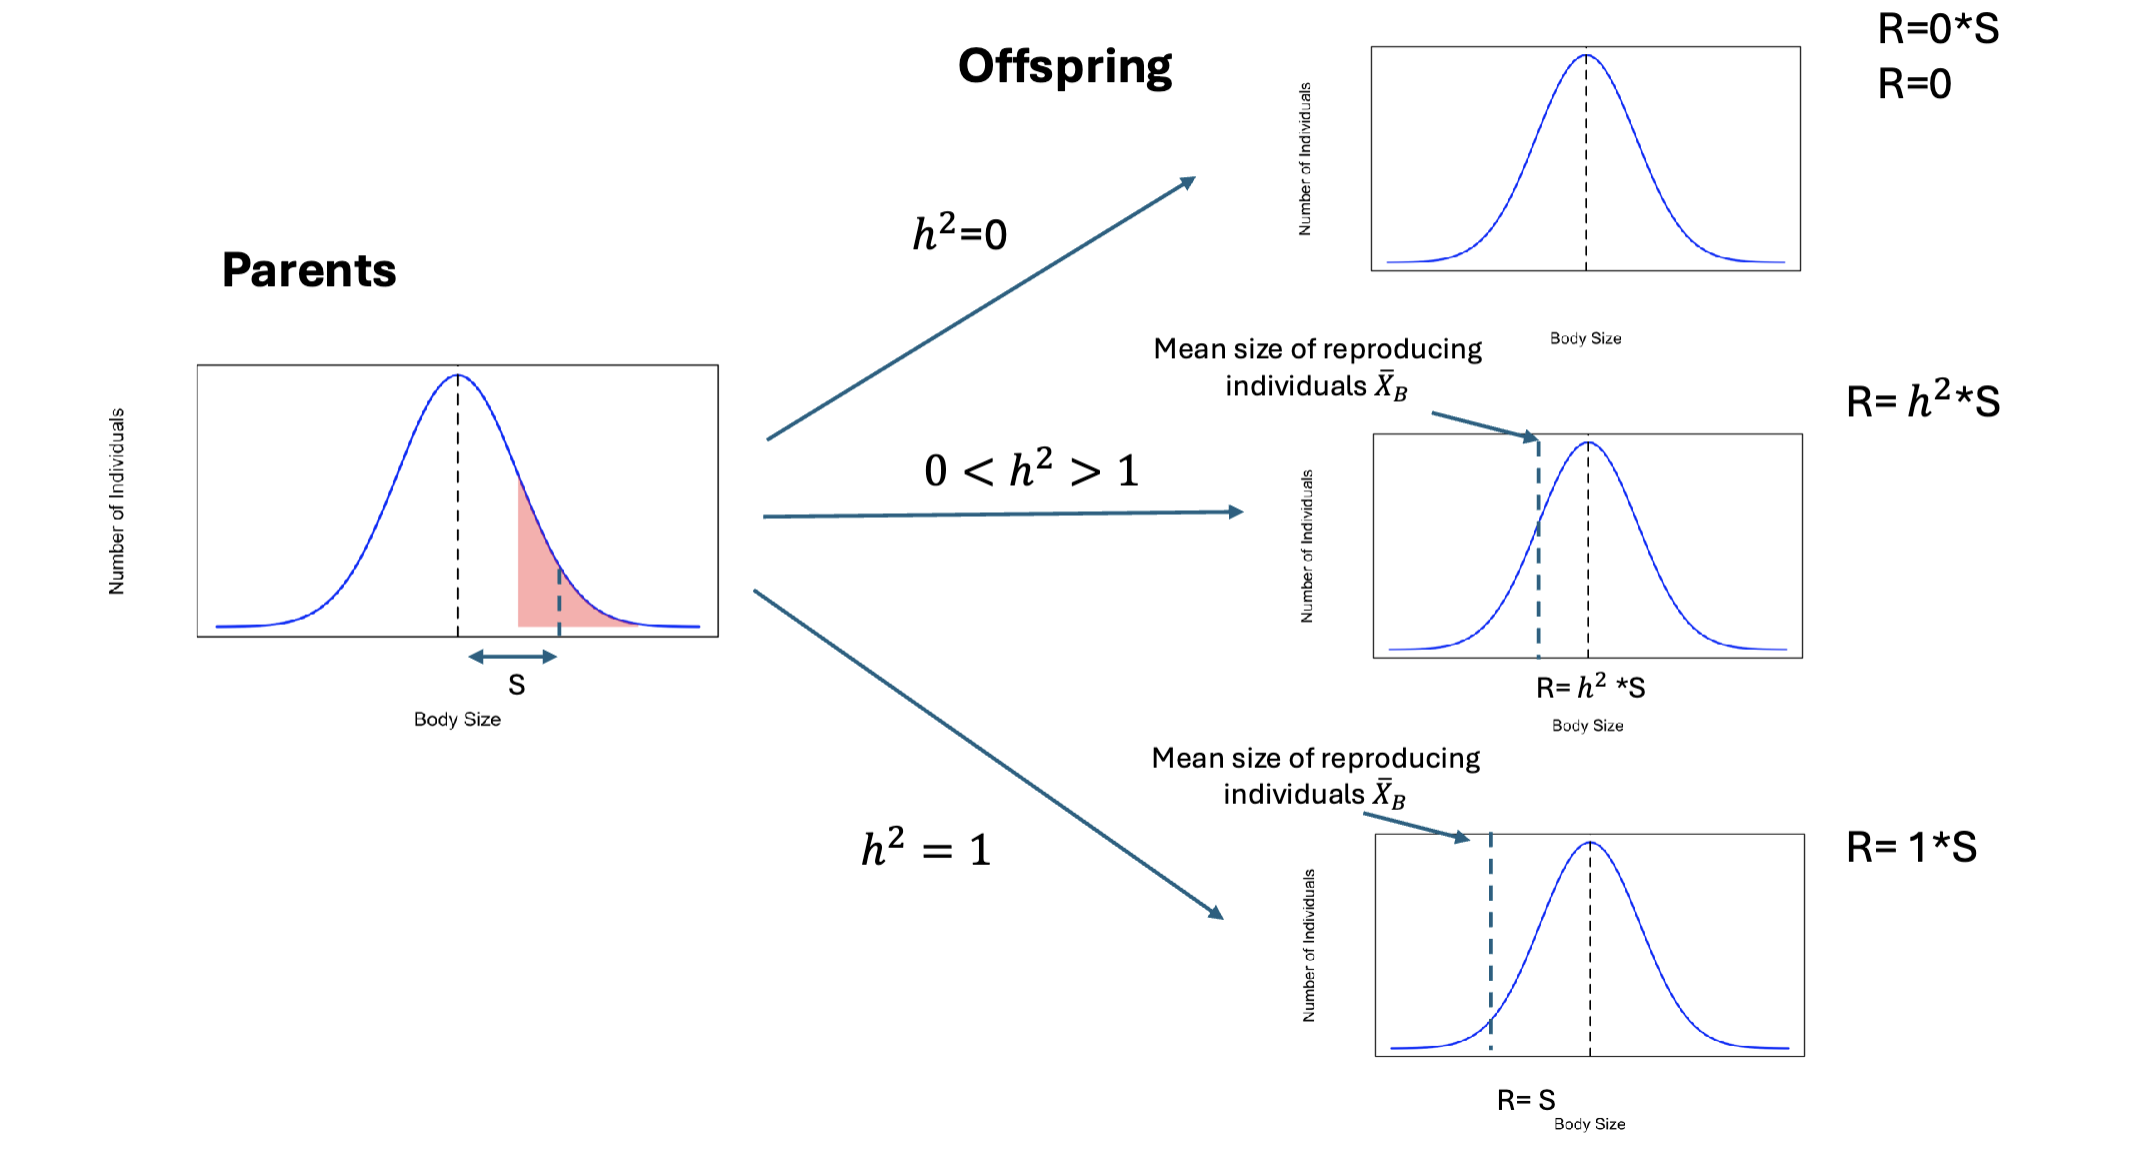
Breeders Equation
R = h2 * S
A population response to selection, it is dependent on heritability (h2) and selection differential (S)
R; response to selection, changes caused by selection between generations
h2; narrow sense heritability
S; selection differentiation, changes caused by selection within a generation
Just because selection is present it does not mean the population will respond!
Limits of selection are?
A lack of genetic variation and genetic correlation are major causes of evolutionary constraints
traits can be related but not one can be favored because they coexist
How do we know which genes contribute to the variation of the trait?
GWAS (Genome wide association study); scan genotype to find which loci is responsible for contributing to the genotype
GWAS has confirmed high polygenicity(influenced by two or genes) of many traits
Quantitative trait locus (QTL) Mapping; is a chromosome region containing at least one gene that contributes to variation in a quantitative trait
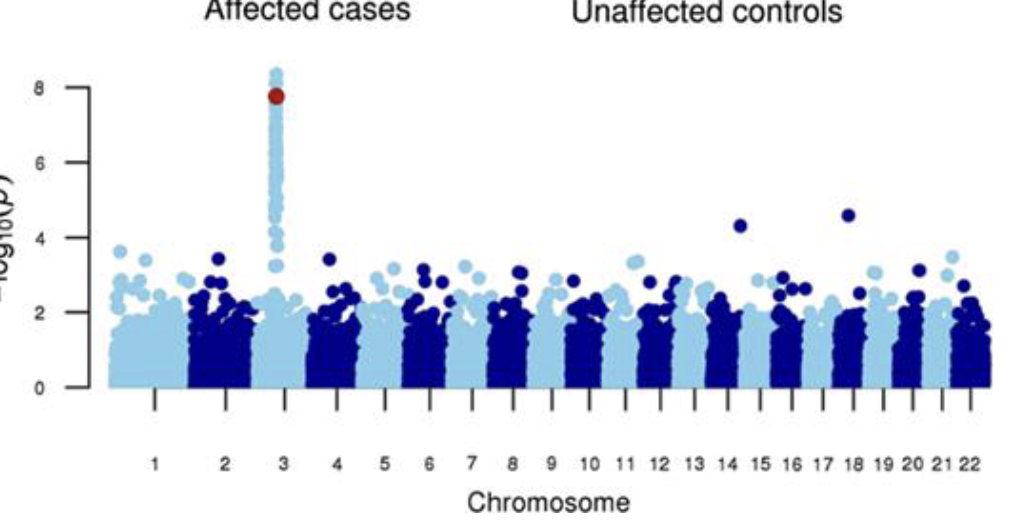
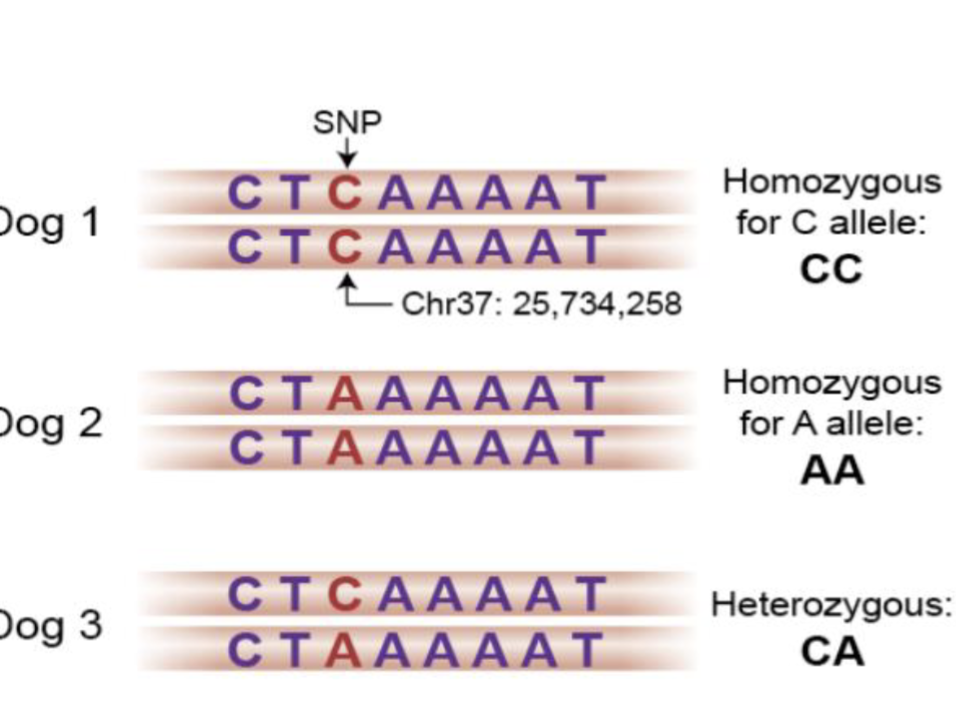
Manhattan Plot
A scatter plot that helps visualize the results of GWAS
The plot helps identify significant SNP’s (single nucleotide polymorphs) and regions of the genome associated with a trait or disease
Polygenic scores
A value summarizing the predicted effect of an individuals genotype on their phenotype
part of using GWAS in health
Application of GWAS in health
Once loci are found to be associated with trait from using polygenic score, we can:
Sequence the DNA of an individual
Add up the effects of each locus
Estimate the probability of developing a particular phenotype
QLT mapping experimental design
spur length seen within a section of the chromosome
What will those chromosomes look like in our F2s if we use our color scheme?
Goal; Identify regions of genome where genotype predicts phenotype
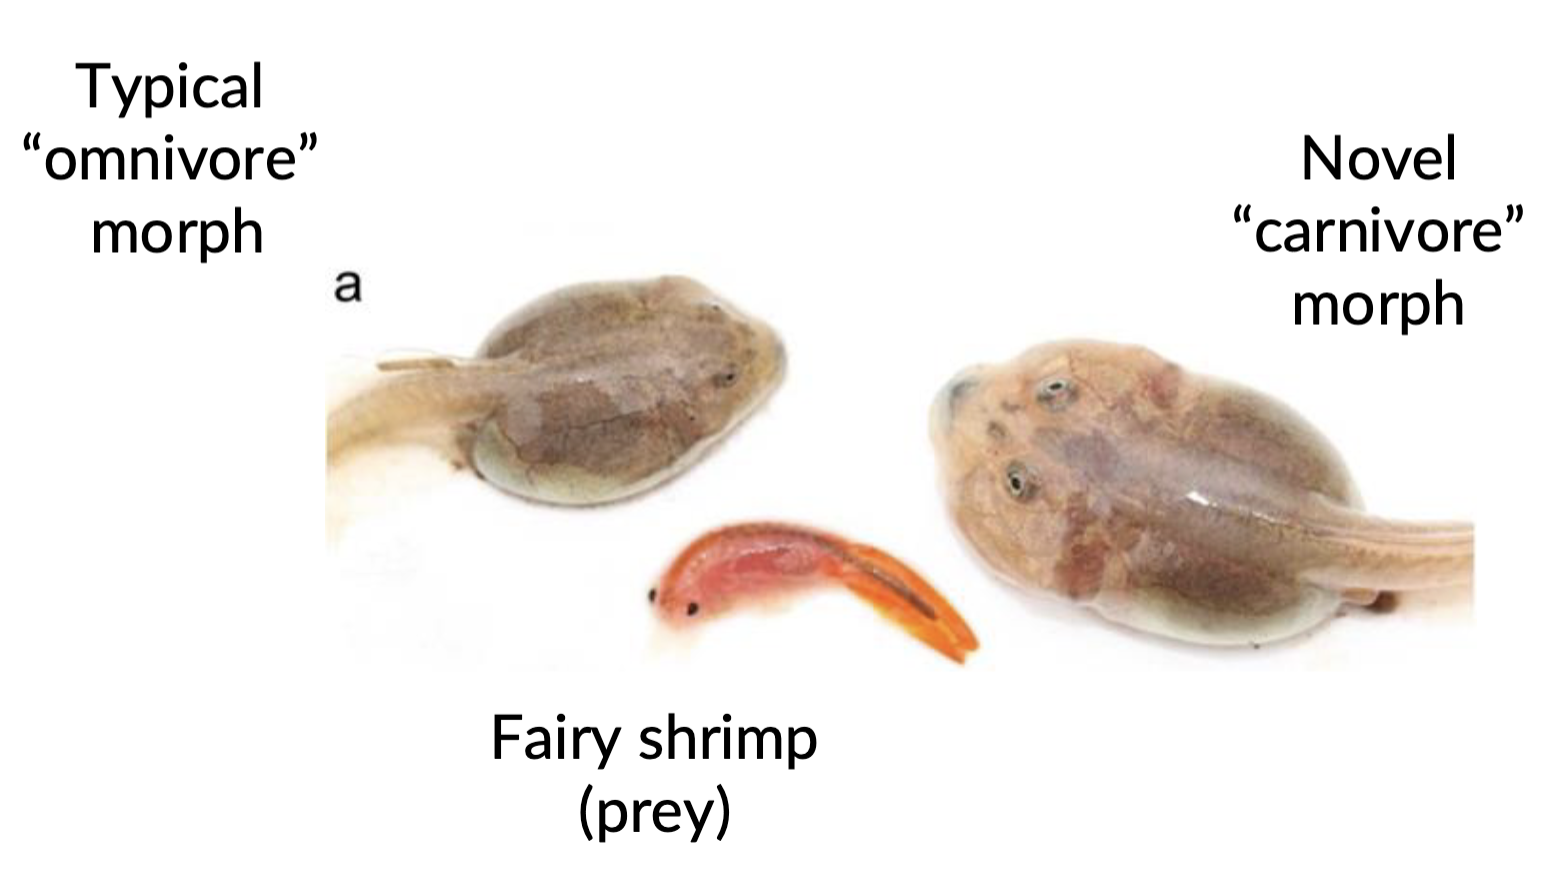
Phenotypic Plasticity
The ability of individuals to produce different phenotypes when exposed to different environmental conditions
ex; tadpoles were fed different diets head size and teeth strength differed
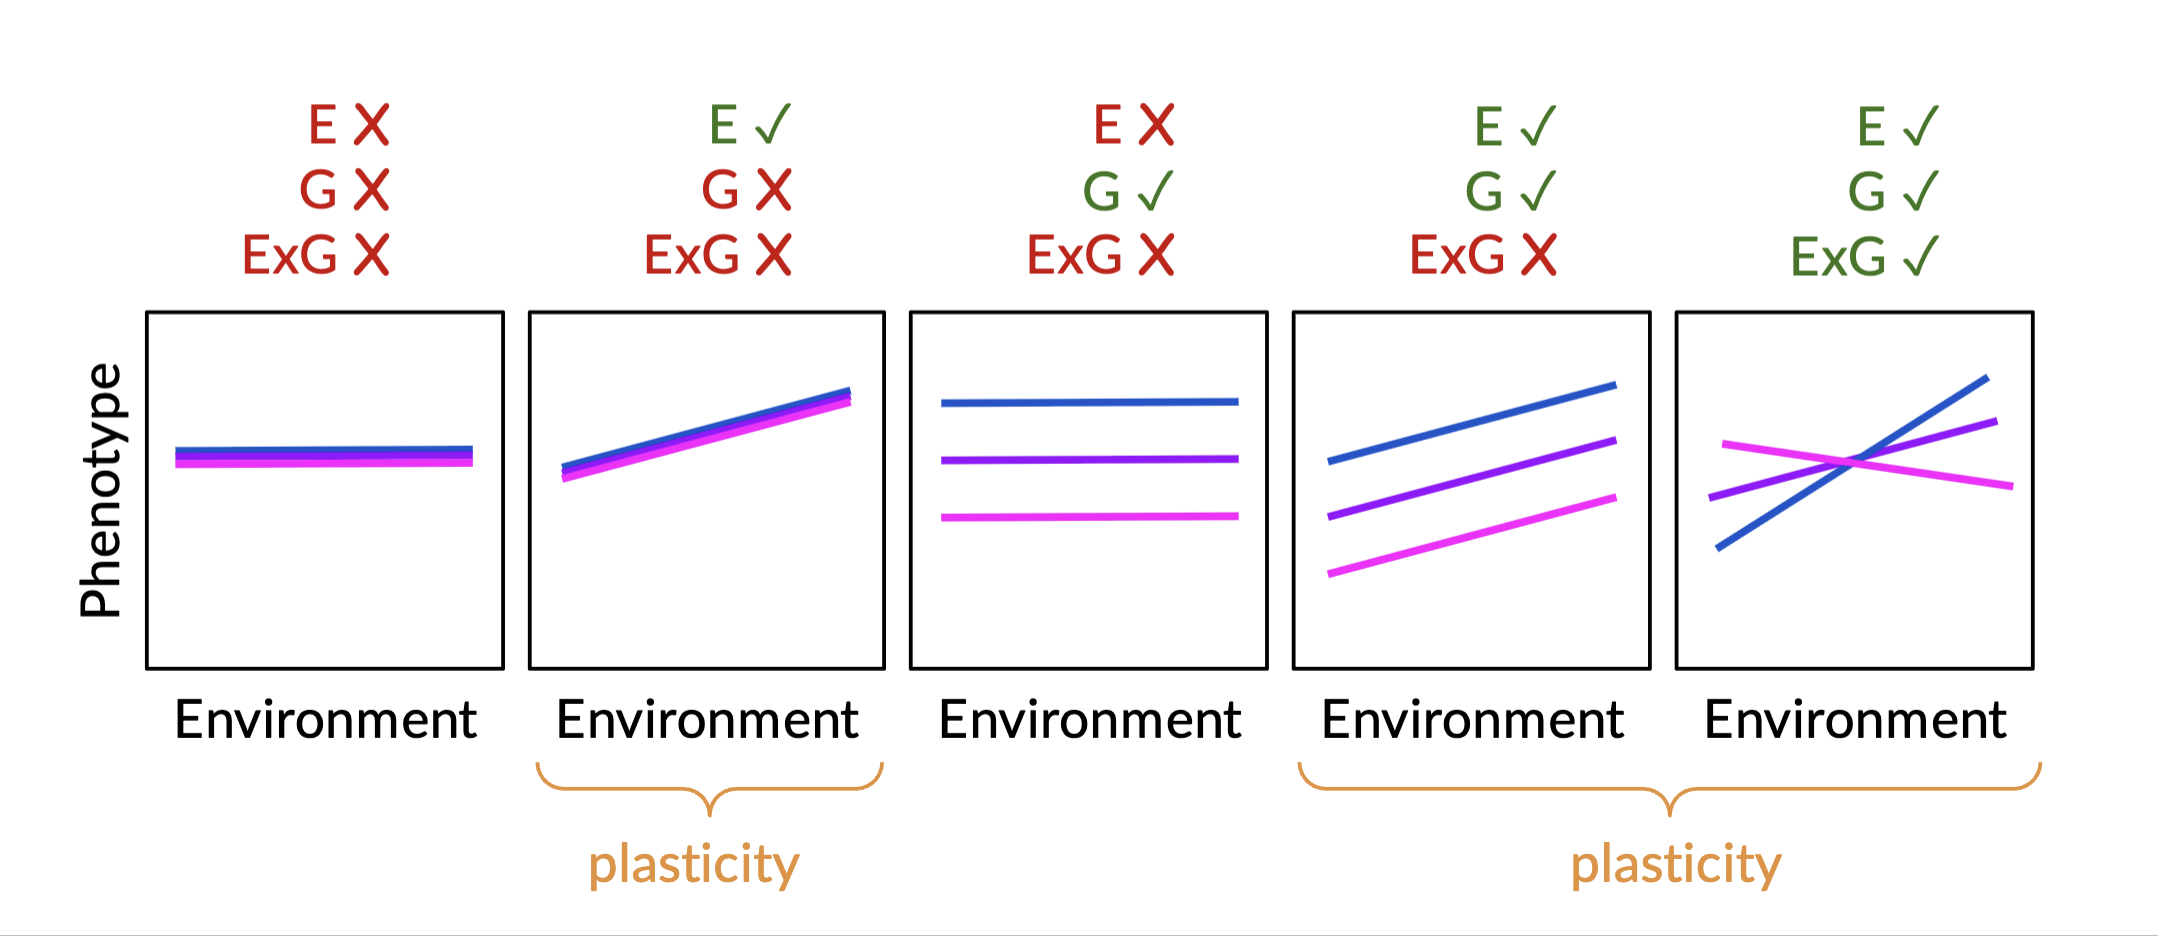
Reaction norm
The range of phenotypes expressed by a genotype along an environmental gradient
Helps us identify whether phenotypic plasticity is present
Overview of Heritability misconceptions
Heritability is not a proportion of phenotype that is genetic, but rather the proportion of phenotypic variance in a pop. that is due to additive genetic variance
High heritability does not imply genetic determinism
Heritability are not constant (they can change)
High heritability does not imply genes of large effects
Heritability is a population parameter, therefore it depends on population specific factors
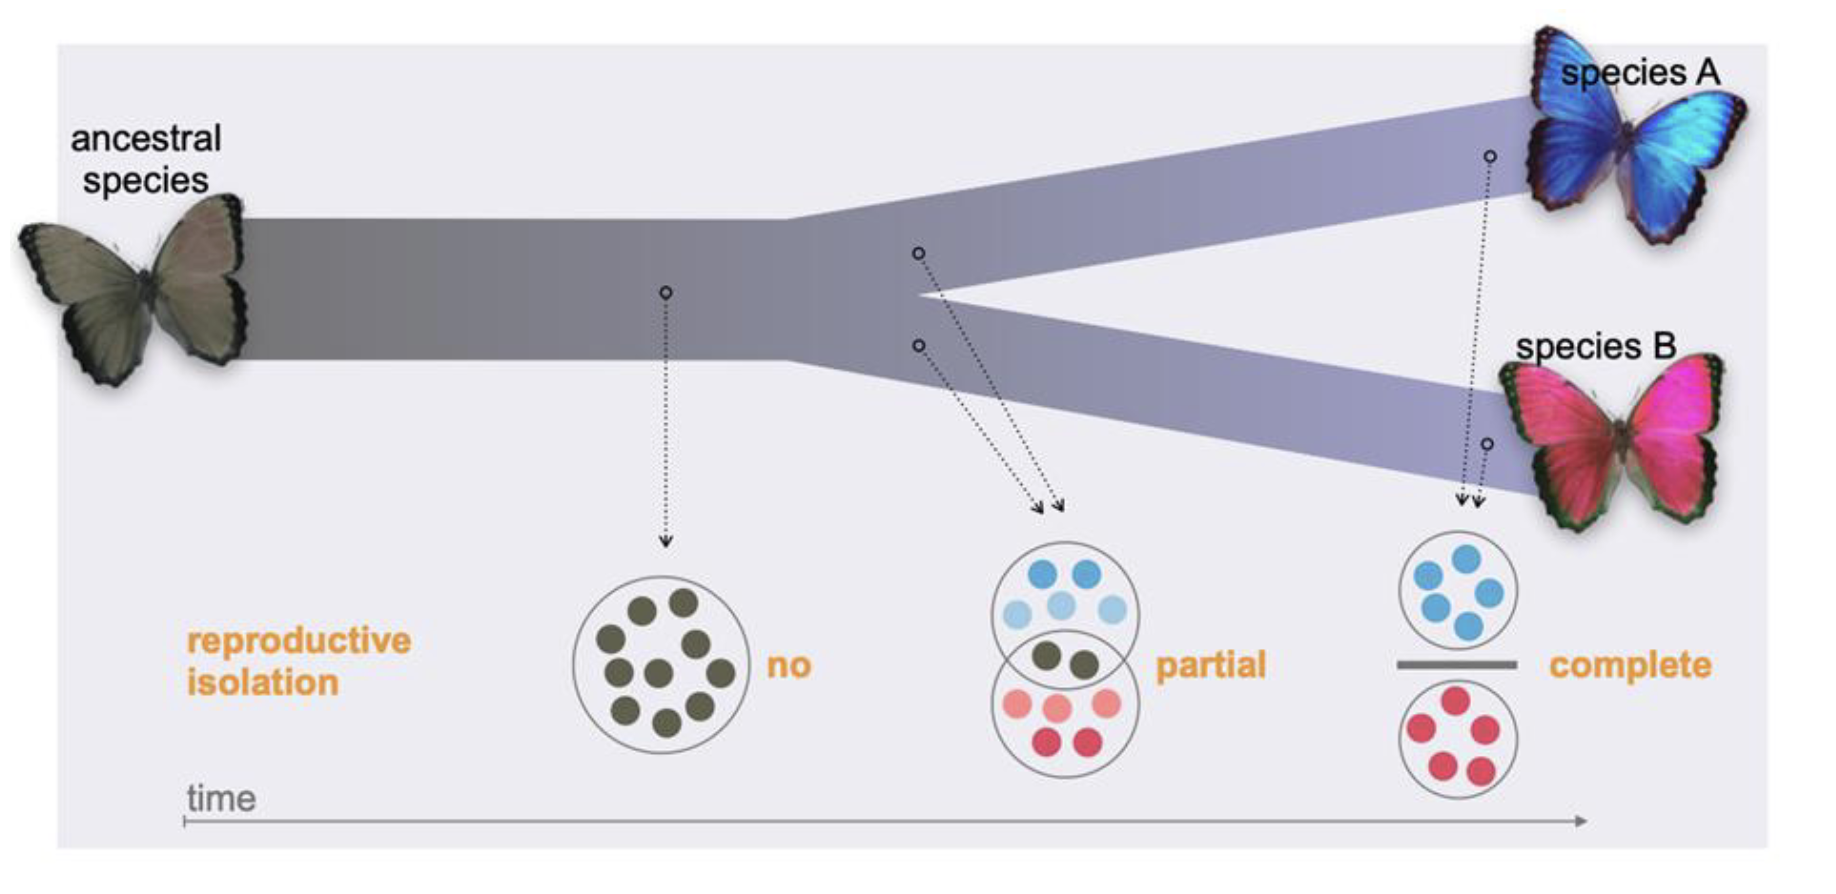
Speciation
Evolution of reproductive isolation within an ancestral species, resulting in two or more descendant species
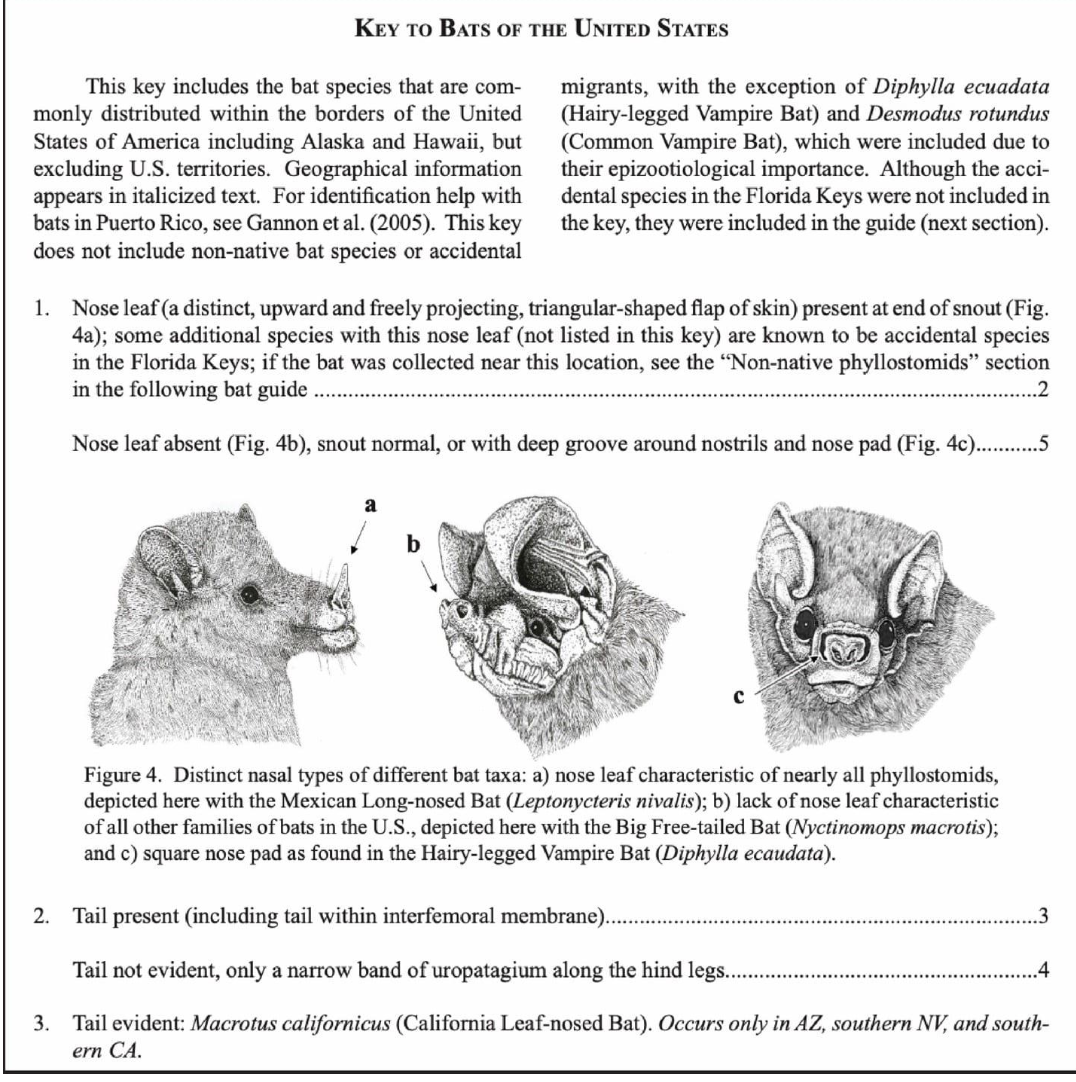
Taxomony
Formal naming system
Species delimitation(separation of 2 distinguishing species)
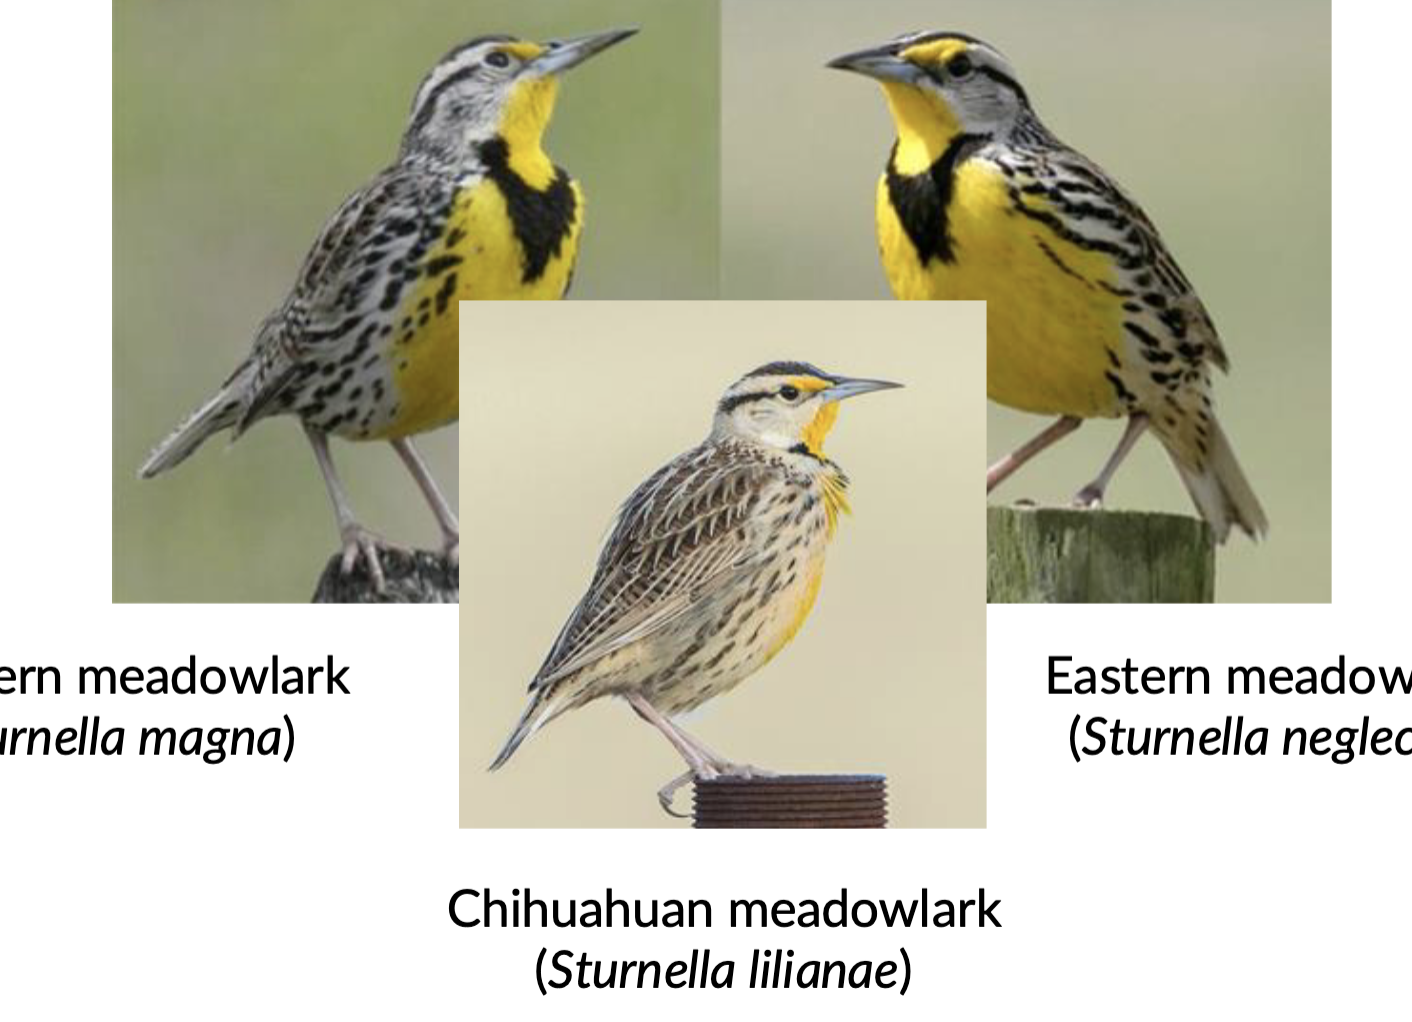
Cryptic species
Two or more species that are morphologically indistinguishable but genetically distinct, often requiring molecular analysis to differentiate them
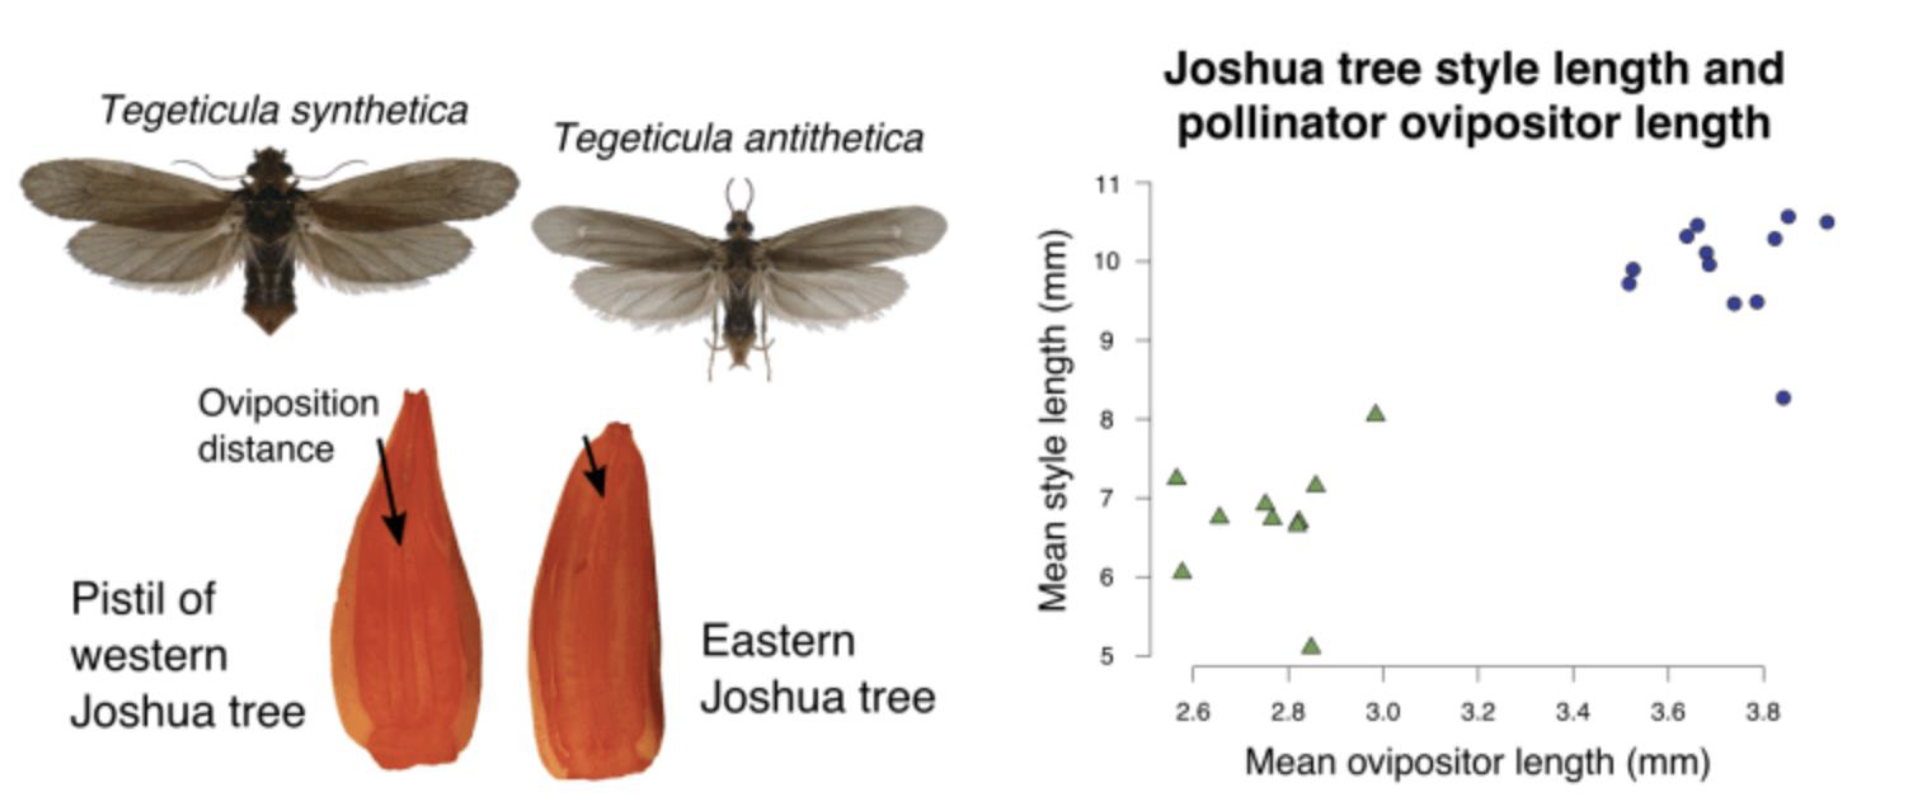
Joshua Tree
Two different species of tree, it was found due to the differences of moths pollinating the tree
style and ovipositor length different within two species of moth
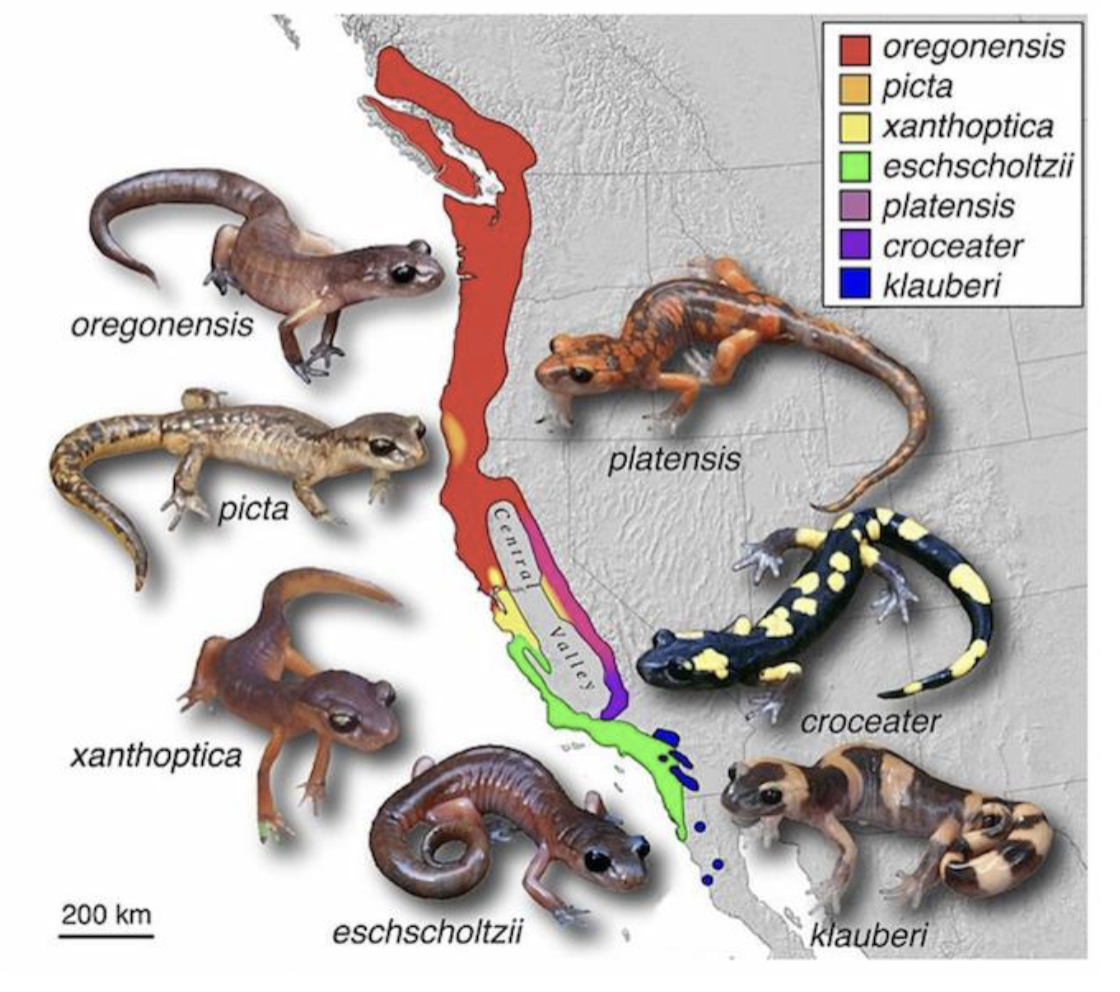
Ring Species
A chain of interbeeding populations that forms a loop
The population at the end of the loop are reproductively isolated but can interbreed with populations alongside them
More reproductively isolated as distance increases
Why do we use species concepts?
to define species, it includes;
Morphological
Biological
phylogenetic
Morphological Species Concept
A species is a group of organisms that look similar to each other and are distinct from other groups of organisms
Limitations:
Cryptic species; different species can have similar morphology
Same species can vary in morphology
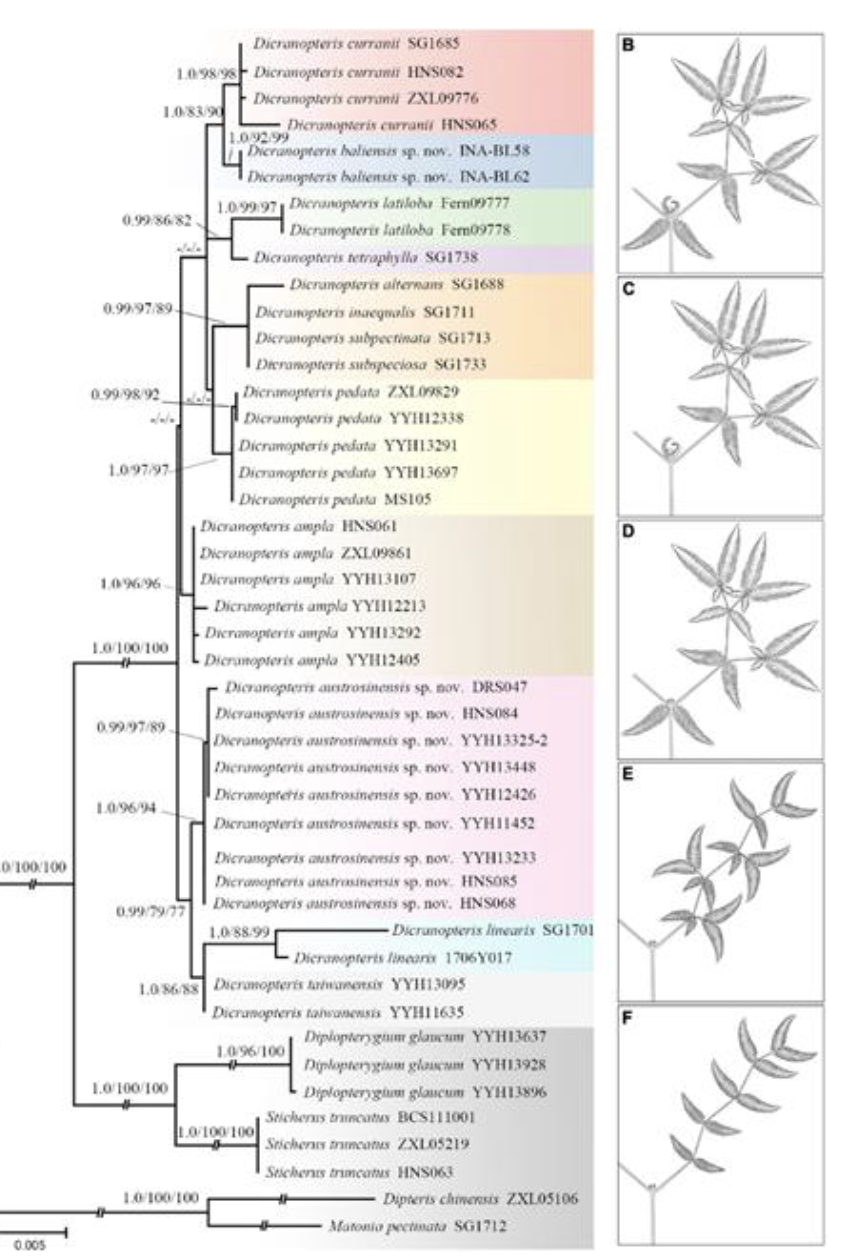
Phylogenetic Species concept
A species in a group of organisms that share a pattern of ancestry and descendants that form a single branch of life
Smallest monophyletic group of organism
Limitations:
We decide the threshold of what makes a species
Cannot be used in isolation
Biological species concept
A species is a group of organisms that are reproductively isolated from other species
these organisms can interbreed and form fertile offspring
Limitations:
Cannot test extinct species
Would they mate in the wild? or are we forcing them to reproduce?
Morphological species concept pros and cons
Cons:
Some species are diverged but look identical
Some species have a lot of intraspecific variation
Pros:
Easy
Works with fossils
Phylogenetic species concept pros and cons
Pros:
Reflects evolutionary history
Works for asexual species and cryptic species
Cons:
Cutoff is very subjective
Can recognize too many species
Needs sequence data
Biological species concept pros and cons
Pros:
Reproductive isolation is biologically relevant
Cons:
Limited to sexual organisms
Cannot deal with fossils
Complicated by hybridization
Why care about defining species?
Human Health
Understanding which species transmits malaria (+ other diseases) to protect human health
Use ecological interactions to target species to reduce populations
Biodiversity Monitoring
To monitor and further protect species who are vulnerable, we must differentiate them
Can easily confuse and aid species who do not require additional assistance if it resemble species
Endangered species act
Lists species as endangered or threatened
Monitoring and species assessment
Establishes protections for listed species
Species recovery
Barriers to Gene Flow
Reproductive Barriers:
Before fertilization (Ecological, Behavioral)
After mating, before fertilization
After fertilization
Geographic barriers ( allopatry)
Gene flow ceases
Divergence begins
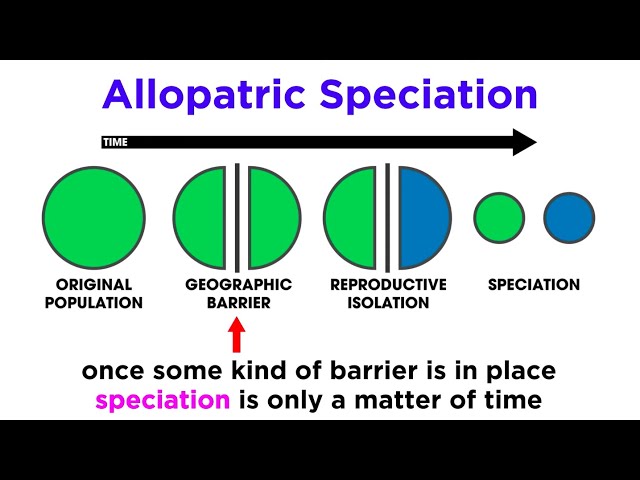
Allopatry
where populations are geographically isolated and cannot interbreed due to this separation
Geographic Barriers (Allopatry)
Types of allopatry:
Vicariance; geographic barrier divides a population
Dispersal; individuals from one population colonize another region

Sympatry
Speciation occurs in same geographical space
Species are more genetically different
important barrier to gene flow is pre-zygotic isolation
Speciation in Sympatry:
Before mating barrier
Pre-zygotic barrier #1
Closely related species don’t naturally mate due to ecological or phenological barriers
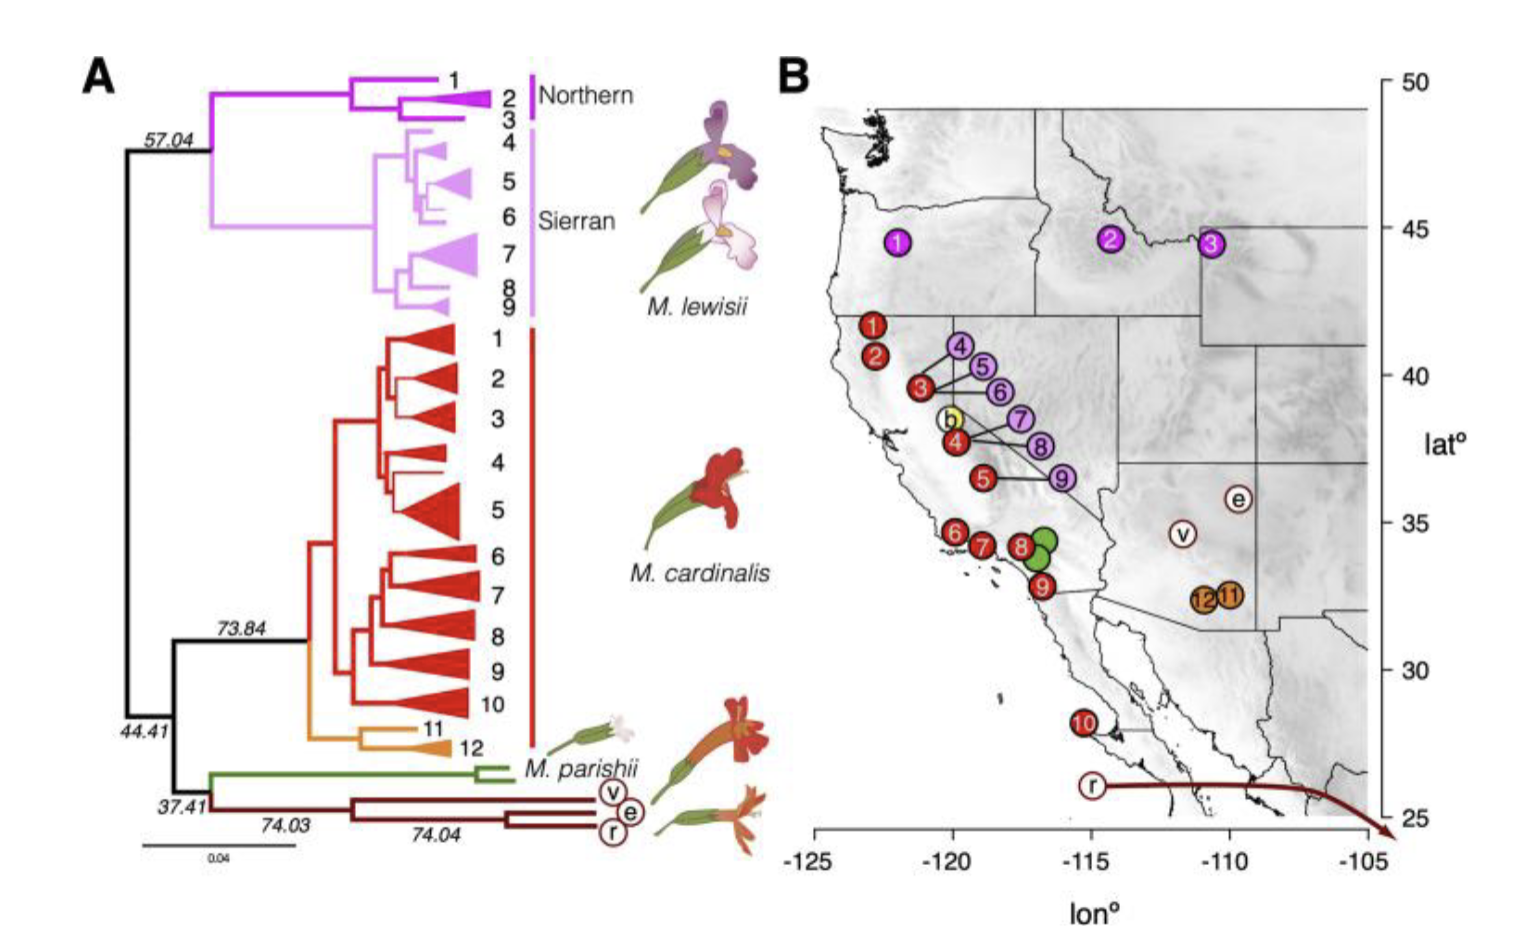
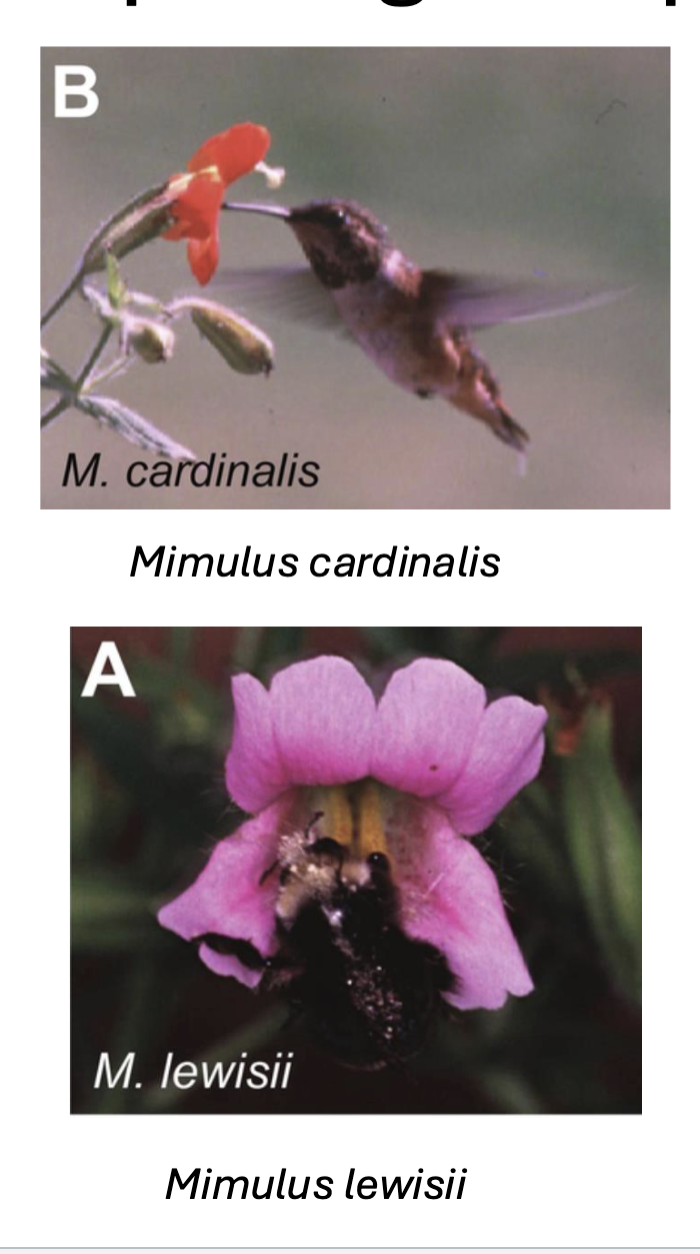
Ex: monkey flowers different pollinators ( hummingbird and bee) do not interact or transport pollen therefore no gene flow —> speciation
Is Monkey flowers two different species?
Biologically:
Yes! in the lab they do breed and produce viable offspring
No! they naturally do not breed
Morphological:
Yes! Different species have different characteristics,
Bee pollinated
Landing pads
two yellow ridges to help brush pollen onto bee
Hummingbird pollinated:
more nectar (for hummingbird)
Lack of landing pads
has a longer, narrow tube
Phylogenetic:
Yes! They form separate monophyletic groups
Speciation in Sympatry:
Post Mating, before fertilization
Closely related species can mate, but matings fail to give rise to fertilized eggs
Types:
Female choice:
Females don’t fertilize eggs after copulation
Gametic Incompatibility
Occurs when sperm or pollen from one species fails to penetrate and fertilize the eggs of another speies
Speciation in Sympatry:
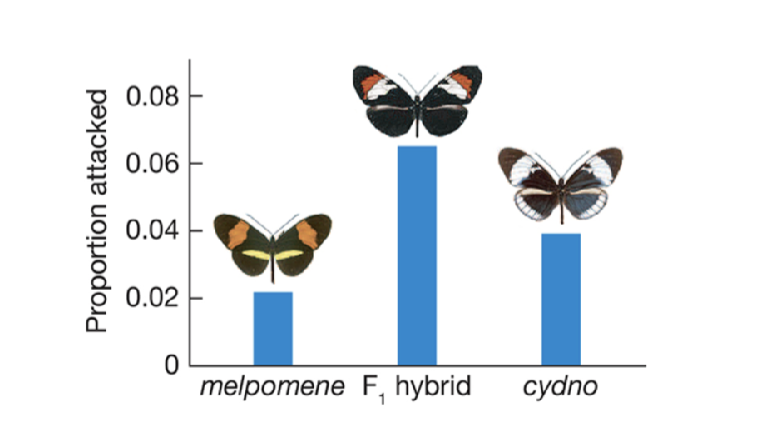
Postzygotic
Bateson-Dobzhansky-Muller Incompatibilities:
Molecular incompatibilities that arise when the genome of two species are combined in hybrid offspring
Hybrid can have lower fitness, or is born infertile
Hybrid does not persist due to being pursued by predators
Reinforcement
The evolution of stronger pre-zygotic isolation because of selection against low-fitness hybrids
Mechanisms in place to prevent hybrids from occurring —> reinforces isolation
How does speciation happen?
Some sort of barrier that restricts gene flow
typically geographic
Genetic divergence between species
Evolution of genetic and phenotypic differences- adaptation to new ecological conditions
Reproductive isolation
Sexual reproduction
Reproduction where gametes (haploid sex cells) combine to form a diploid zygote
Sex
Classification based on differences in gamete size
Male: smaller (generally more mobile) gamete
Female: larger (more sessile) gamete
History of reproduction
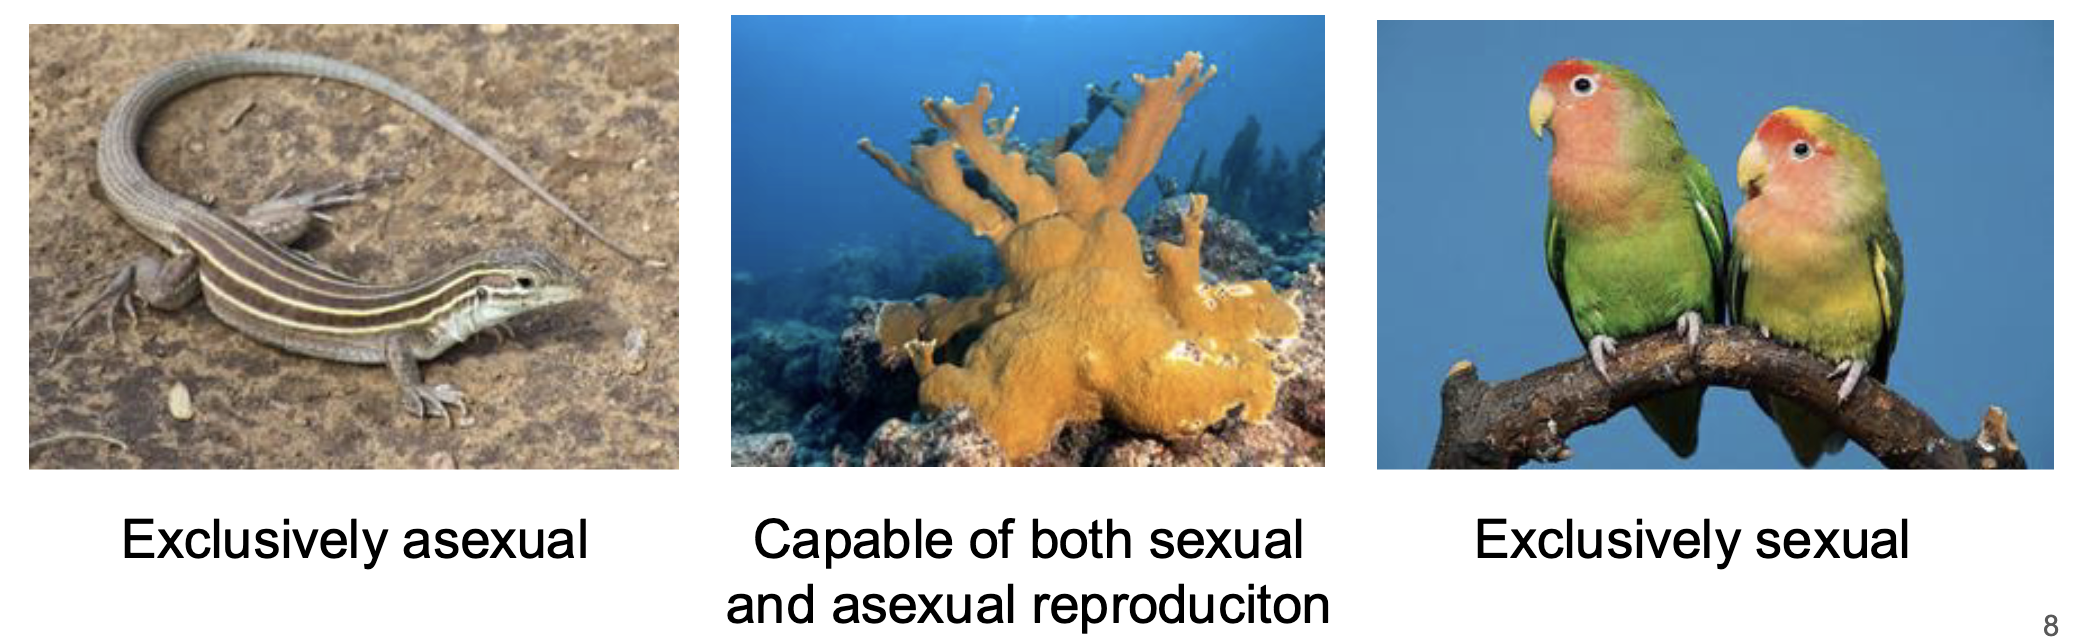
Life started out reproducing asexually
sexual reproduction is ~1 billion years old
many reversions to asexuality have occurred

All living organisms reproduce, however not all living organisms reproduce sexually
True
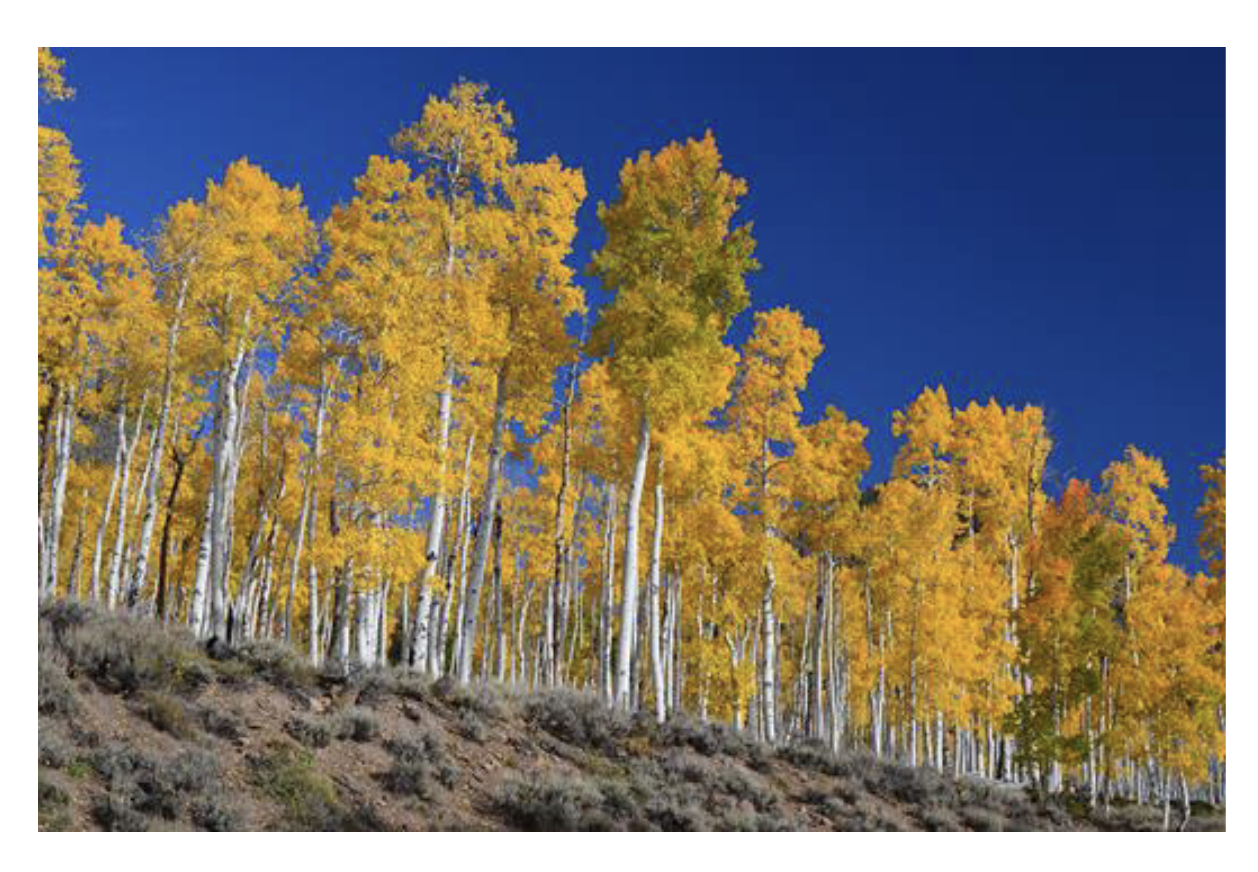
Asexual reproduction
A mode of reproduction that produces offspring from a single parent, resulting in genetically identical copies of the parent
ex: Pando, 47,000 trees in Utah are clones of one single individual
Not all sexual species have different gametes
True
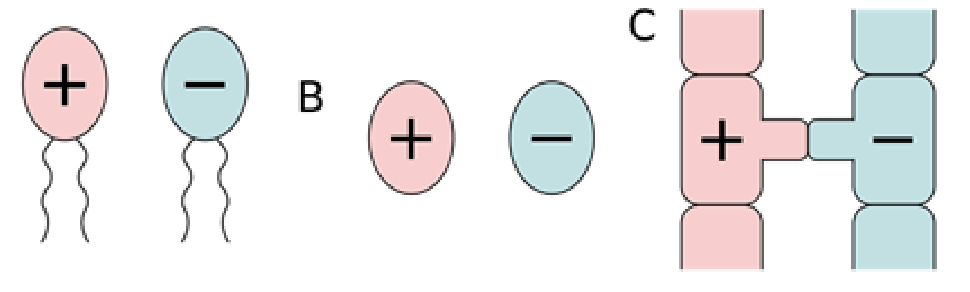
Isogamy
Sexual reproduction by the fusion of similar gametes
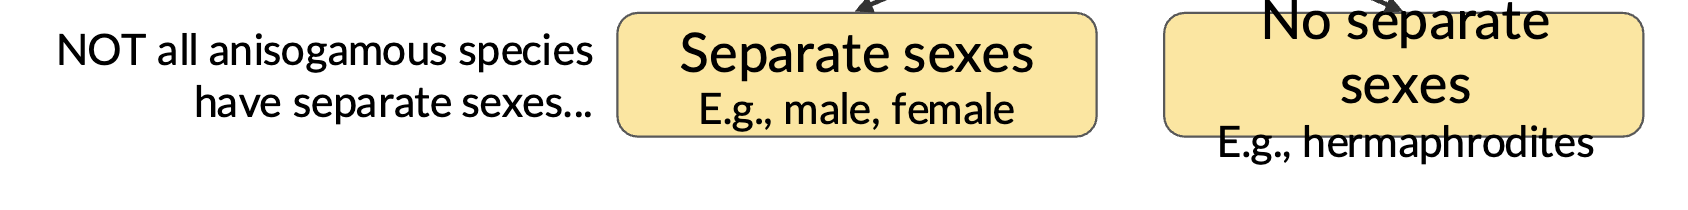
Anisogamy
Sexual reproduction by the fusion of dissimilar gametes
can have separate sexes ( female or male)
can have no separate sexes (hermaphrodites)
Organisms that reproduce sexually cannot reproduce asexually
True
Not all anisogamous species have separate sexes
True
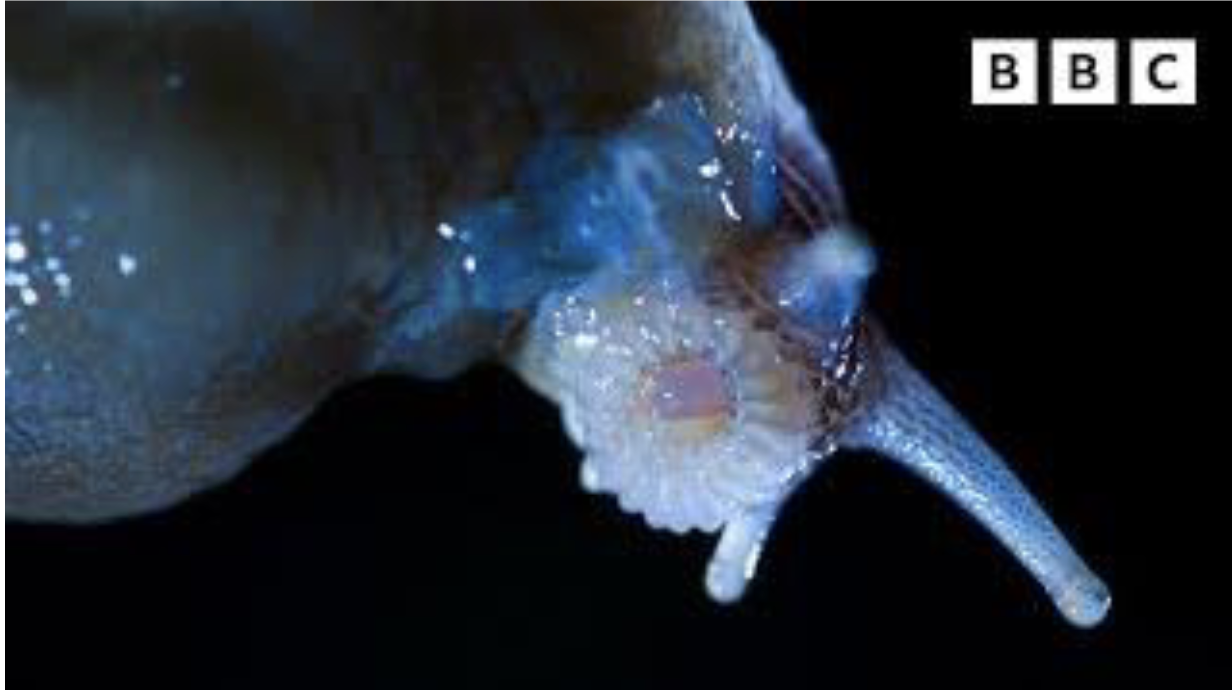
Individuals in some hermaphroditic species play equal roles in mating while individuals in other species do not
True
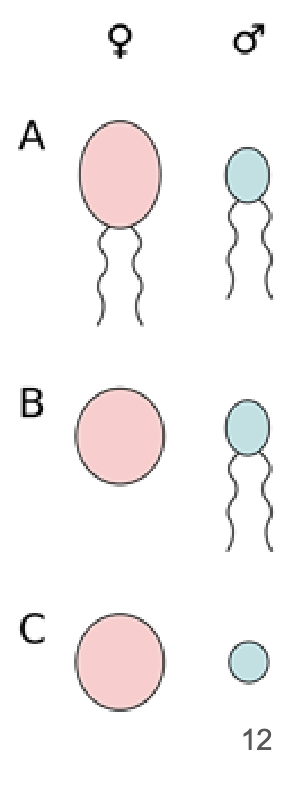
Not all species with separate sexes are sexually dimorphic
Monomorphism
Sexual dimorphism
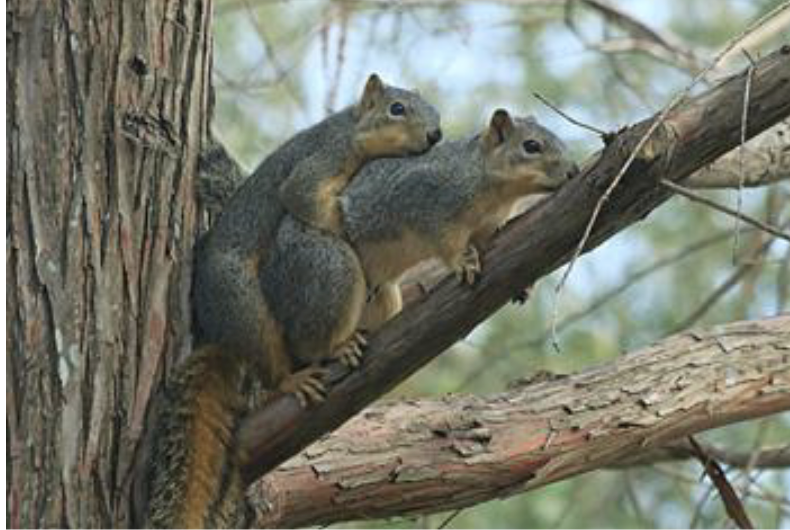
Monomorphism
A situation in which males and females of the same species appear physically identical, with little to no sexual dimorphism
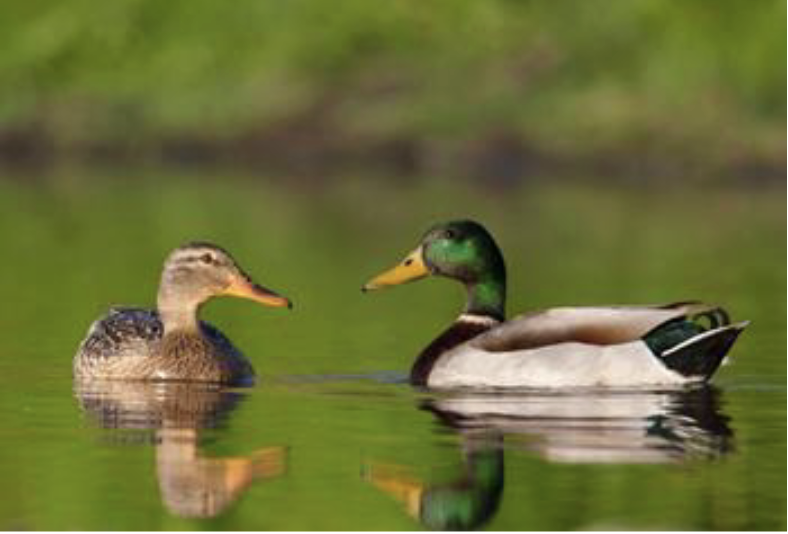
Sexual dimorphism
Refers to the differences in physical appearance between males and females of the same species
How prevalent is sexually reproduction iin animals and plants?
>90%
Most eukaryotes reproduce sexually
Among eukaryotes, sex is common but not universal
Asexual lineages are by large evolutionary dead ends
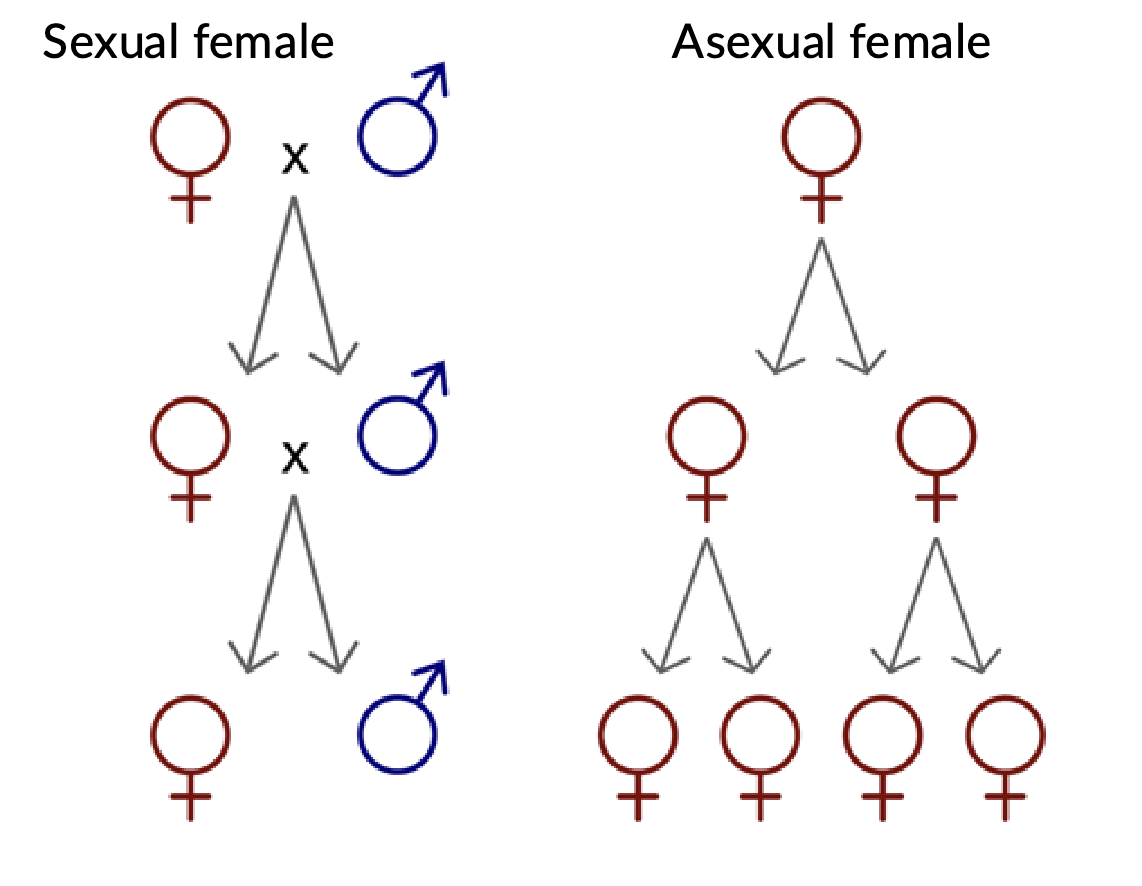
Cost of sexual reproduction
Two-fold cost of sex
sexual individuals produce 50% less number of offspring than asexual reproduction
Reduced relatedness
Sexual reproduction only passes down 50% of genetic material to offspring, yet sexual reproduction passes 100% of genetic material to offspring’s
Search Cost
Sexual reproduction takes time to find a suitable mate
Costly if population is small, it will become harder to search for a mate
Risk of sexually transmitted disease
ex: rabbits transmit syphilis
koala suffers with chlamydia
Benefits of Sexual Rproduction
Generation of novel genotypes
Recombination occurs and generate novel traits
Promotes fixation of beneficial alleles
By eliminating interference competition
By separating them from deleterious load
Faster evolution
Species must constantly adapt and evolve to survive against evolving competing species
Clearance of deleterious mutations
An important result of sexual reproduction is that deleterious alleles can be eliminated by recombination
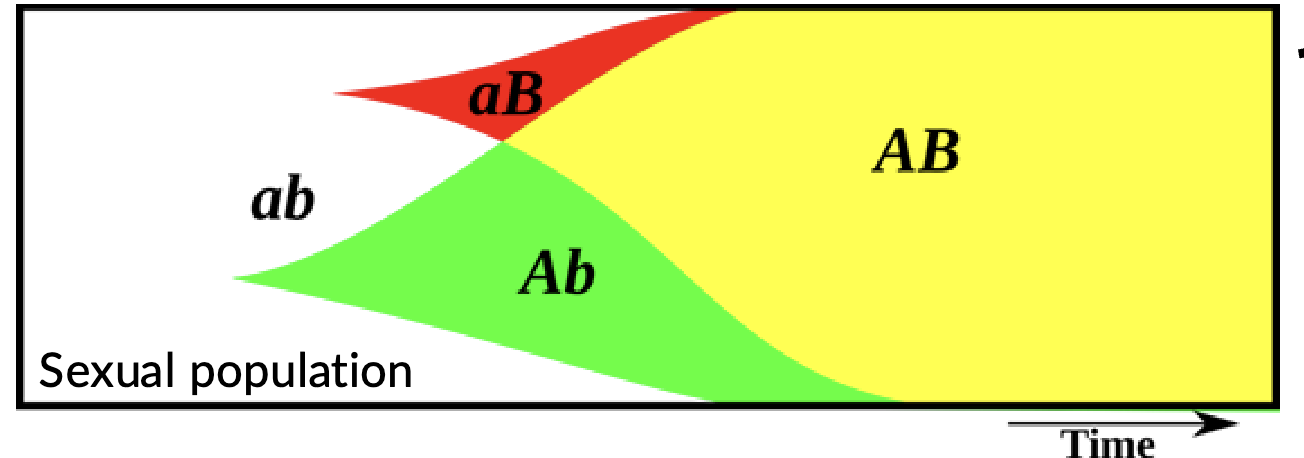
Fisher muller effect
Sex, through recombination, eliminates competition among beneficial mutations that have arisen in different genetic backgrounds
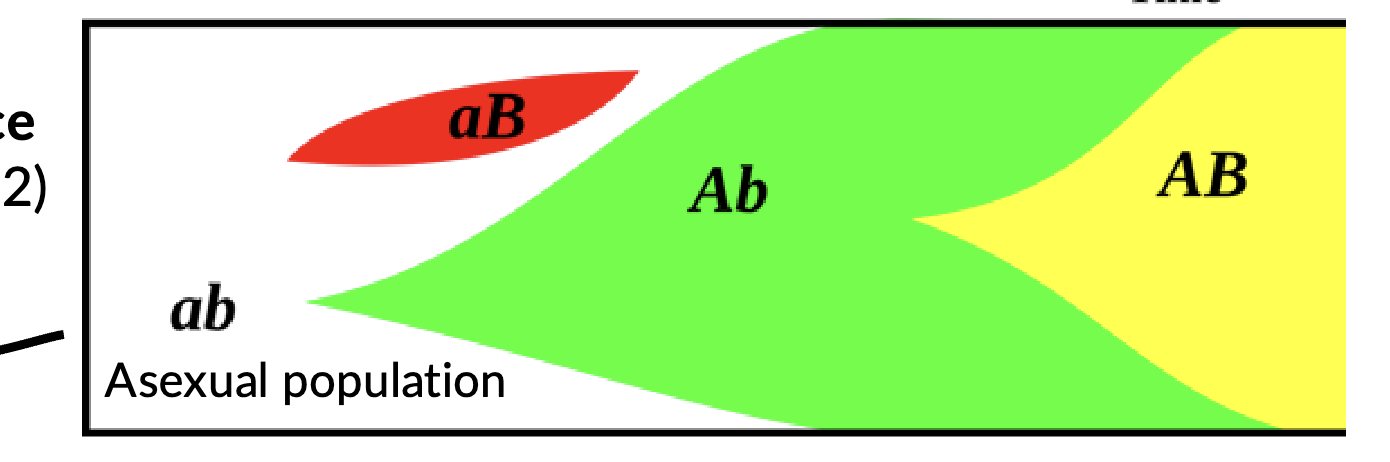
Clonal interference
In asexual reproscution, where different beneficial mutations arise in separate lineages and compete with each other, potentially hinder the fixation of beneficial alleles
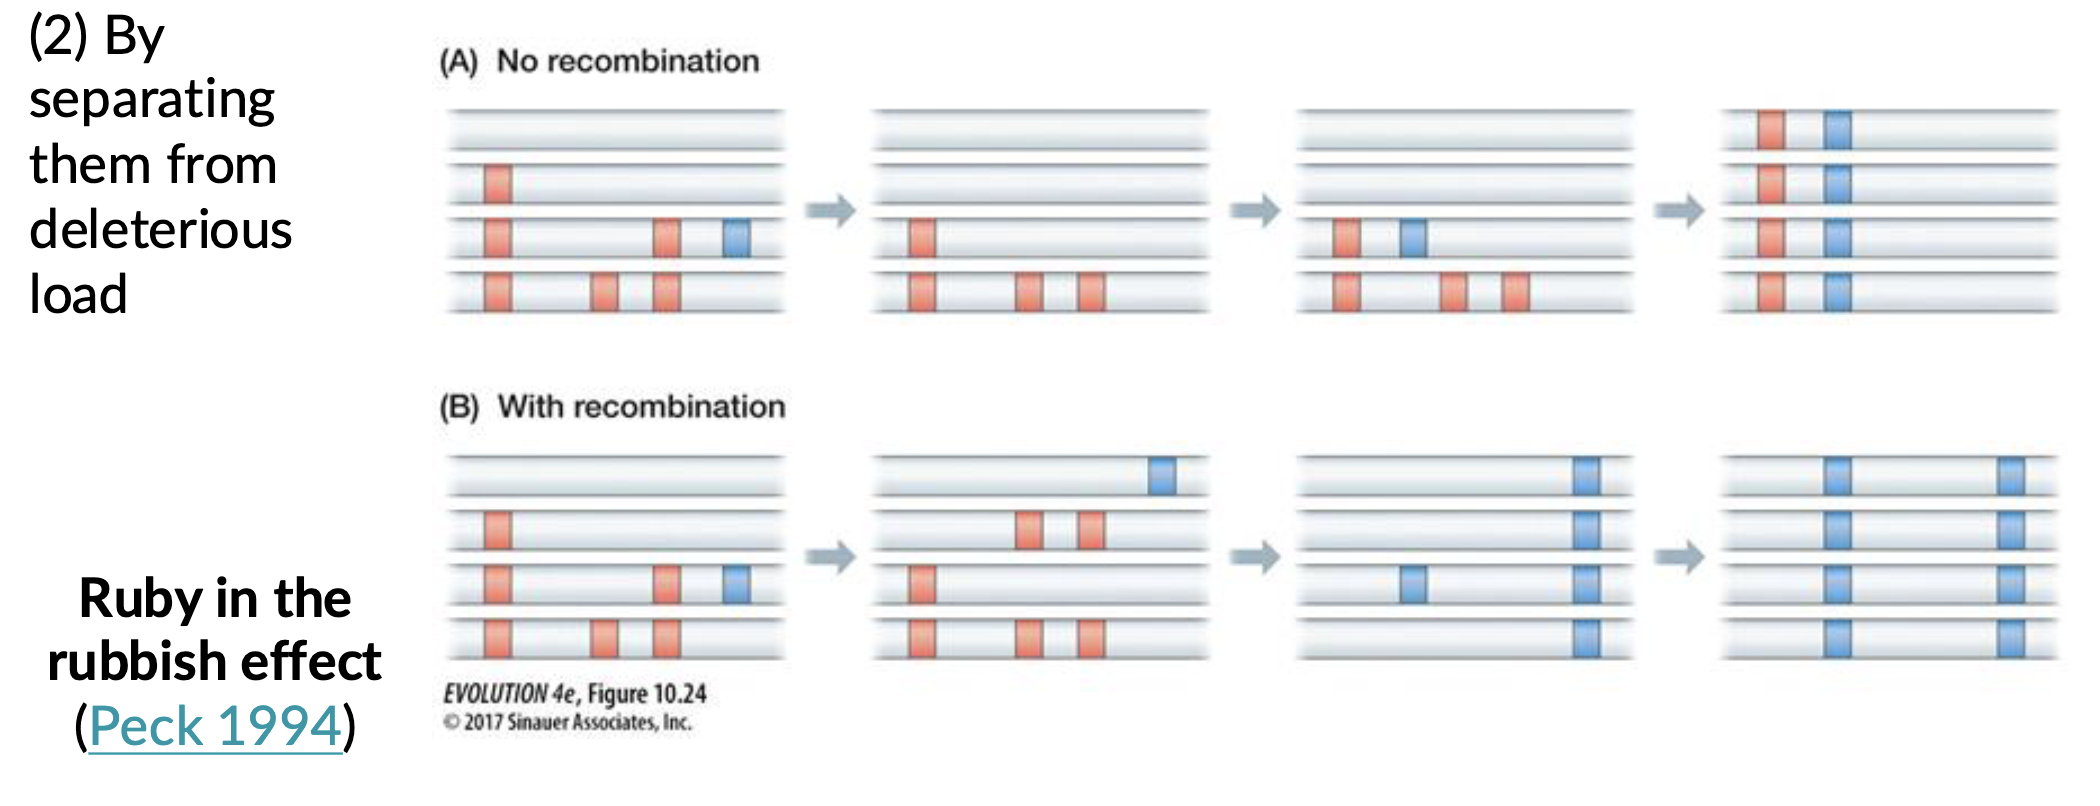
Ruby in the rubbish
beneficial mutations often appear on genetic backgrounds loaded with segregating deleterious mutations
Shuffling genome, separates beneficial alleles from deleterious alleles
Without recombination deleterious alleles can become linked with beneficial alleles
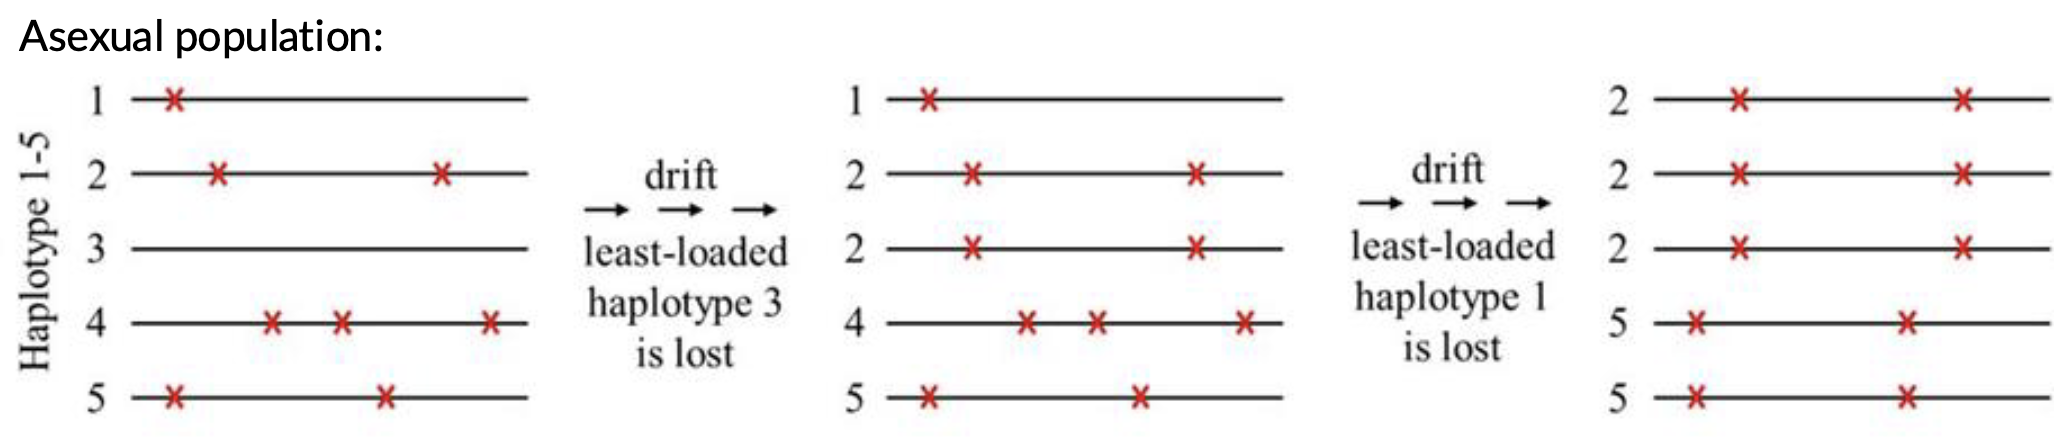
Muller’s ratchet
A theoretical concept in evolutionary genetics that describes how deleterious mutations can accumulate in a non-recombining asexual population over time, ultimately leading to a decline in overall fitness
What is the primary force causing disadvantages in asexual populations?
lack of recombination
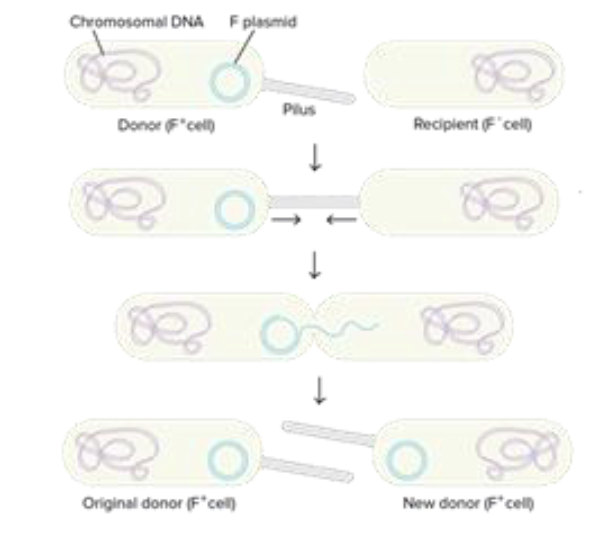
Horizontal gene transfer
exchange of genetic material with one another
how do asexual species persist?
Some rotifers use gene transfer with bacteria, explaining 100 millions years of survival
yet asexual reproduction leads to short lived lineages
Some species have both sexual and asexual reproductive strategies
Arrhenotoky
Asexual and sexual reproductive stages
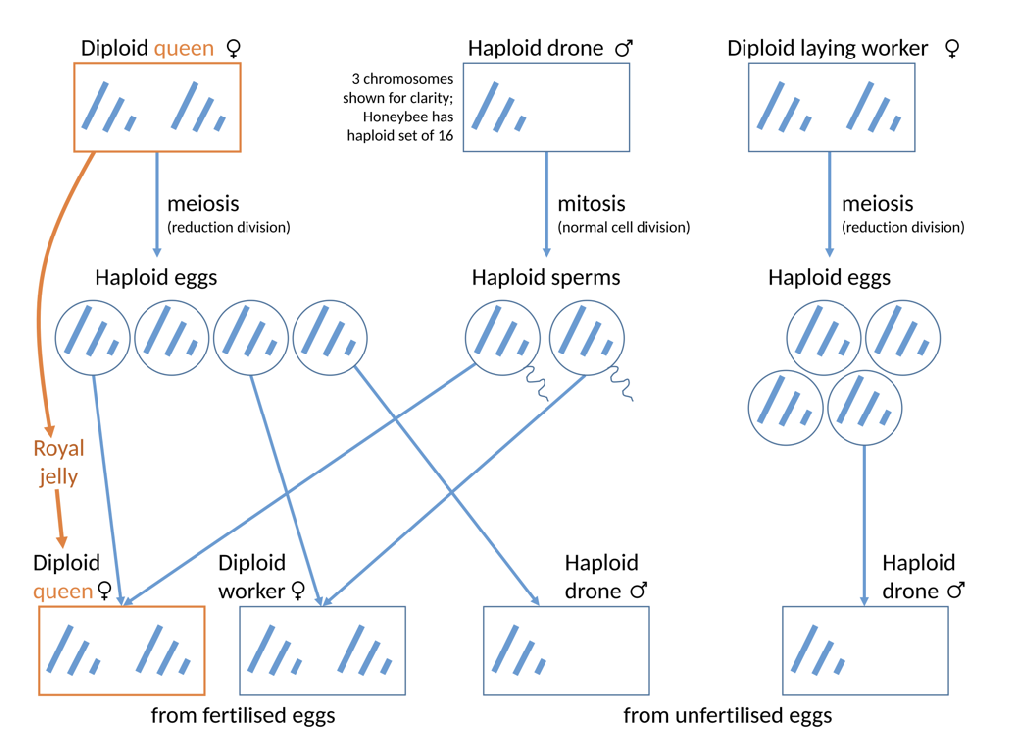
Arrhenotoky
Haploid-diploid sex determination
females: diploids
males: haploids
Asexual and sexual reproductive stages
Transitions from asexual to sexual during lifetime