Why Maps Matter exam 1
1/66
There's no tags or description
Looks like no tags are added yet.
Name | Mastery | Learn | Test | Matching | Spaced | Call with Kai |
|---|
No analytics yet
Send a link to your students to track their progress
67 Terms
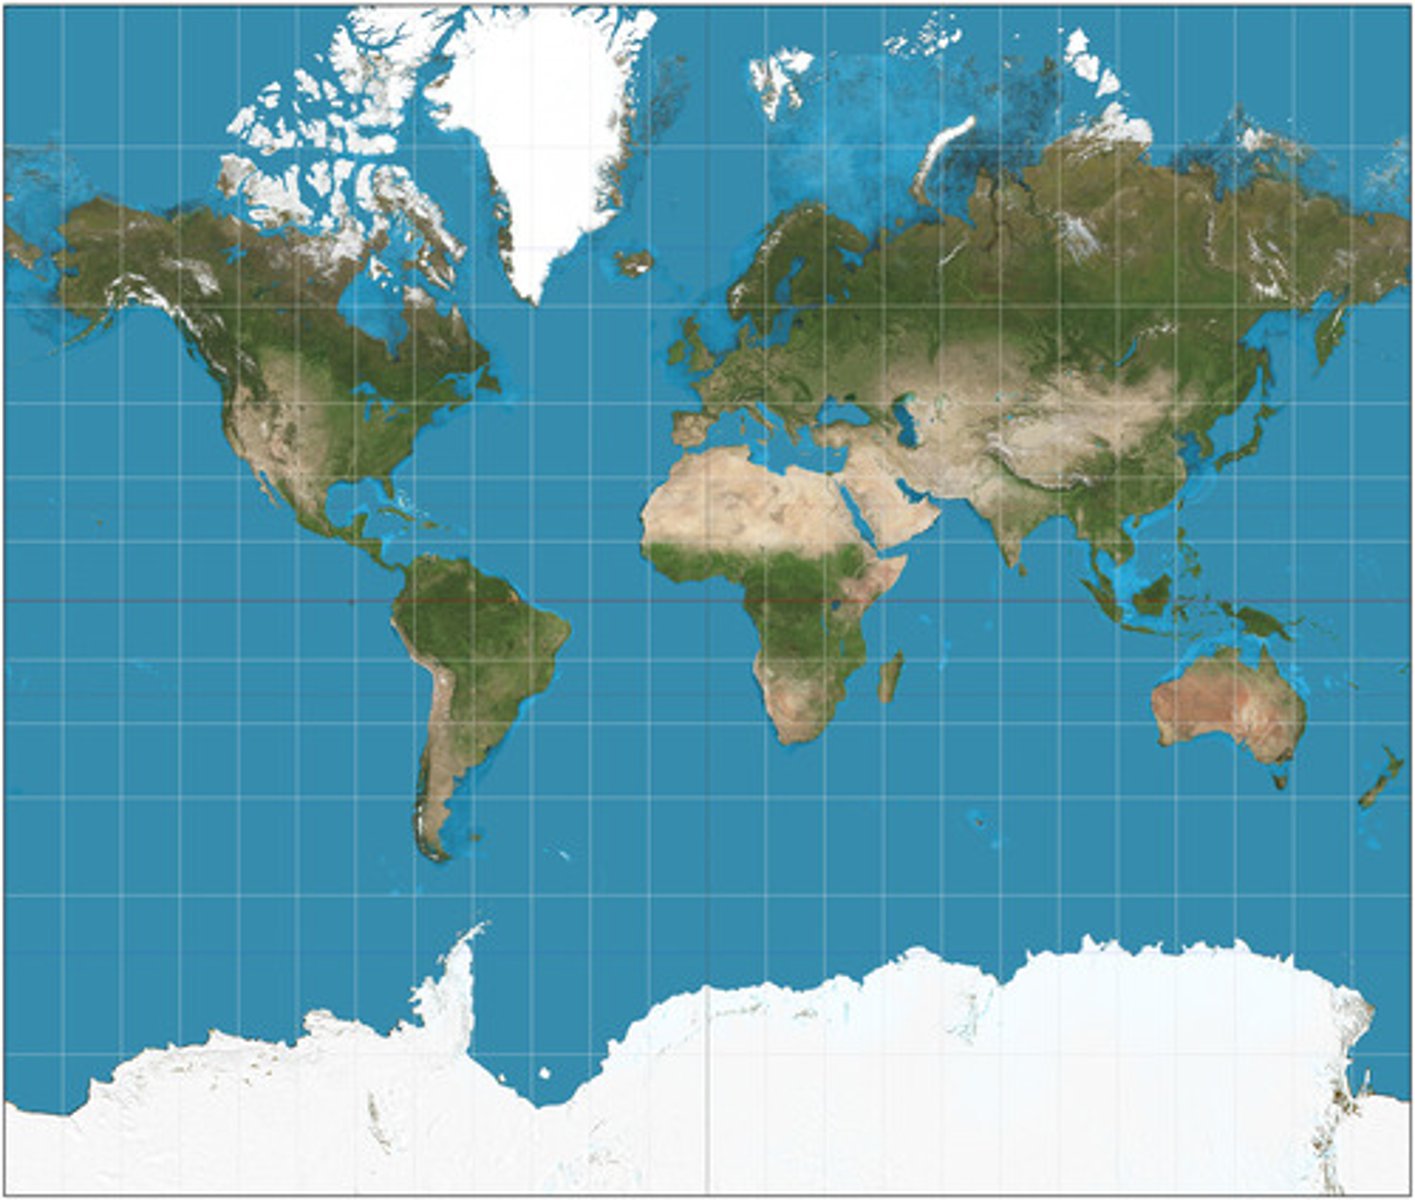
Mercator Projection
a map projection of the earth onto a cylinder, preserves shape, distorts size, original purpose was for navigation
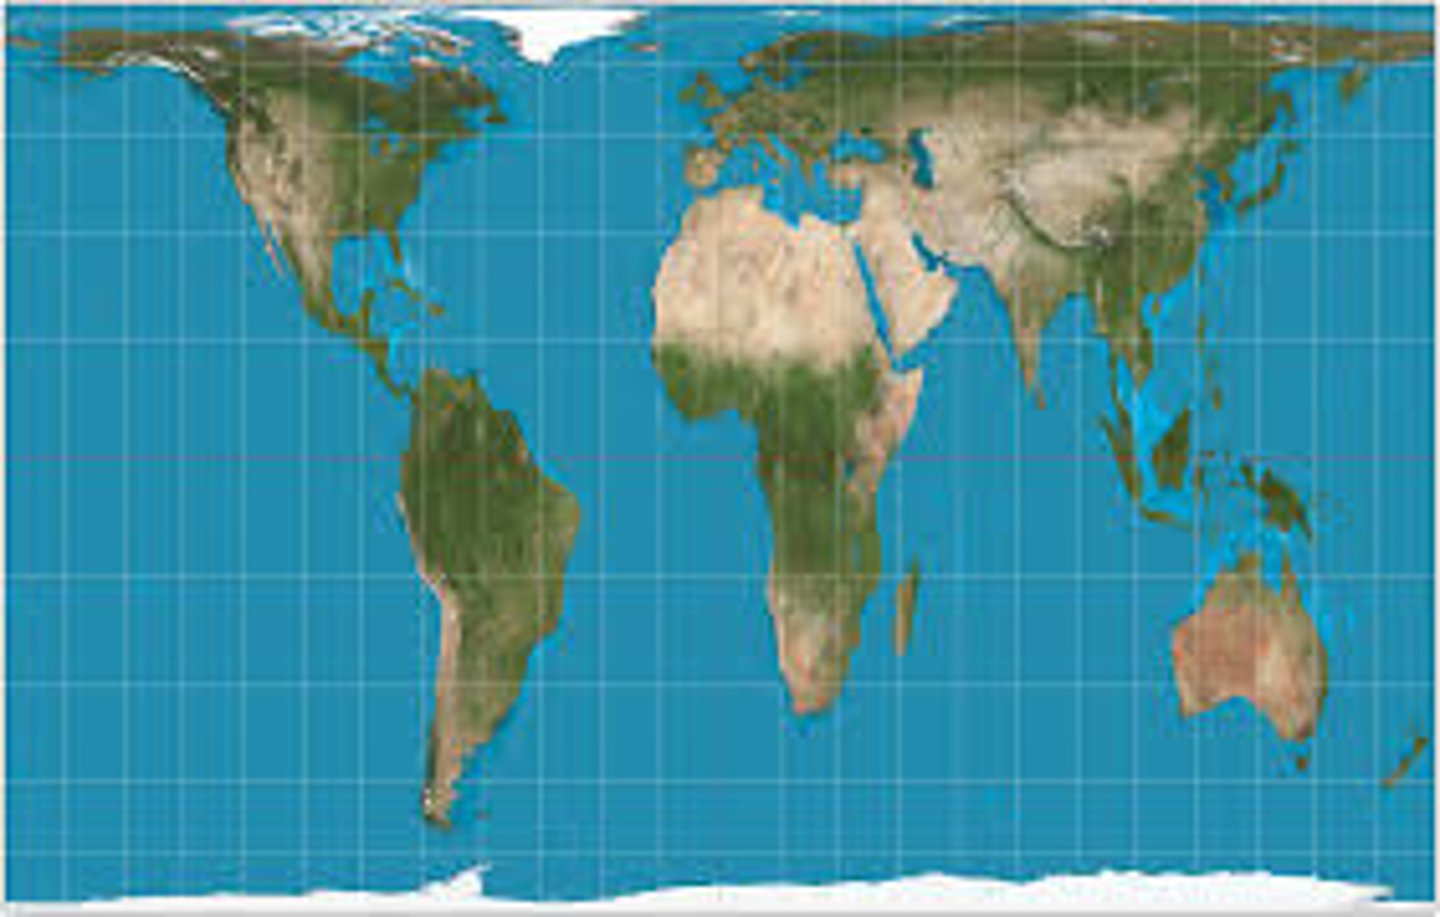
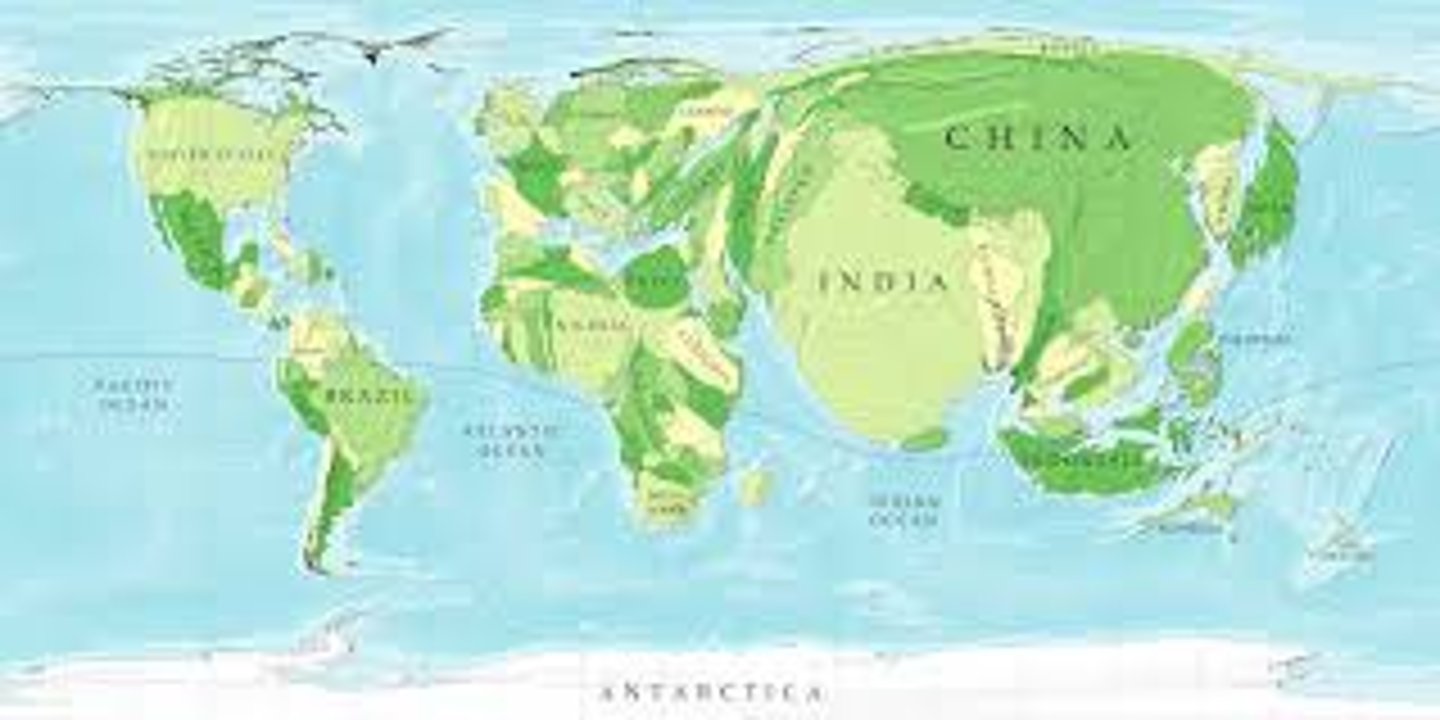
Gall-Peters Projection
equal area projection that distorts the shape of land masses (looks stretched out)
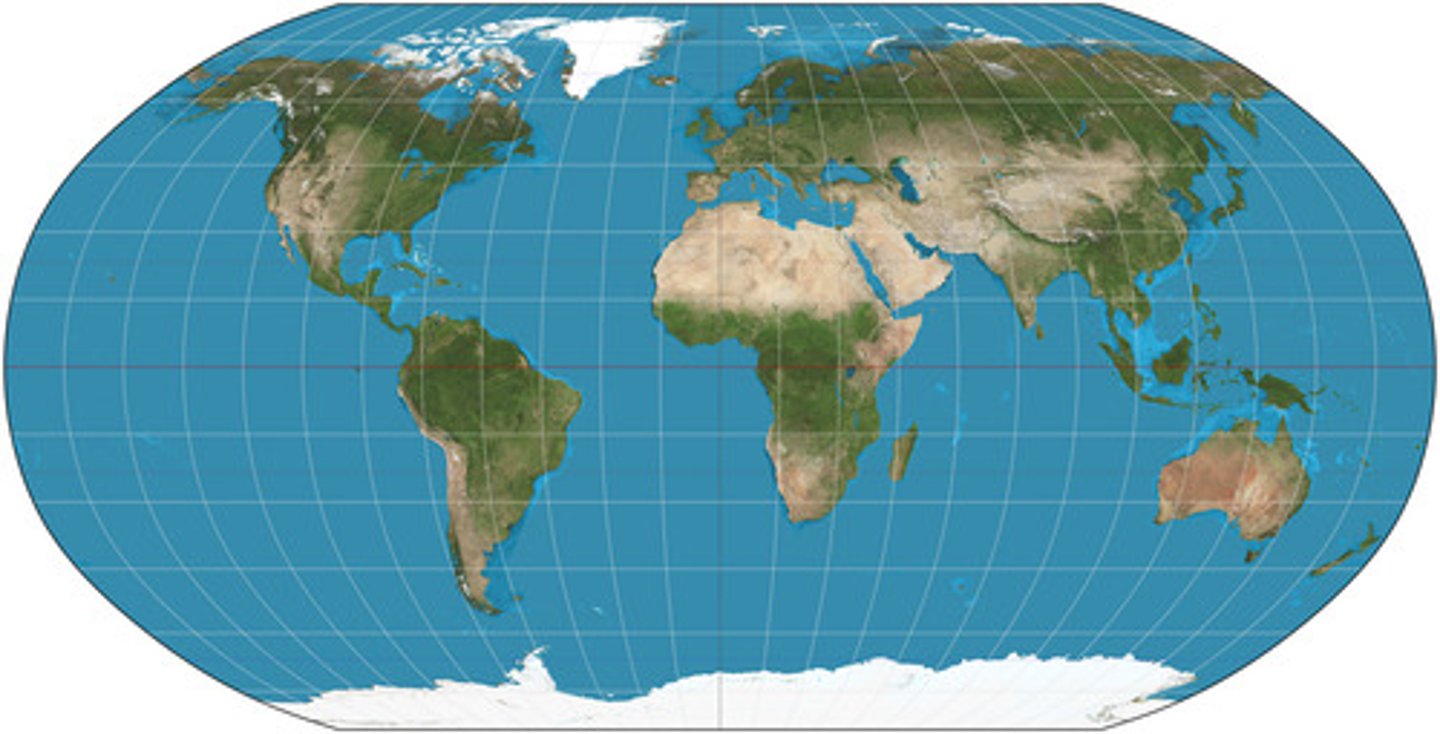
Winkel Tripel Projection
[most common for world maps today] balances size and shape while reducing distortion
![<p>[most common for world maps today] balances size and shape while reducing distortion</p>](https://knowt-user-attachments.s3.amazonaws.com/fef1876e-e661-4b46-9dd6-9d86ffd9f8c0.jpg)
cognitive mapping
a mental representation of the layout of one's environment. the acquisition and processing of information about relative locations we experience and how they relate. (a process of psychological transformations that occur in any individual's mind.)
Wayfinding
The process of using spatial and environmental information to navigate to a destination.
Psychogeography
the study of the precise laws and specific effects of the geographical environment, consciously organized or not, on the emotions and behavior of individuals
Information definition
anything that can be known, all facts and knowledge of the world
intelligence
a type of information that is processed for a certain use, focused on proximate reality. it is a process, product, and organization
All intelligence is information, but the reverse is not true
Information vs. intelligence
geospatial intelligence (De Jure)
the exploitation and analysis of imagery and geospatial information to describe, assess, visually depict physical features and geographically referenced activities on the earth
3 components of geospatial intelligence
imagery, imagery intelligence, geospatial information
why, how, when geospatial intelligence is used
Policymaking, natural disaster, crisis mapping, geosurveillance
small scale
shows large areas of land and small amounts of detail
large scale
shows small areas of land and large amounts of detail
point
shows something static, single location of data
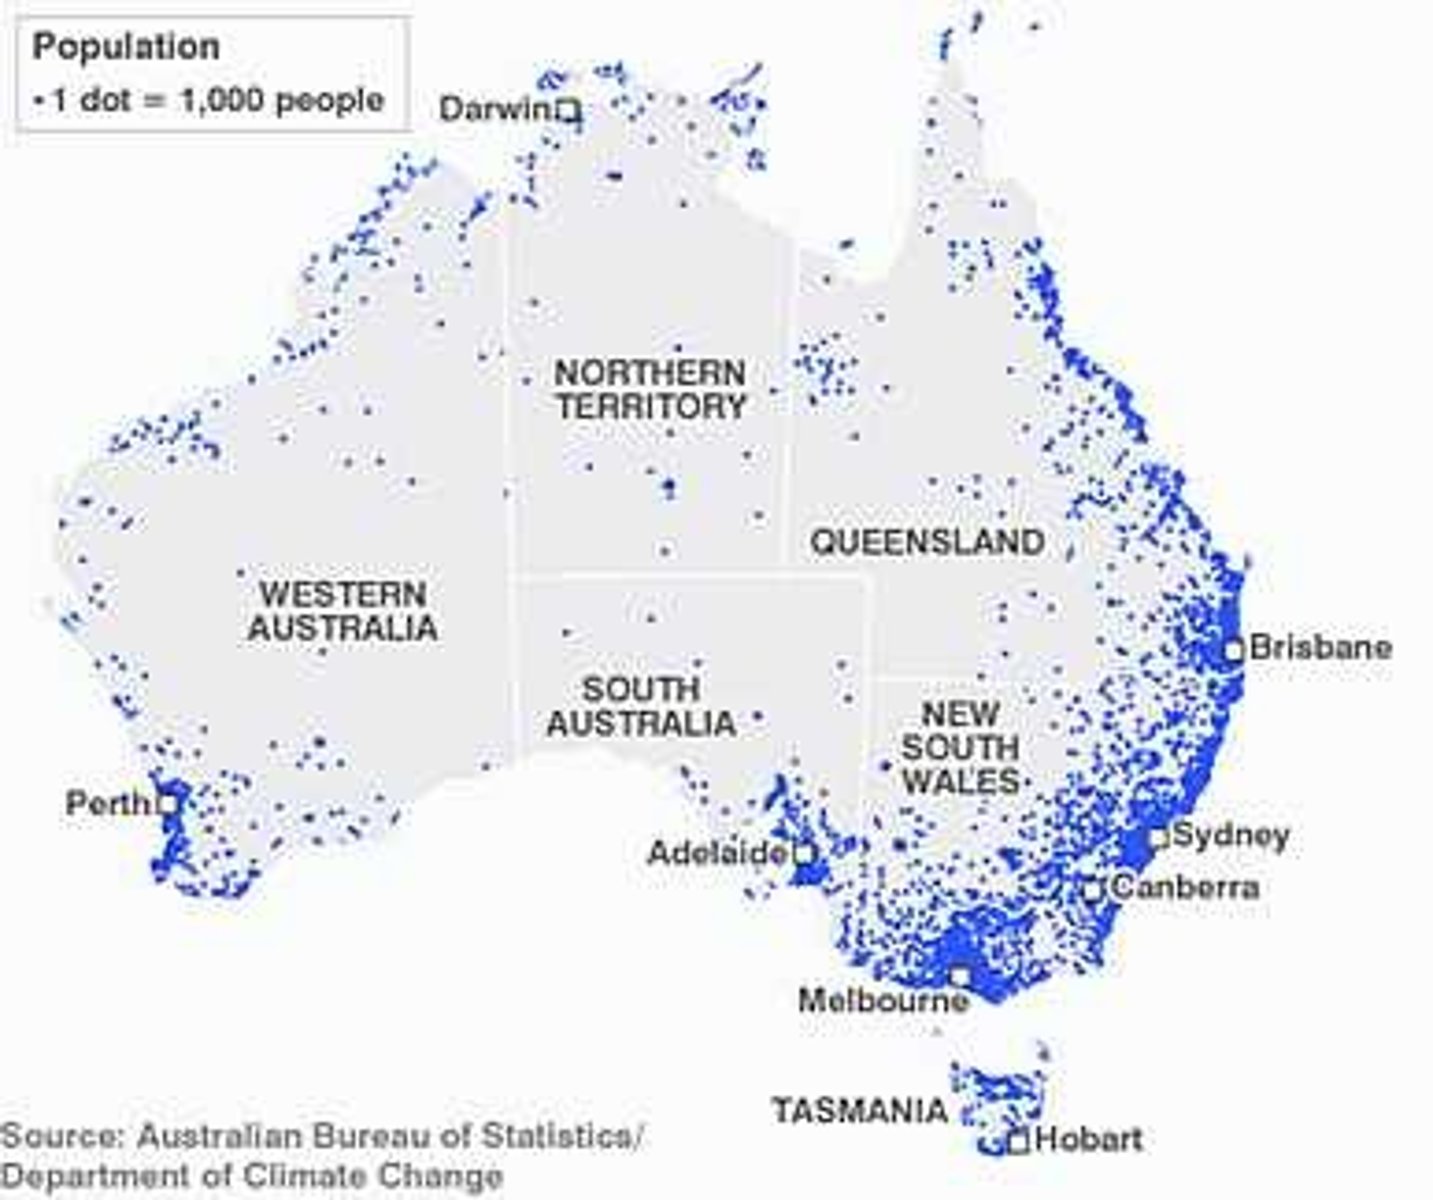
Dot Distribution Map
A map where dots are used to demonstrate the frequency or intensity of a particular phenomenon. These points represent both a location and a value. In this map
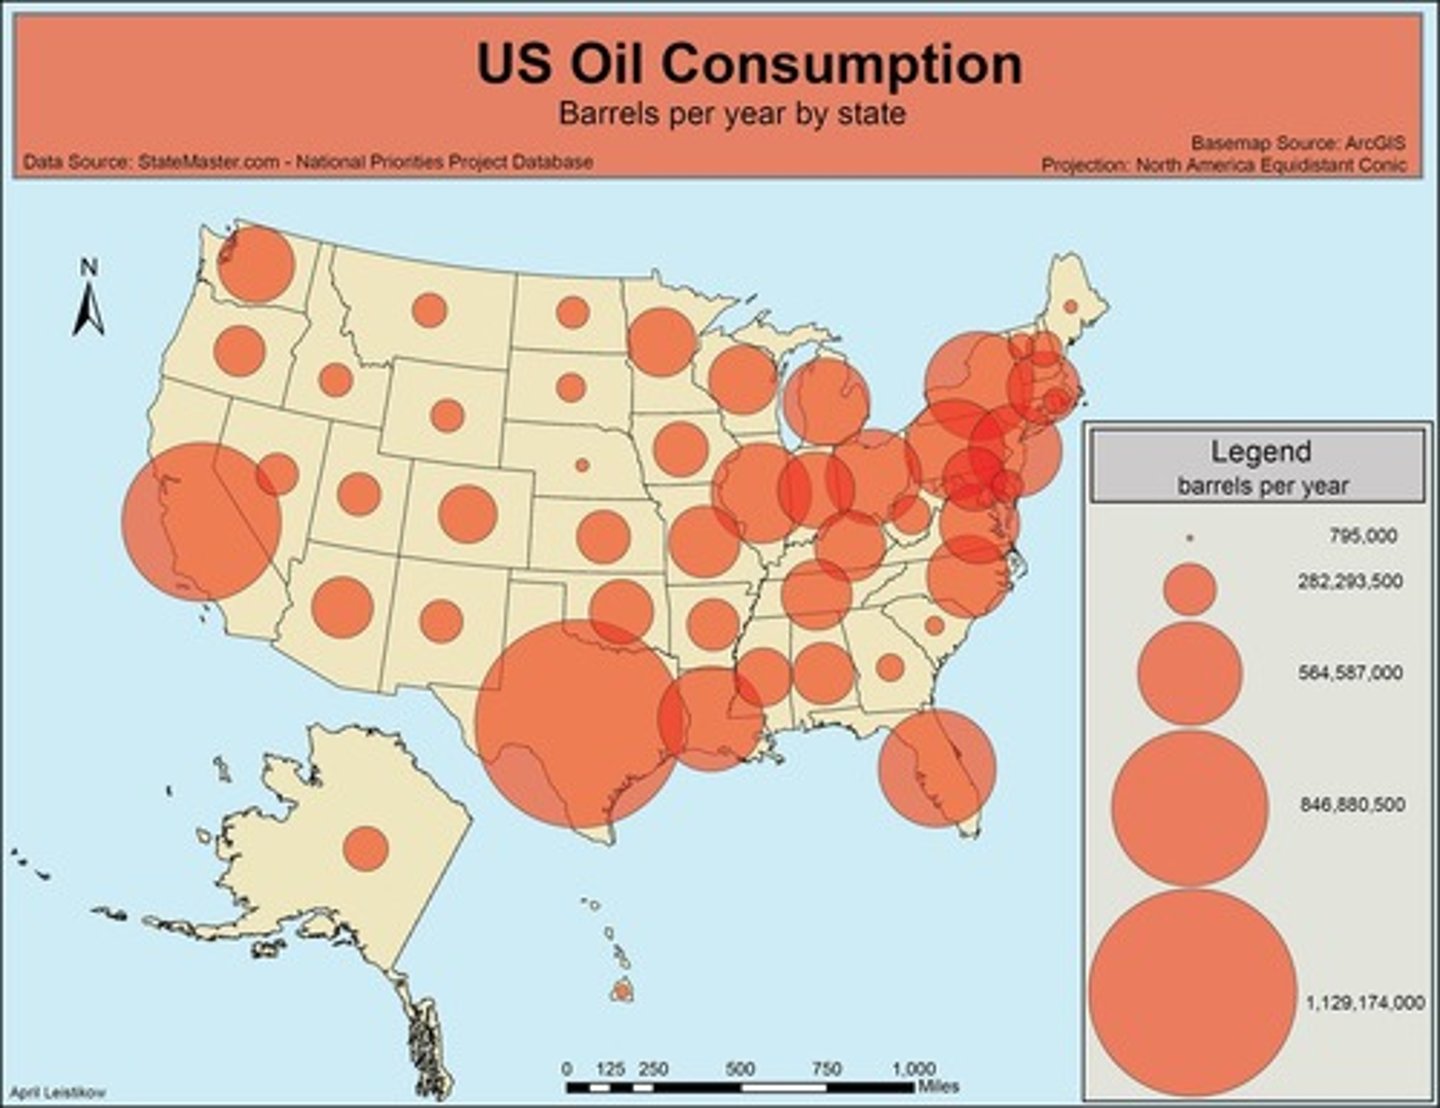
proportional circle map
The size of the circle represents how strong the theme is in an area. The different size of the dot here represents a different total of the thing being measured and represented.
isoline map
A thematic map with lines that connect points of equal value.
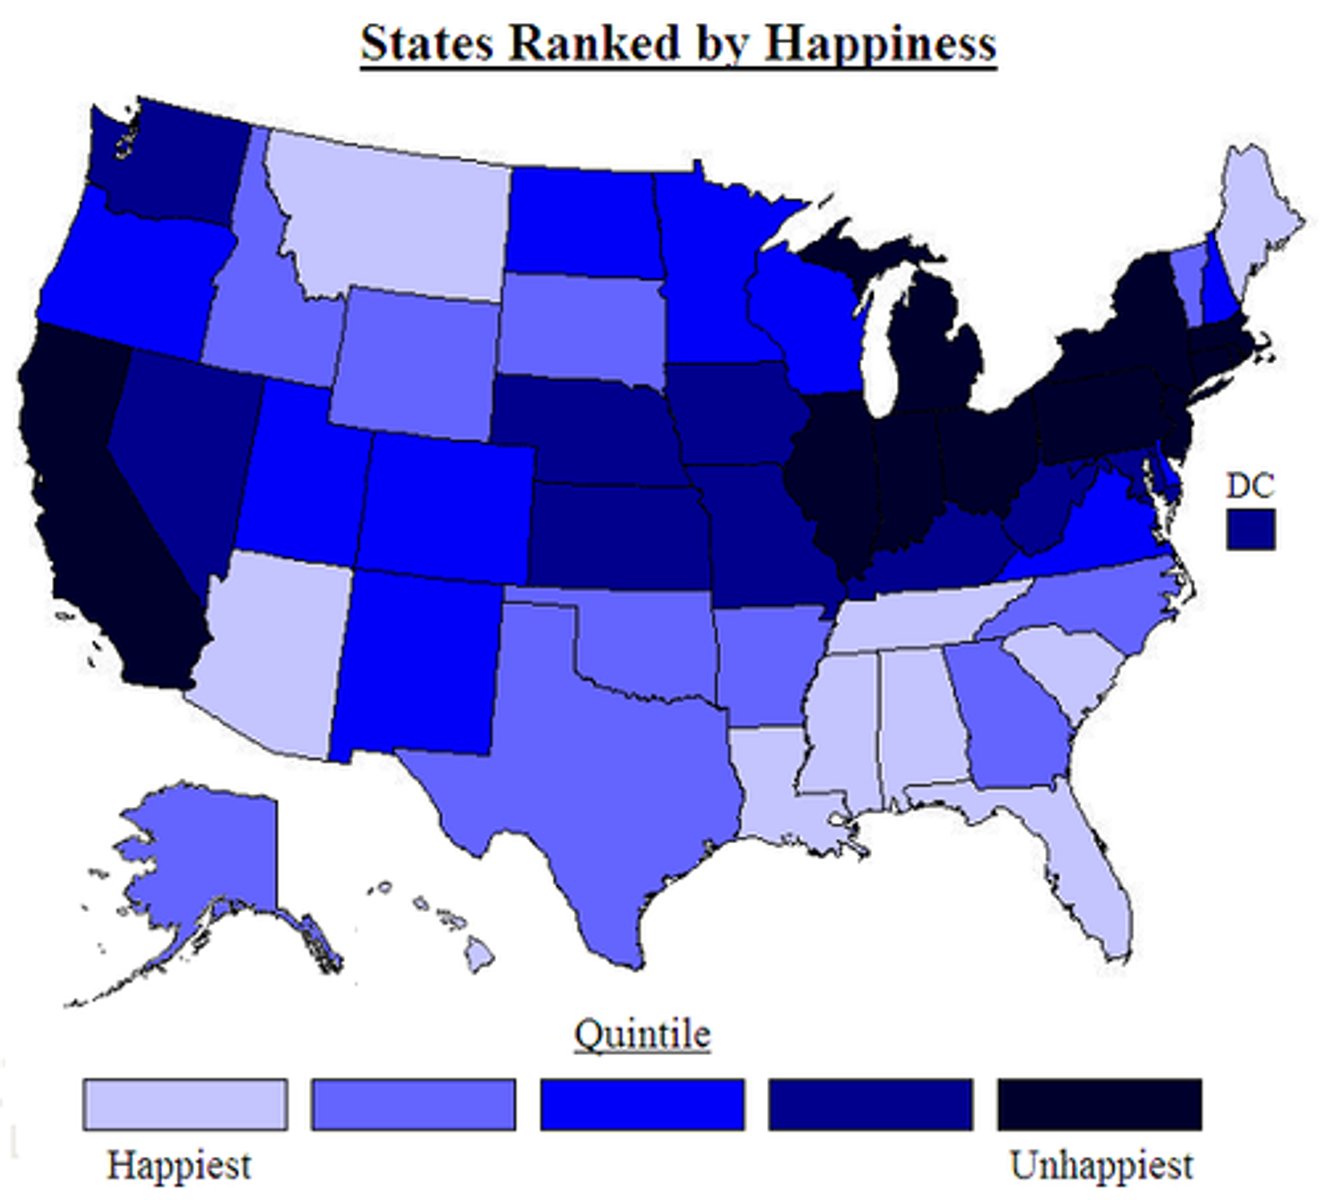
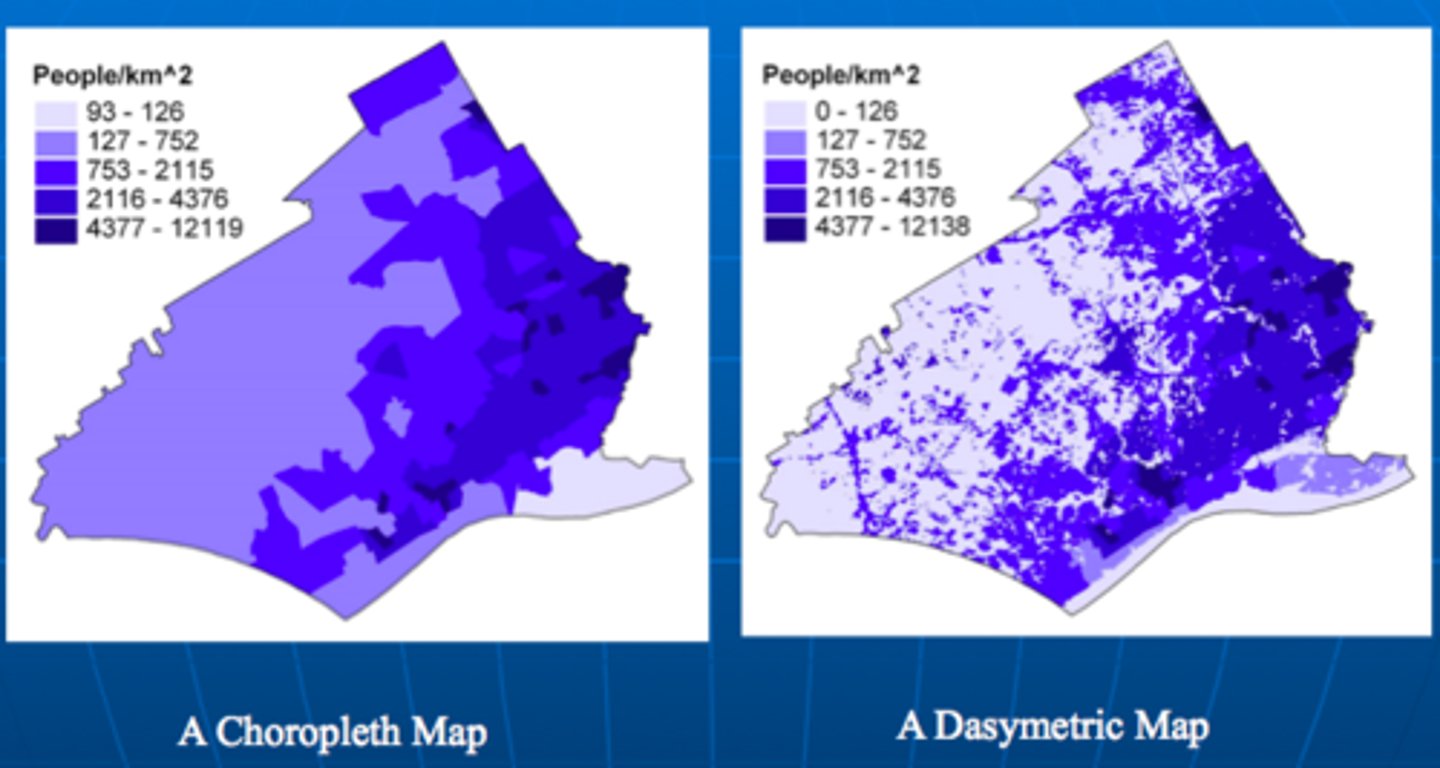
choropleth map
A thematic map that uses tones or colors to represent spatial data as average values per unit area.
dasymetric map
a map that uses statistics and additional information to delineate areas of homogeneous values, rather than following administrative boundaries
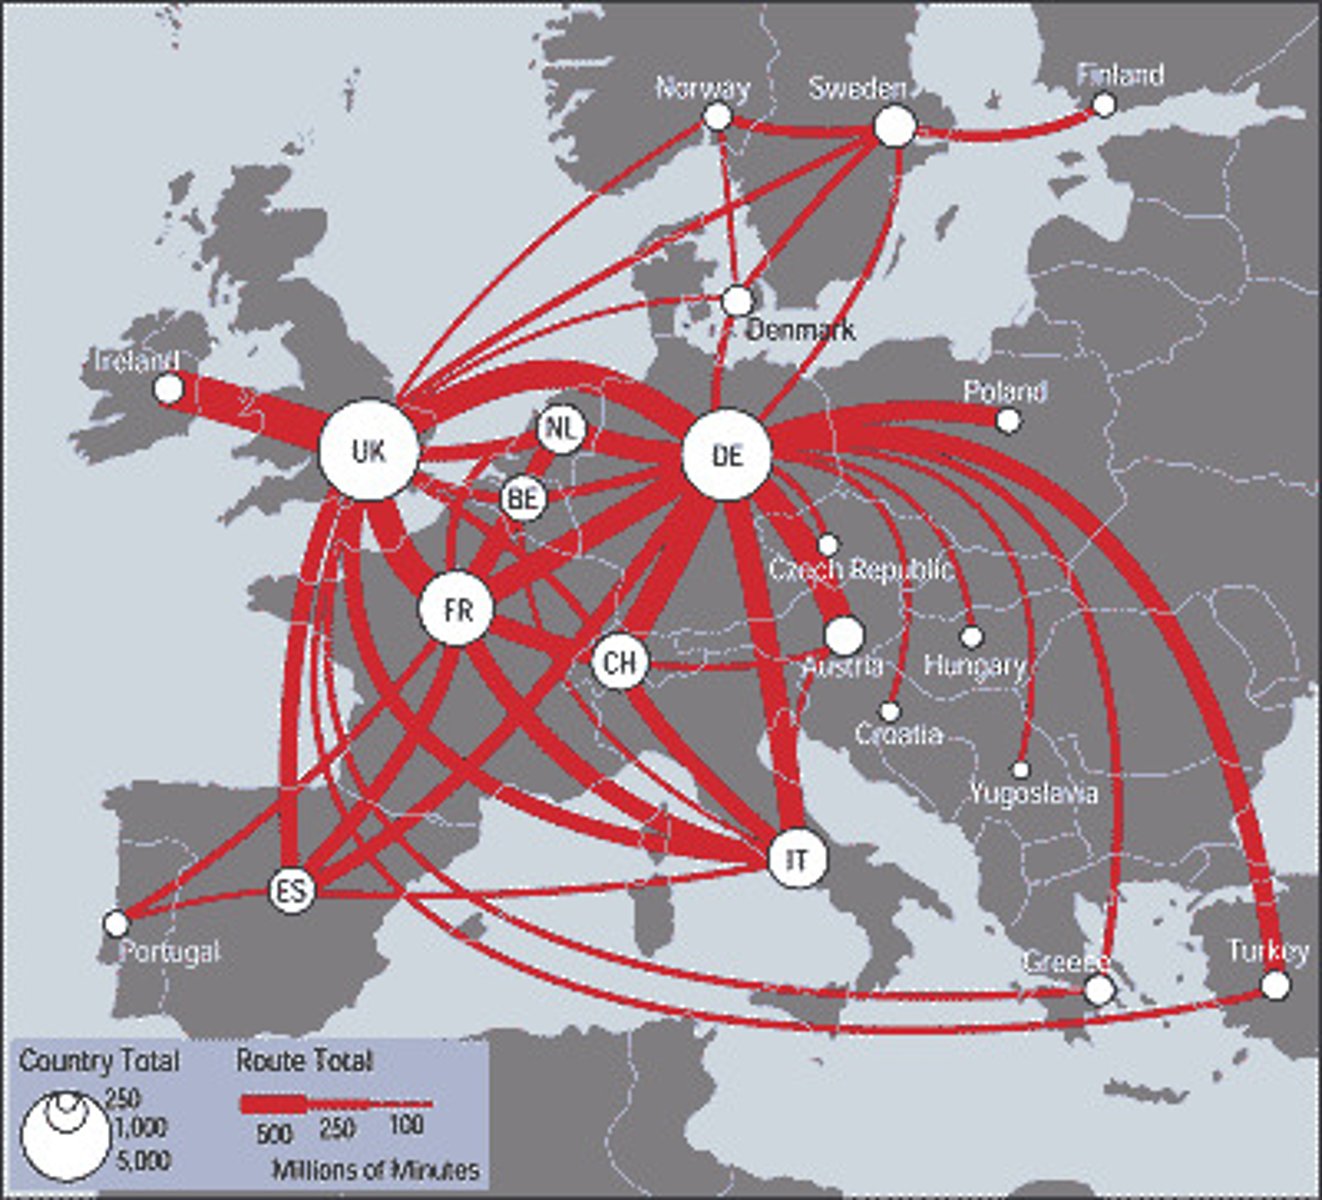
flow map
a type of map that is often used to depict the interaction between places
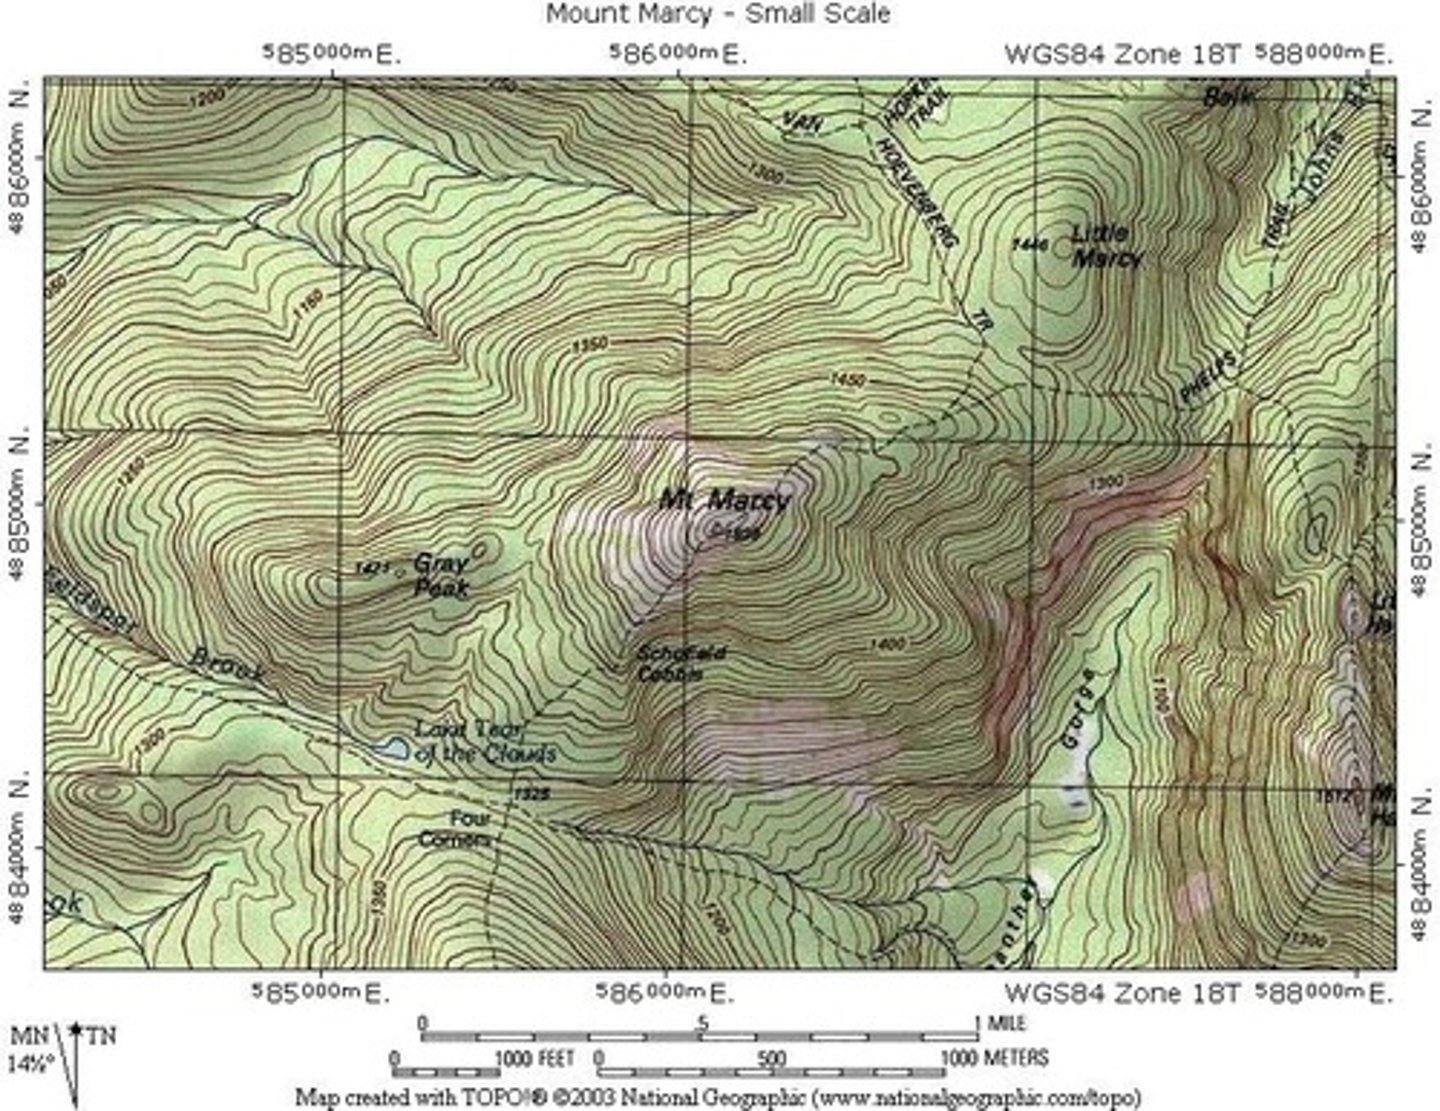
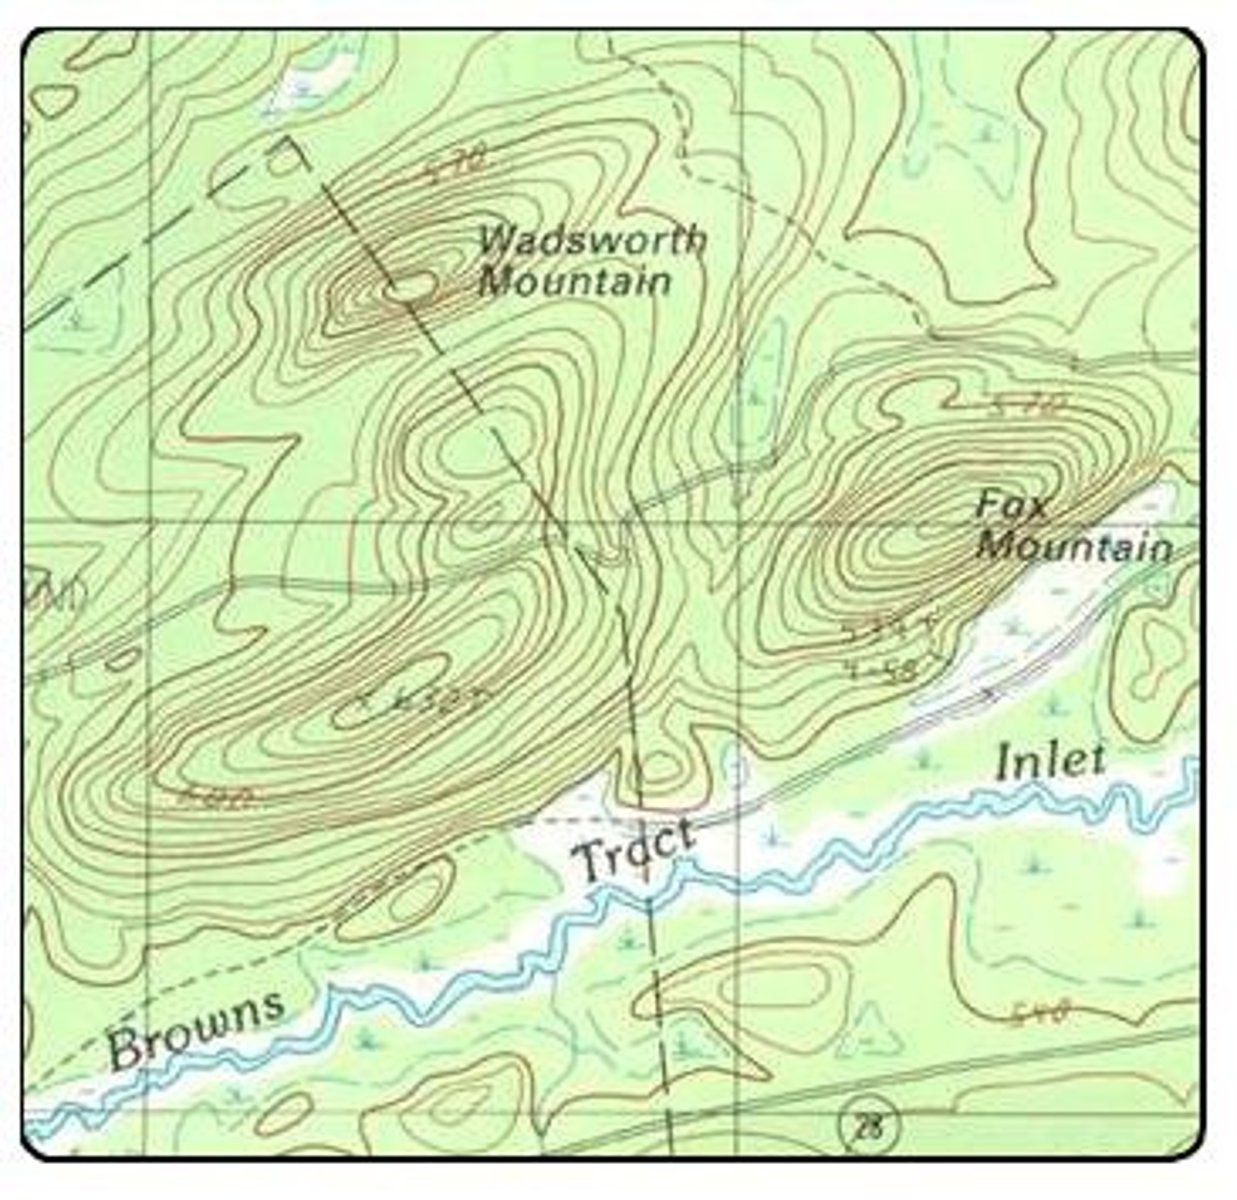
contour map
a map that shows elevation using lines. (type of isoline map)
Proportional Symbol Map
Type of map that uses a symbol in varying sizes to show the magnitude of a characteristic
cartogram
maps where the actual administrative boundaries and shapes are replaced by proportional squares, circles, resized land area representing density
BP timescale
Before Present - uses 1 January 1950 as commencement date of this age scale (radiocarbon dating became possible)
Ancient Map of Catalhoyuk
found in Central Turkey, shows neolithic town 9000 years ago, called world's oldest known map
Babylonian Map of the World
700-500 BC, one of oldest surviving "mobile" maps
Madaba Map
6th century AD, carpet mosaic from church in Jordan, oldest map/cartographic depiction of Jerusalem
Ebstorf Map
show's christ's head, hands, and feet at the extremities of the world (produced germany)
Nilometer
A device used to measure the Nile's water levels
Eratosthenes
calculated the circumference of the earth
Longitude/meridian
Imaginary lines that run from the North to South Pole (top-bottom) around the world
Latitude (parallels)
distance north or south of the Equator, measured in degrees
Graticule
a network of lines representing meridians and parallels, on which a map or plan can be represented (longitude and latitude)
Topography
description of a place; configuration of the surface of the earth
topo
place
relief
the contour of some part of the surface of the earth considered with reference to variations in its elevation
terrain
a tract of country considered with regard to its natural features and configuration, especially in regards to specific purposes (military use)
topographic map
more than just a relief map, but always includes relief. use of elevation contour lines to show the shape of the Earth's surface
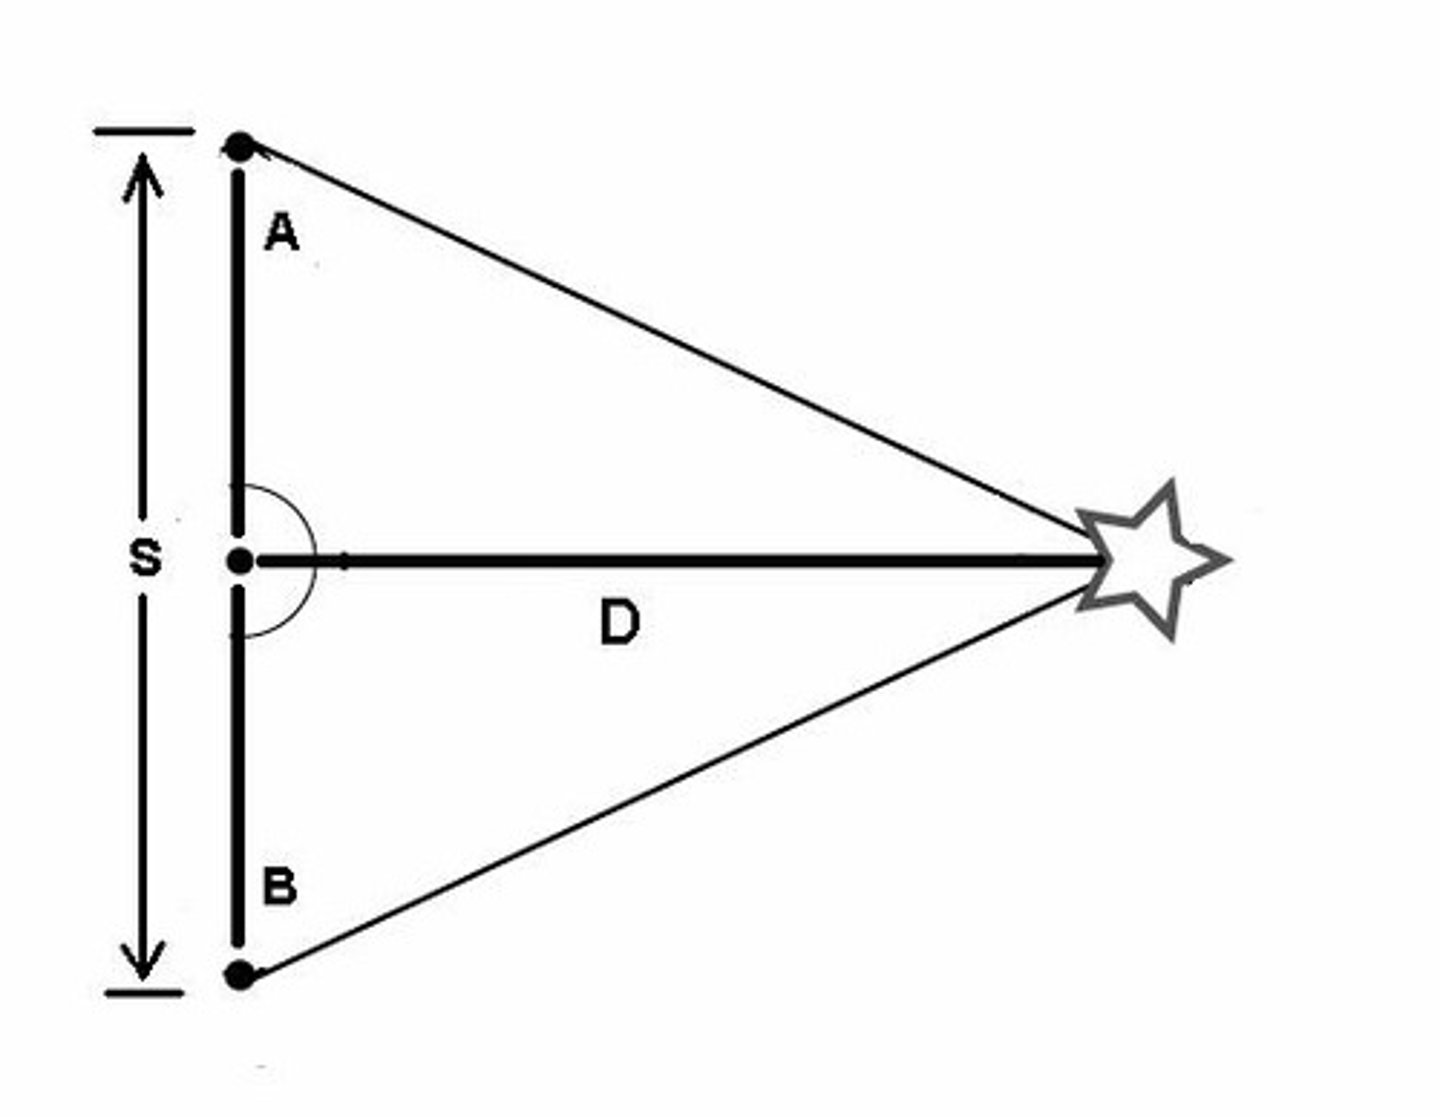
triangulation
selection of a baseline of known length. The angles between the lines of sight from the baseline's endpoints to a distant landmark are then measured. These distances are then used as new baselines
The Longitude Problem
used a seaworthy clock to calculate longitude
The Prime Meridian
the planet's meridian adopted as the zero of longitude (Greenwich)
Great Trigonometric Survey of India
led to the most complex mathematical equations known to pre-computer age and led to the discovery of the world's highest mountain
Networks
an interconnected group or system of intersecting lines or channels
graphs
a connection of nodes and links
2 Elements of a Network
nodes and edges
nodes
vertices
edges
links with directions
point map
only data. We can use any symbol that we want to represent our points. ex. dot distribution map.
Line data
refers to anything we could represent along a line. Things like roads and rivers are common on maps and are good examples of this (metro system).
Polygon/thematic maps
basic symbology of different colors. ex. choropleth map and dasymetric
Mollweide Projection
An equal-area map which shows the correct size of landmasses in relation to other landmasses but distorts shape. Used for depicting area as accurate as possible. Used for Geospatial analysis
Robinson Projection
A projection that attempts to balance several possible projection errors. It does not maintain completely accurate area, shape, distance, or direction, but it minimizes errors in each.
The first Western printed map located?
a woodcut illustrating the geography section in the Etymologiae (appeared in Germany)
terrestrial globe
the oldest known European Globe (Portuguese 15th century)
The groma
The earliest surveying tools used to create maps. A surveying instrument of the Roman agrimensores, who were the land surveyors of the time
the astrolabe
one of the first really important tools to measure latitude. One of the last evolution in tools that we use
Eratosthenes in Egypt
The first person to really try to get an idea of the size of the Earth was a few hundred years before the Common Era,
graticule
used to identify specific locations on the Earth's surface and recall different tools used by surveyors
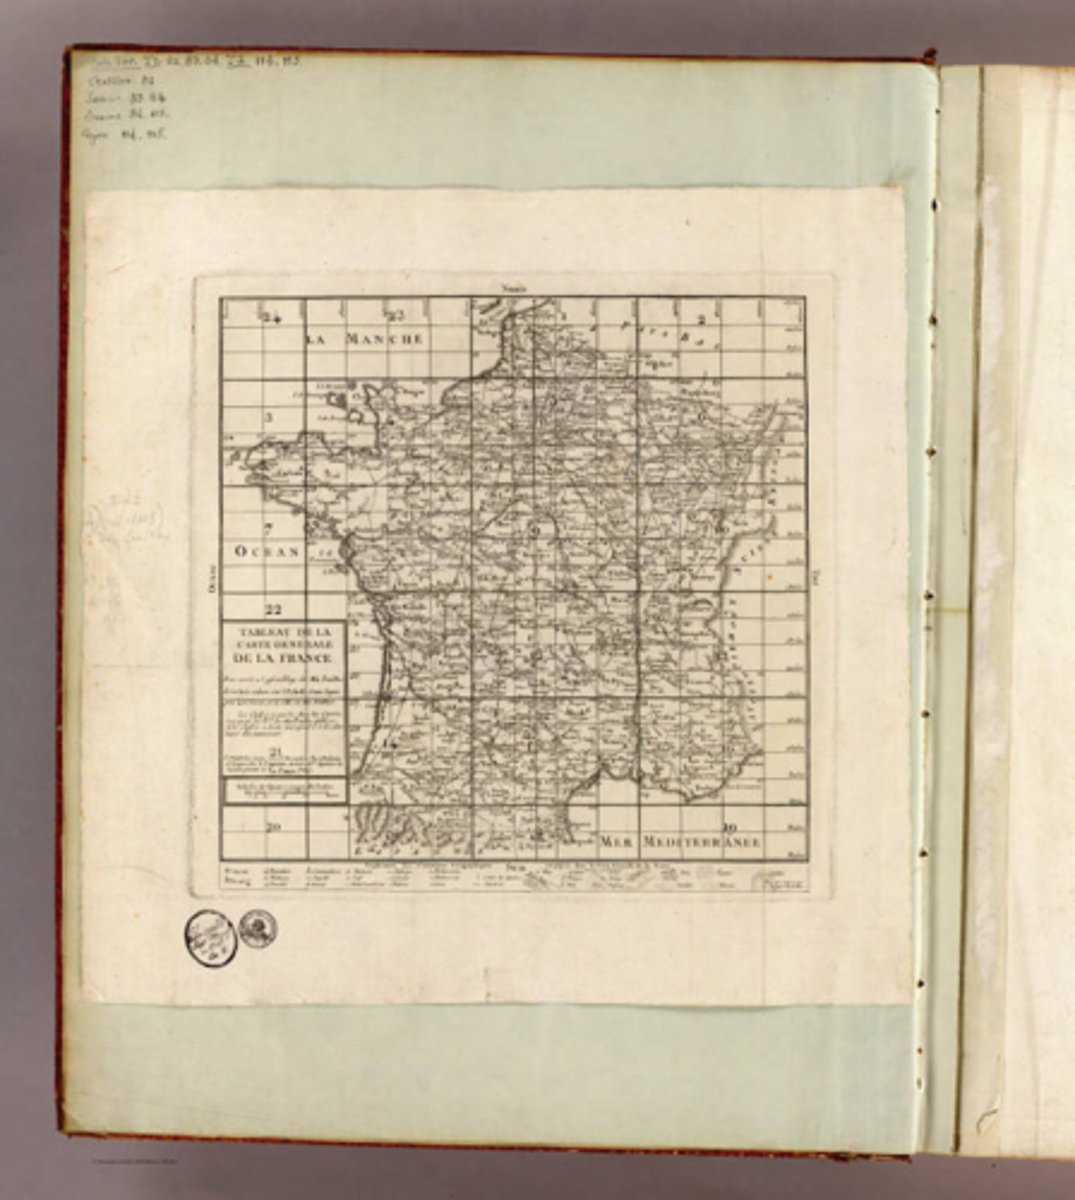
Carte de Cassini.
TERRAIN MAPPING - Cassini family created the first map of France to be based on the triangulation of the country that the family had initiated. first accurate cartographic survey of an entire nation on Earth
trigonometrical survey of India.
This project involved several thousand Indians. And it was named the Great Trigonometrical Survey in 1819 and covered more than 1,600 miles (result of the survey lead to mapping of mount Everest)
Latitude
horizontal lines
Longitude
vertical lines
Terrain Mapping
topography and terrain
Seven Bridges of Königsberg
Euler's solution of the Königsberg bridge problem. Considered to be the first theorem of graph theory and the first true proof in the theory of networks. Formerly in Prussia, but is now known as Kaliningrad and is in Russia
Harry Beck (Beck's Map)
Octilinearity. The most significant trait of transit maps to be their geographical distortion. Influenced the design of many Metro maps across the globe. (designer of the iconic London Underground map)
Octilinearity
Every line on the map is drawn in one of only eight directions, which are in multiples of 45 degrees, and it aims to reduce geographic congruence to increase clarity.