Dependent Sample t-Test
1/4
There's no tags or description
Looks like no tags are added yet.
Name | Mastery | Learn | Test | Matching | Spaced | Call with Kai |
|---|
No analytics yet
Send a link to your students to track their progress
5 Terms
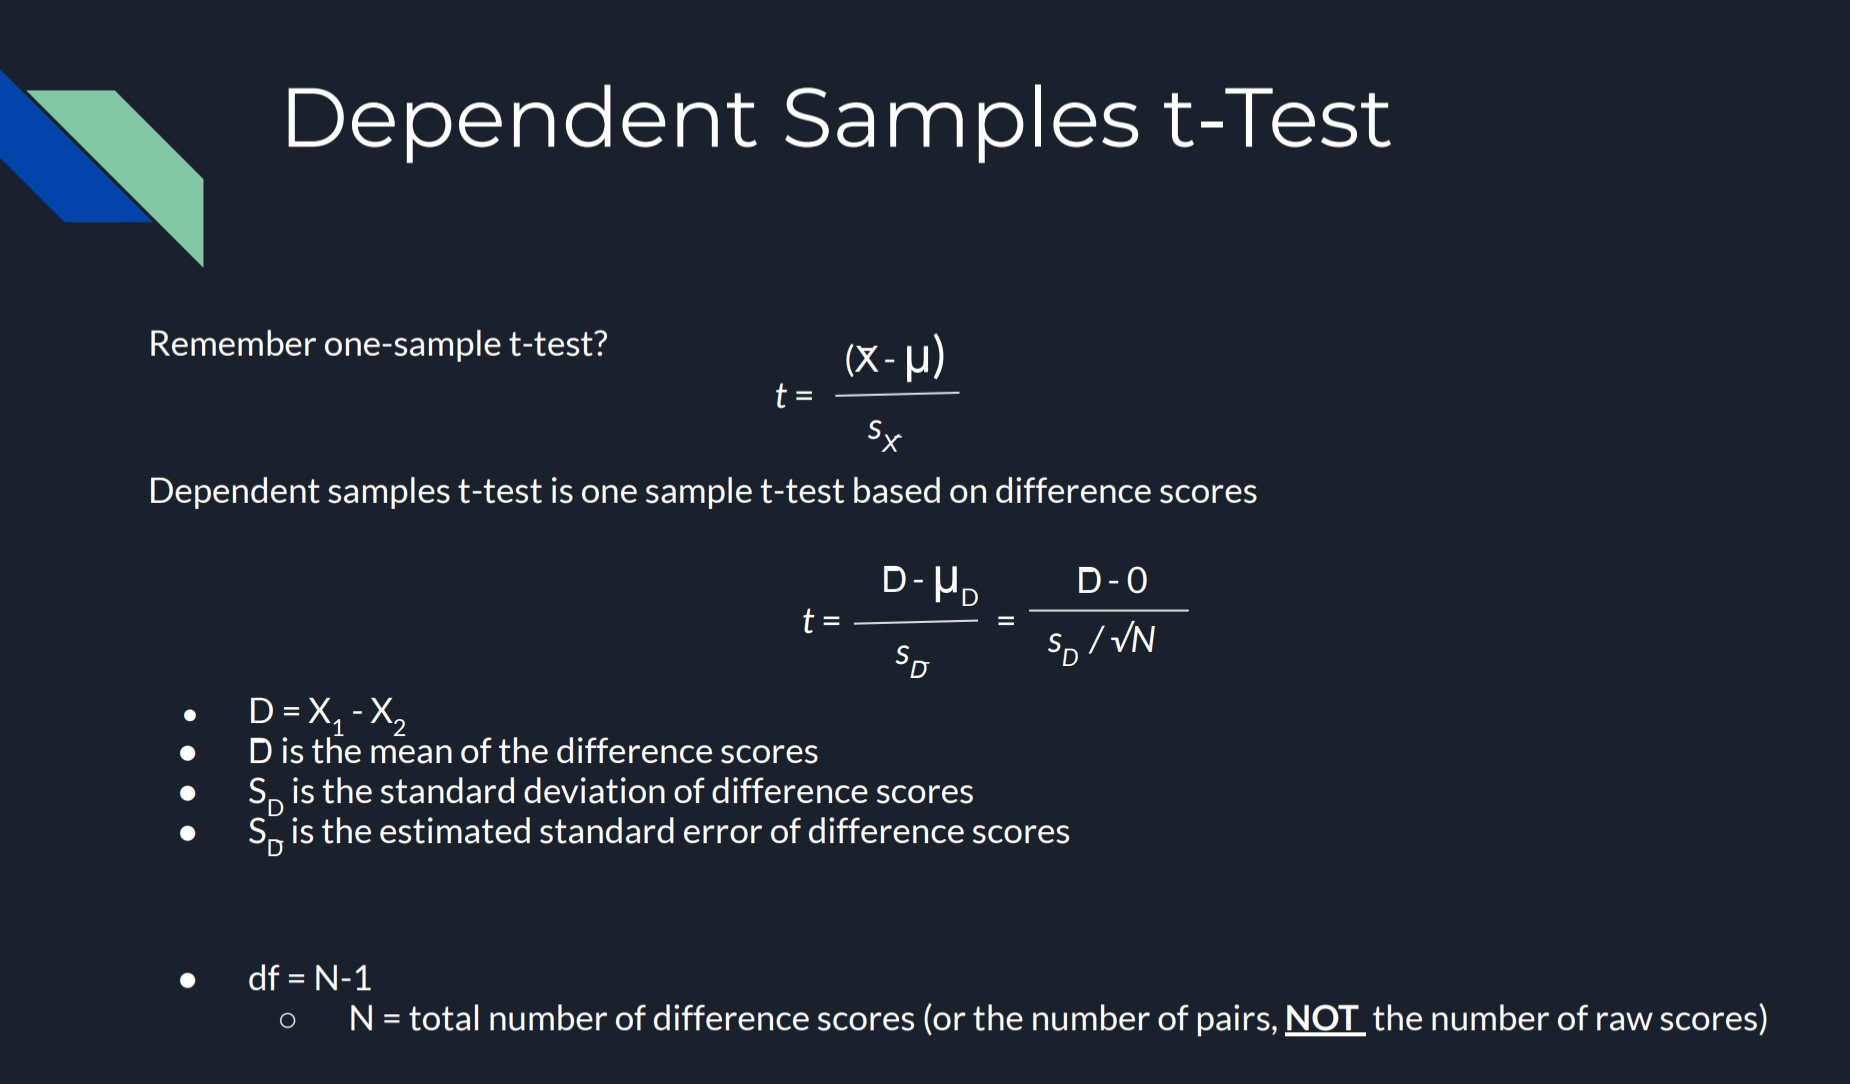
Dependent Sample t-Test (Repeated-Measures Design aka. Within-Subject Design)
Used to study phenomena that are expressed as differences among behavioral measures at different times (learning, forgetting, attitude change, etc.)
A single sample of individuals is measured multiple times on the same dependent variable
- Often used to track changes in a dependent variable over time
o Repeated procedures with the same individual (Exam 1 vs. Exam 2) OR (Pre-test vs. Post-test)
FORMULA:
t = D - μ_D / s_D̄
basically in simple sense its → t = D / s_D/√N
D → X_1 - X_2 ; → D= ∑D/n ; D is the mean of the difference scores
s_D → s_D = √SS / n-1 ; is the standard devation of difference scores
s_D̄ → s_D̄ = s_D/√n ; is the estimated standard error of difference scores
NOTE: df = N-1
N in the FORMULA = total number of difference scores (or the number of pairs, not the number of raw scores)
Matched Subjects
each individual in one sample is matched with an individual in another sample
- matching → two individuals are the same with respect to a specific variable, such as age, gender, IQ, that the researcher would like to control
o Participants in each group are the same, related, or matched (husbands and wives, siblings, twins)
Repeated-Measures Advantages
More efficient
- Uses far less cases than a corresponding randomized-group design
- More data can be controlled in a short period of time
Increased control of subjects variability (matched data)
Control individual variability among participants that can contribute to an error (increases power of study)
Repeated Measures Limitations
lack of independence
repeated observations can affect scores (practice and fatigue effect)
Using different materials to reduce practice may be needed which may make the experiment less controlled
Lingering effect of drug treatment
Participant drop-out
Complicated to set up
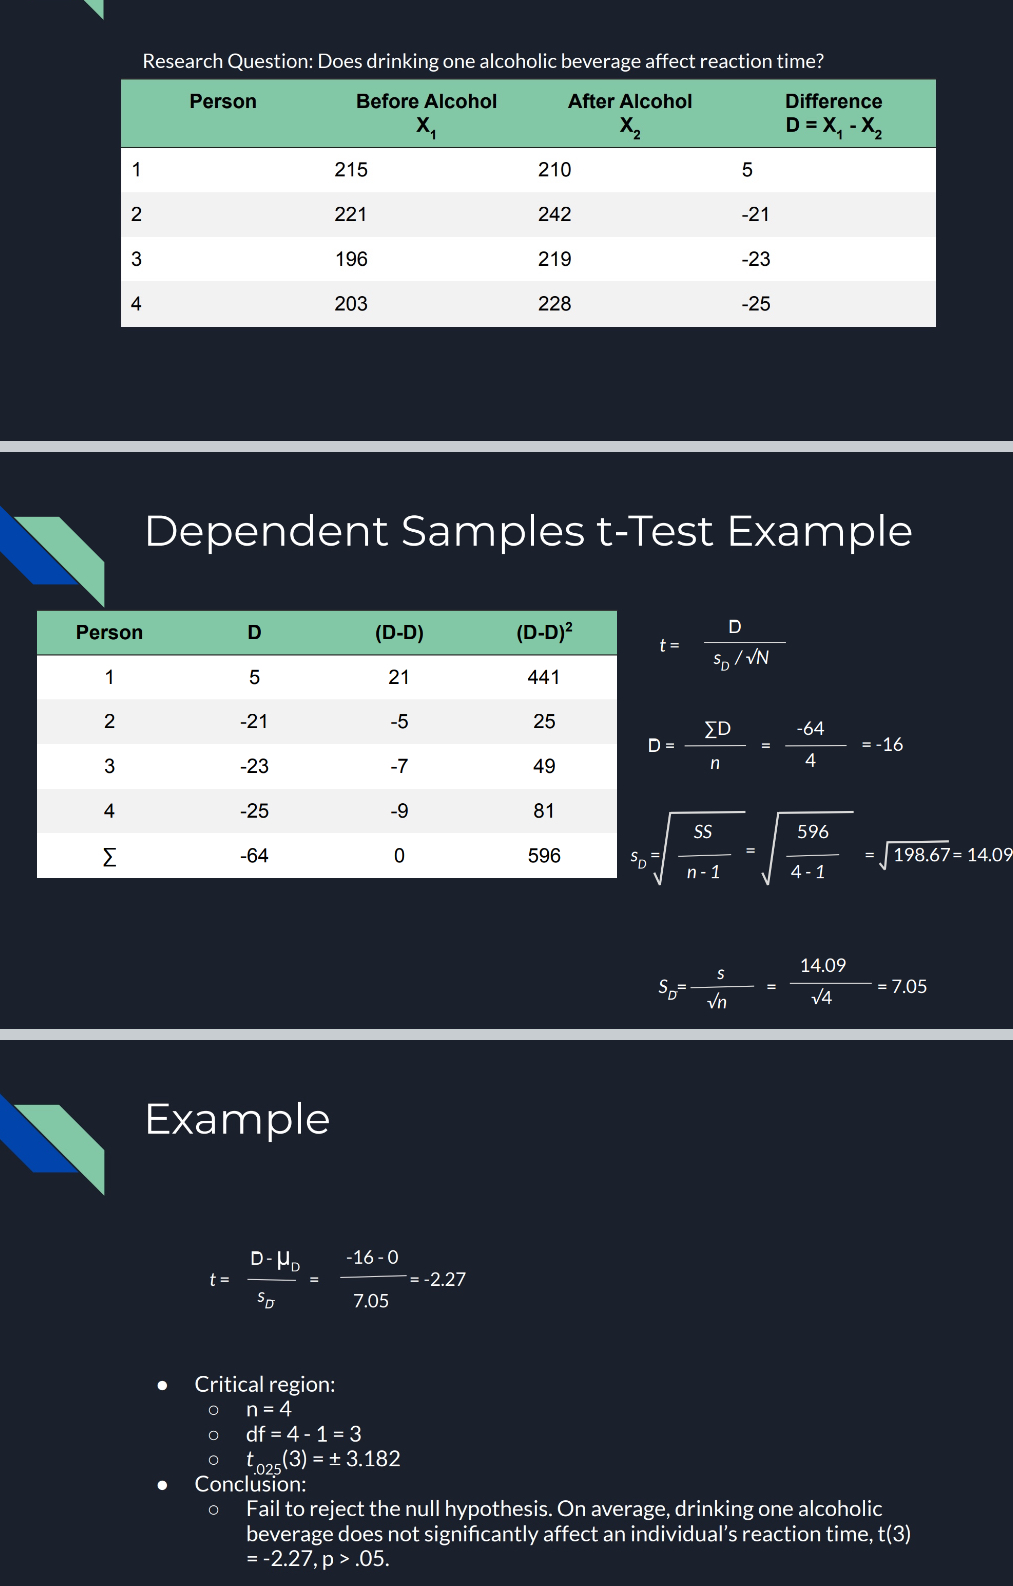
Dependent samples t-test EXAMPLE
Find D
D = ∑D/n → -64/4 = -16
Find s_D
s_D = √SS / n-1 → √596/4-1 = 14.09
find s_D̄
s_D̄ = s_D/√n → 14.09/√4 = 7.05
find dependent sample t
t = D/S_D̄ → -16/7.05 = -2.27
Interpret
Critical Region
- n = 4
- df = 4-1 =3
- 5_.025 (3) = ± 3.182
o t-value < critical value → retain H_0
APA Style
Fail to reject the null hypothesis. On average, drinking one alcoholic beverage does not significantly affect an individual’s reaction time,
t(3) = -2.27, p > .05.