271 Bus Stats - Ch2-3 - Examining relationships I-II & Producing data (Lec 4-5)
1/33
There's no tags or description
Looks like no tags are added yet.
Name | Mastery | Learn | Test | Matching | Spaced |
|---|
No study sessions yet.
34 Terms
What to look for in a scatter plot ?
direction of association
strength of relationship
outliers
What is the coefficient of correlation ?
°measures the strength of the linear association btwn 2 variables x&y.
= r
How to interpret the coef of variation ?
r is always btwn -1 & +1
r>0 —> positive correlation
r~=0 —> no correlation
r<0 —> negative correlation
.r does not depend on the choice of explanatory / response variable
.r is only useful for linear relationships
Properties of coefficient of correlation ?
The closer to -/+1, the stronger the relationship
r does not depend on the units of measurement
Warning about coef of correlation ?
Outliers can influence correlation tremendously
What is the goal of linear regression ?
Make predications about how x (the explanatory or indpt variable) affects y (the response or dpt variable)
What tell us correlation ?
Correlation tells us about strength and direction of the linear relationship
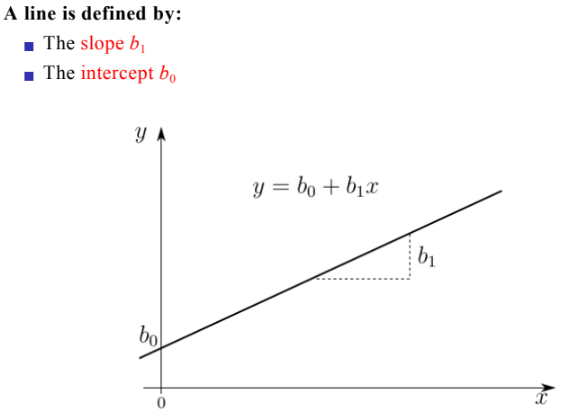
A line is defined by ?
the slope
the intercept
Define the line of best fit ?
°or least-squares line
The line that best fits y=b0+b1x has :
slope b1 = r(sy/sx)
intercept b0 = y_ - b1x_
r = coef of correlation
sx = sample standard deviation of x1,…xn
sy = sample standard deviation of y1,…yn
x_ = sample mean of x1,…xn
y_ = sample mean of y1,…yn
Do the expl slide 33 Lec 4
— — LECTURE 5 — —
What are the 5 steps of linear regression ?
Choose a method for comparing lines (MSE is widely used)
Find the best line
Interpret the result
Evaluate the best line (how good is the line?)
Evaluate if linear regression is appropriate at all (residual analysis)
Step 1 : Compare lines
What criterion should we use to evaluate how ‘good’ a line is ?
The residual error (given a line ŷ = b0 + b1x) :
error = observed value y - predicted value ŷ
errori = yi - (b0 + b1xi)
The best (or “least-squares”) minimize the sum of squares of the residual errors :
SOMMEni=1(yi - (b0 + b1xi))2
Step 2 : Find the best line
Compute ŷ
Observe that : … ?
What can we observe about ŷ ?
Observe that :
the slop has the same sign as the correlation coef r
if the variables x&y are reversed, r stays the same, but the slope & intercept will change
The best best fit line always … ?
The best best fit line always … ?
The best best fit line always passes through the point (x_,y_)
Step 3 : Interpret the results
Do the expl Slides 18-21 Lec 5
Step 4 : How good is the best line ?
Measure the “Goodness of Fit” :
the coef of determination : =r2
represents the fraction of the variation in y that is explained by changes in x
So r is a p%, of how much of the variation in y can be explained by changes in x
Since -1 <= r <= 1, we always have 0 <= r2 <= 1
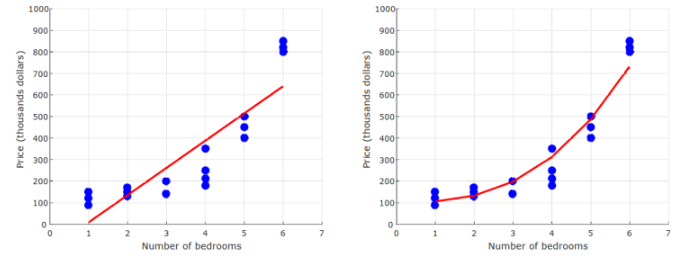
Should we always use linear regression ?
To see if it makes sense to use linear regression, we make a residual plot
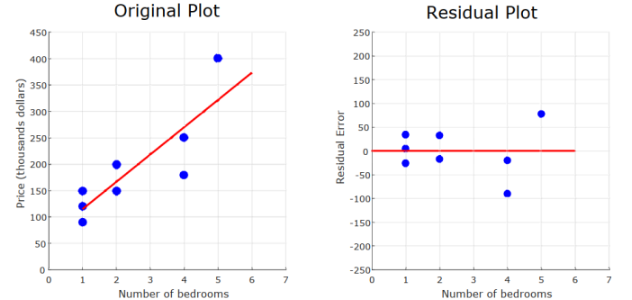
Step 5 : Residual Analysis
Draw residual plot
Residual plot ?
°a plot where the x-values are the same as in the scatter plot, but the y-values are the residual errors
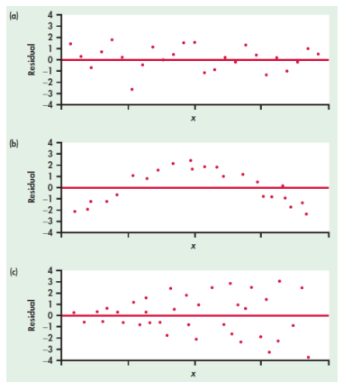
What observation can we make about residual plots ?
No pattern : Residuals are randomly scattered
Ccl : Linear regression is good!
= Homoskedasticity
Pattern : Residuals show surved pattern
Ccl : Nonlinear relationship: Linear regression is not good
No pattern But a change in variability
Ccl : we can use linear regression, but predictions will not be as good when variability is larger
= Heteroskedasticity (lvl of vairaiton is variable, volatility is volatile)
Cautions about correlation and regression ?
Always look for the scatter plot and do not trust blindly the value of r! A single outlier or observation that is far from the other data points can have a major effect on the value of r, and on the regression line.
significantly weaker (less negative, more positive), when outlier (large residual error)
significantly stronger (more negatiev, positive), new point far but not especially large residual error
! beware extrapolation ! : difficult to predict values of the explanatory variable far from the observed values
Association ≠ Causation (not bc 2 variables go in the same direction that they are linked, it can be hazard)
— — Producing Data — — (Ch3)
Census vs sample ?
°Census : measures every ind in the pop
°Sample survey : measures only a subset of the pop
Observational vs experimental data ?
°Observational study : Record data on indvls without attempting to influence the responses
°Experiment : Impose a treatment on indvls and record responses.
Common sample designs ?
Convenience sampling
Voluntary response sampling
Simple random sampling
Stratified random sampling
Convenience sampling?
Voluntary response sampling?
Simple random sampling?
Stratified random sampling?
Systematic sampling?
Cluster sampling?
When is sample design biased ?
When it systematically favors certain outcomes
Common sources of bias ?
Undercoverage
Non-response
Untruthful/inaccurate responses
Wording of questions influences answers
Excel :
Coef of correlation ?
Step 1
Step 4
CORREL(var1, var2)
Do ex 1 & 2 Slides 47-48 Lec 5
Suppose the standard deviation of y1
,...,yn is 20, and the standard deviation of x1,...,xn is 10.
==> What is the biggest possible value of the slope of the regression line?
Suppose y_=1.5, sx=3, r=0.5, b1=2, and b0=1.
1 What is the standard deviation of y?
2 What is the mean of y?