Biochem Exam 3
1/100
There's no tags or description
Looks like no tags are added yet.
Name | Mastery | Learn | Test | Matching | Spaced | Call with Kai |
|---|
No analytics yet
Send a link to your students to track their progress
101 Terms
Induced-fit model
Enzyme is flexible and undergoes conformation change to fit the substrate. This allows a larger number of weaker interactions between the substrate and enzyme upon binding.
Lock and key model
Substrate (reactant) binds to the enzyme perfectly. Limit: Enzyme only fits one substrate shape, not the transition state. It has rigid shape and does not account for conformation change
Enzyme
Biological catalysts. Increase rate of chemical reactions by lowering activation energy required to reach transition state. Do not change the overall free-energy change of the reaction, and they do not change the equilibrium position. A catalyzed reaction and an uncatalyzed reaction start and end at the same energies, the catalyzed pathway reaches the products more easily. Not consumed by reactions and do not alter equilibrium concentration ratio of substrates and products. Does not increase reaction favorability.
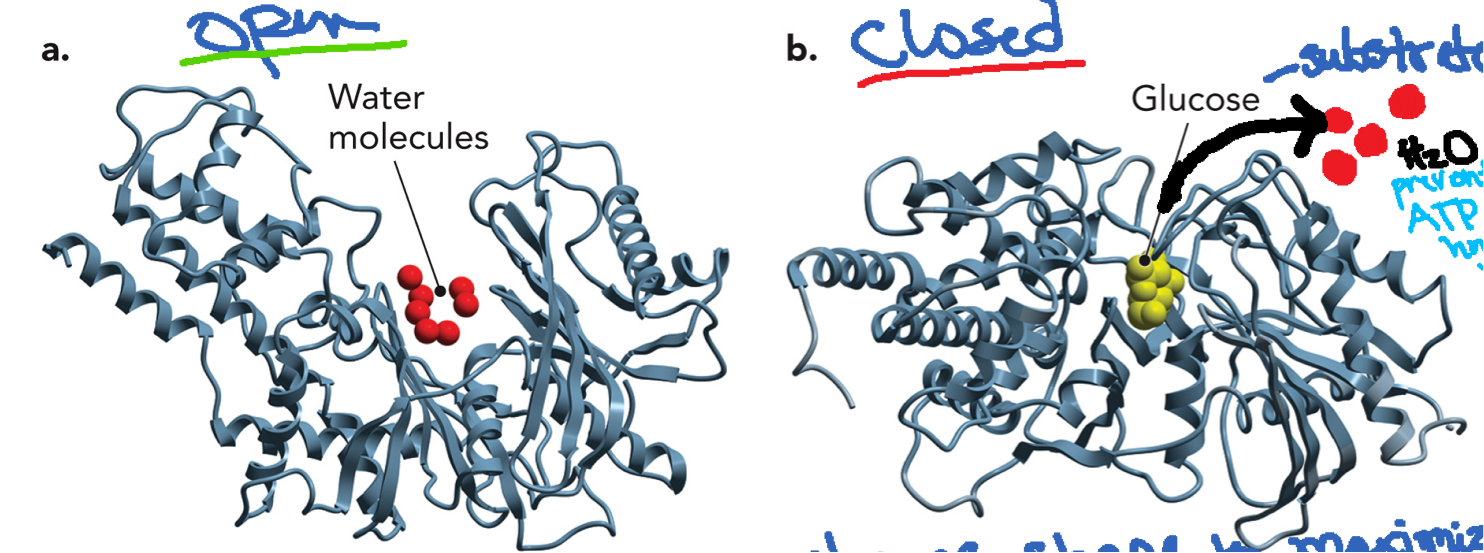
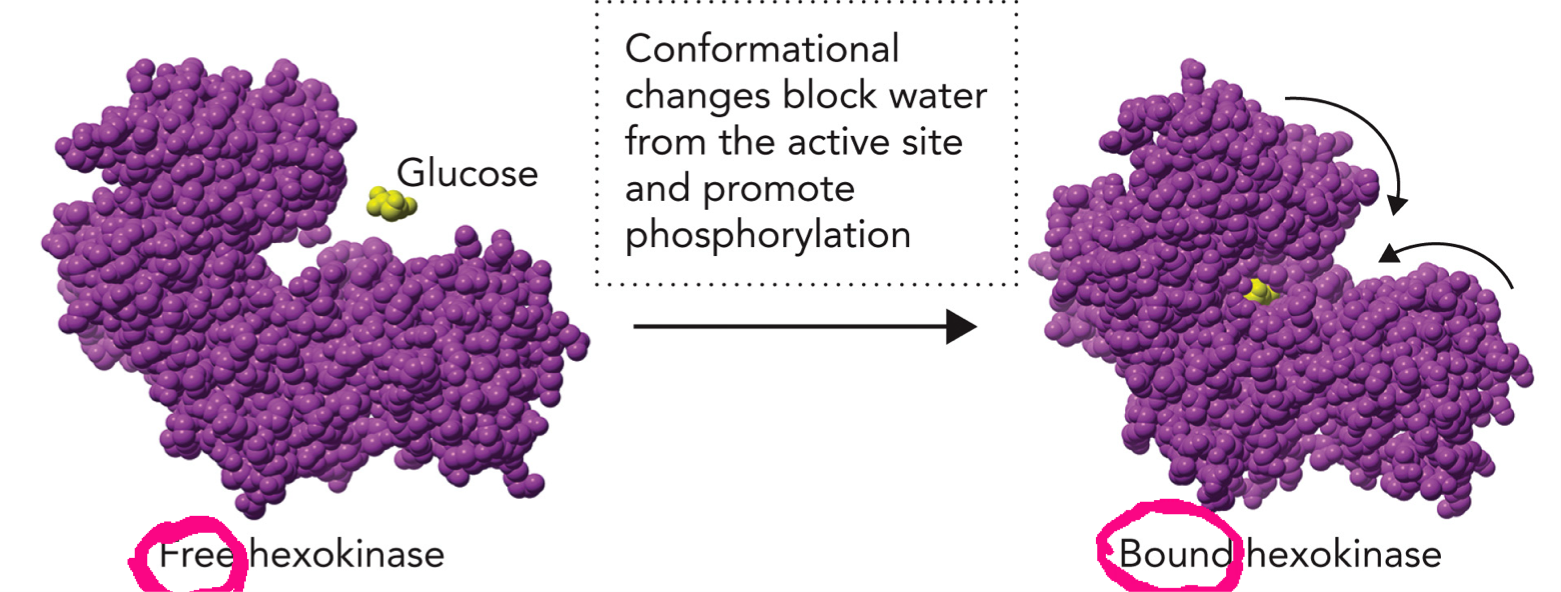
Hexokinase
An induced fit mechanism Undergoes large conformational change when glucose binds. In open form without substrate, solvent-exposed active site is open and water is present. Glucose replaces water in the active site by occupying a similar volume and similar weak interactions for binding. When glucose binds it triggers a conformational change and the enzyme closes around the glucose. In the closed form glucose is tightly enclosed and triggers induced fit. Active site becomes hydrophobic and water is excluded. This prevents ATP from being hydrolyzed by water and ensures ATP is used only to phosphorylate glucose.
Catalysis of Hexokinase
Process of speeding of a chemical reaction
Glucose + ATP → Glucose-6-phosphate + ADP
More weak interactions → more efficiency: stabilize transition state, increase specificity, lower activation energy
Transition State
Highest energy, unstable state where reaction bonds are broken and formed. Enzymes accelerate reactions by stabilizing this state and lowering activation energy.
Conformational Selection Mechanism
The same enzymes already exist in multiple conformations before substrate binds, the substrate (ligand) selects the correct pre-existing conformation. The binding stabilizes (“traps”) that conformation. Induced fit may occur to further optimize interactions and promote catalysis
Critical Aspects of Enzyme Structure & Function (Part 1)
Enzymes bind substrates with high specificity and affinity through the active site, enabling catalysis. The active site is a binding pocket in the enzyme designed to bind the substrate. The active site provides chemical environments that facilitate catalysis by excluding excess solvent and bringing reactive functional groups of the enzyme into close proximity of the substrate.
High specificity: enzyme recognizes a specific substrate
High affinity: Enzyme binds substrate tightly through weak interactions
Promote Catalysis: Positions substrate correctly, stabilizes transition state, lowers activation energy
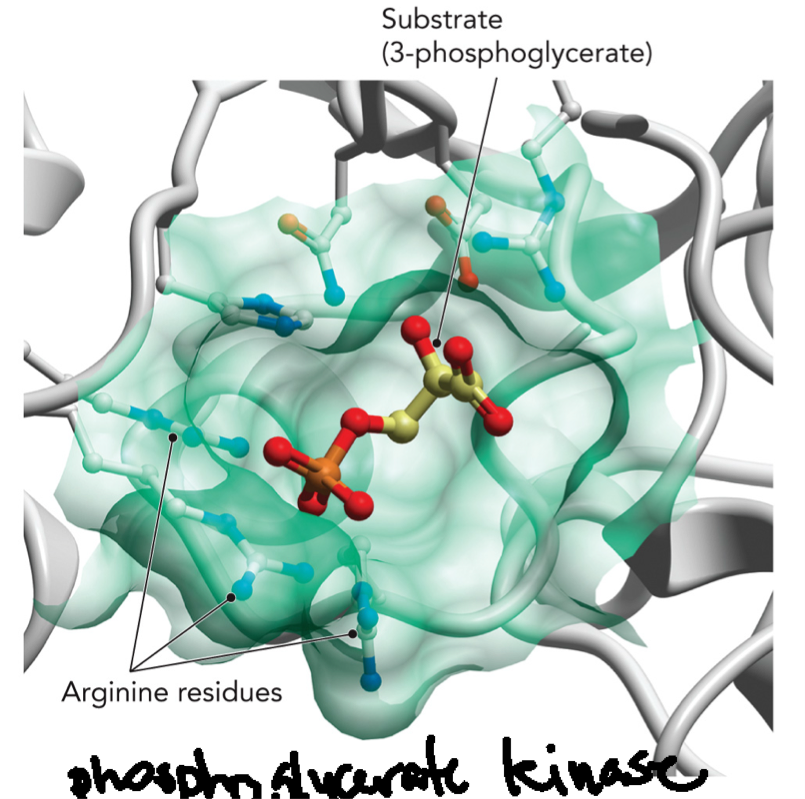
Example of Critical Aspects of Enzyme Structure & Function (Part 1)
3-phosphoglycerate (substrate) + ATP bind to phosphoglycerate kinase (enzyme): Enzyme binds the substrate in the active site. Arginine residues (positively charged): interact with negatively charged phosphate groups and help stabilize binding (weak interaction). The electrostatic interactions help orient the substrate. All these interactions increase specificity, increase binding strength, and increase catalytic efficiency.
Critical Aspects of Enzyme Structure & Function (Part 2)
Substrate binding induces conformational changes in the enzyme (induced fit), which enhances catalysis. In hexokinase: glucose binds and triggers a conformational change in the enzyme to close the active site, block water from active site, and promote phosphorylation(transfer phosphate group from ATP to substrate) and catalysis.
Critical Aspects of Enzyme Structure & Function (Part 3)
Enzyme activity is highly regulated in cells to control metabolic pathways.
Bioavailability (how much enzymes exists): controlled at gene level, includes gene expression (making more/less enzyme), protein degradation.
Cofactors/coenzymes: Helper molecules required for enzyme function to enhance or enable catalytic activity. Binds at active site.
Allosteric regulation: molecules binds at site other than active site, which causes conformational change that changes enzyme activity by altering shape and/or affinity, and increase catalytic efficiency/activity. Binds at regulatory site.
Covalent modification: Chemical modification of add/remove of chemical group to the enzyme which changes charge and structure that causes conformational change. It can switch enzymes on or off and increase catalytic efficiency. Binds at regulatory site.
Example of Critical Aspects of Enzyme Structure & Function (Part 3)
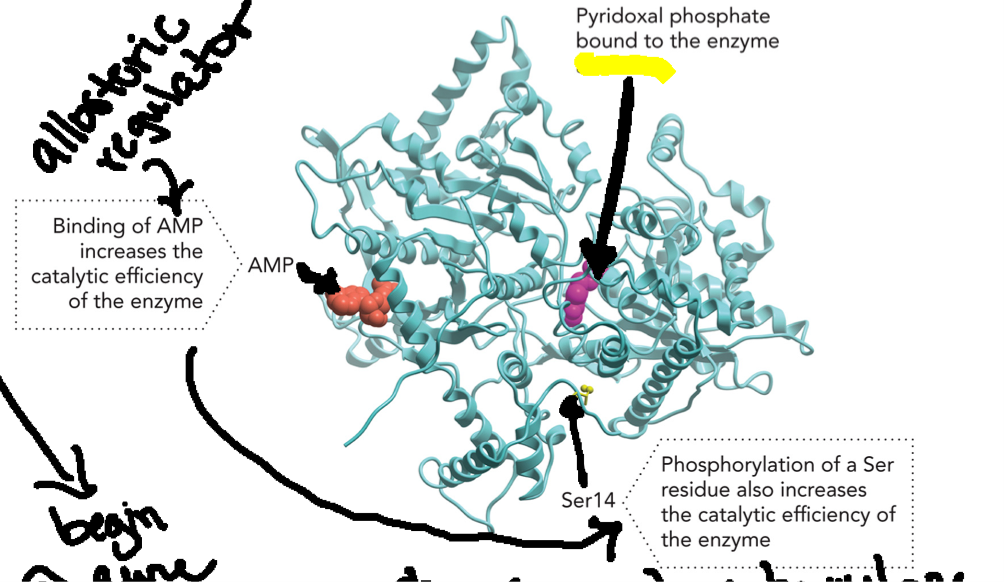
Glycogen Phosphorylase (enzyme)
Allosteric regulation: AMP binds at an allosteric site (NOT active site), this stabilizes the active conformation (R state) of enzyme
Covalent modification: Phosphorylation of a Ser14 residue, a negatively charged phosphate group is added to a serine residue, this alters enzyme structure and stabilizes the active form (enzyme ON)
Cofactor: Pyridoxal phosphate, PLP, is a cofactor bound to the enzyme required for catalytic activity by facilitating reaction mechanism
Enzymes are Chemical Catalysts
Enzymes speed up reactions without changing the ratio of substrates and products at equilibrium or overall energy.
A ⇌ B - Enzymes speed up both directions equally
ΔG (free energy) - Stays the same
Activation energy (Ea) decreased: Easier to reach transition state
Reaction rate: More products in less time
Transition State Theory
Describes chemical reaction rates, reactions go through a high-energy transition state (‡).
Quasi equilibrium: Equilibrium between reactants ⇌ transition state (‡)
Transition state (‡): Highest energy point/level, unstable
NOT an intermediate: Cannot isolate, exists extremely short 10⁻¹⁵ (one atomic vibration)
Reaction requirement: Reactant MUST reach transition state to become product
Enzymes role: Stabilize transition state by lowering energy needed to reach it and increase reaction rate.
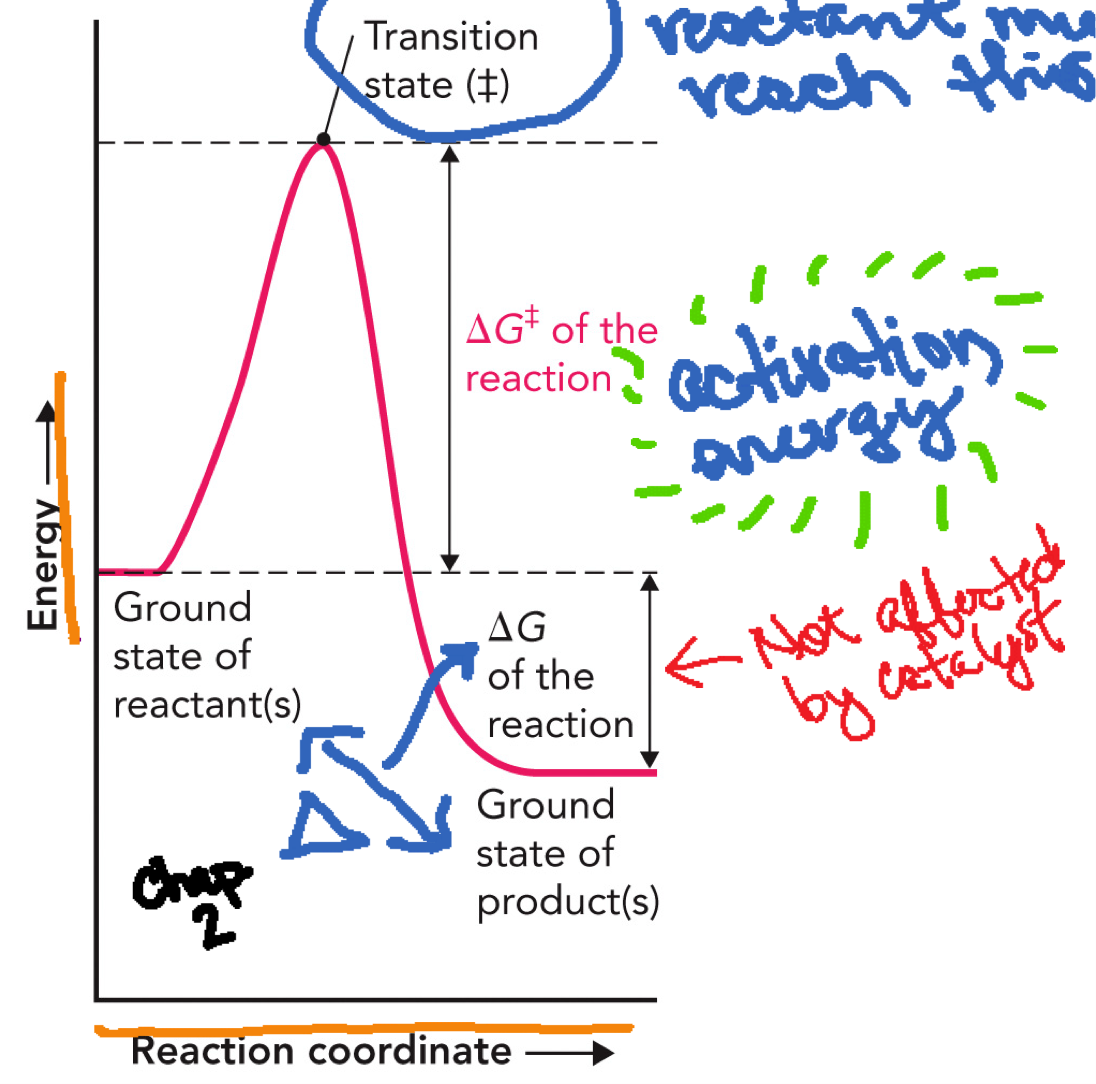
Reaction Coordinate Diagram
X-Axis: Reaction coordinate
Y-Axis: Free energy (G)
Reactants (ground state): Starting energy level
Curve rises → Transition state (‡): Highest energy point, unstable
Curve falls → Products (ground state): Final energy level, can be lower or higher than reactants
Activation energy (Ea or ΔG‡): From reactants → transition state, energy needed to start the reaction, this is what enzymes LOWER
ΔG (free energy change of reaction): From reactants → products, tells whether reaction is favorable, does NOT change with enzymes
Products lower than reactants → Exergonic (ΔG < 0) (favorable)
Products higher than reactants → Endergonic (ΔG > 0)
Cofactors
Non-protein/amino acid, inorganic molecules required for enzyme activity within the active site
Metal ions like:
Fe2+ (iron)
Cu 2+ (copper)
Mg2+ (magnesium)
Helps with charge stabilization and substrate binding
Can be organic (COENZYMES)
Coenzymes
Organic cofactors often vitamin-derived.
Niacin B3 → NAD+
Riboflavin B2→ FAD
Vitamin B7 → Biotin
Vitamin B1 → Thiamine Pyrophosphate (TPP)
Pantothenic acid - Coenzyme A
Carry electrons, transfer chemical groups,
Prosthetic groups: coenzymes that are permanently bound with enzymes such as the heme group of erythrocyte catalase
Apoenzyme
Enzyme without cofactor (inactive)
Holoenzyme
Enzyme + cofactor/coenzyme (active)
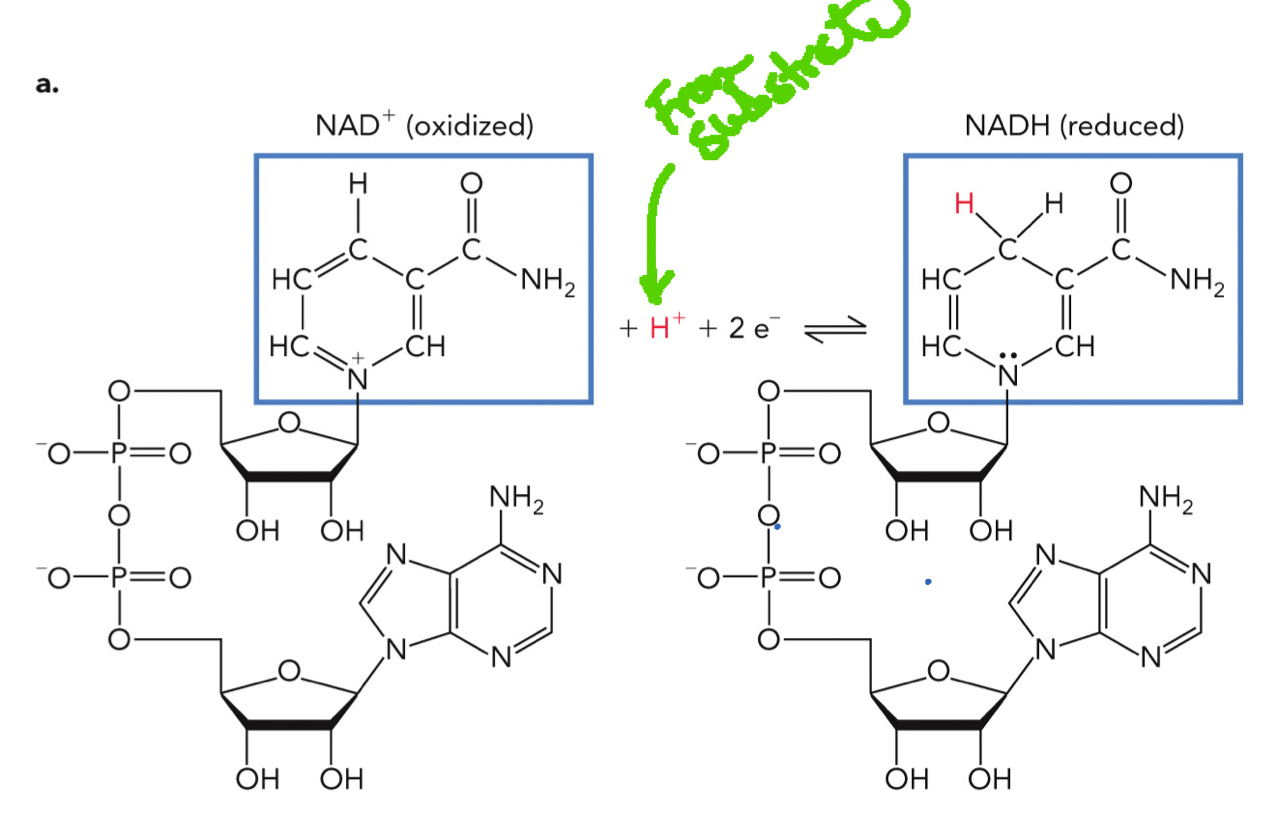
NAD+/NADH Redox Reaction
Enzyme (dehydrogenase) has an active site
Substrate binds
NAD+ also binds (coenzyme)
Substrate loses a hydride (H-) and 2 e- (oxidized)
NAD+ accepts the hydride and becomes NADH (reduced)
NAD+/NADH is derived from vitamin B3 (niacin) and is used as a coenzyme for lactate dehydrogenase
Common metal ion cofactors
Redox reactions: Fe²⁺, Cu²⁺, Mn²⁺
Stabilizing charges/binding ATP: Mg2+
Substrate binding/catalysis/deprotonation: Zn2+
Required in catalytic site: Ni2+
Increase enzyme activity: K+
Enzyme nomenclature
Most enzymes end in “ase” and substrate is usually included in name
Oxidoreductase: Redox reactions EX: oxidase, dehydrogenase
Transferase: Transfer functional group EX: Kinases, transaminases
Hydrolase: Formation of two products using by hydrolyzing a substrate EX: Peptidases, lipases
Lyase: Break or form double bond without water/atp EX: decarboxylases, carboxylases
Isomerase: Rearrange atoms within molecule EX: Mutases, isomerases
Ligase: Join molecules using ATP, EX: Synthetases
Enzymes affect Reaction Rates
Enzymes speed up reactions
Lower activation energy (ΔG‡): Enzymes stabilize transition state (‡) which lowers activation barrier
Provide alternative path for product formation: Stabilize intermediates by forming noncovalent weak reactions
Reduce entropy: Orientating the substrates appropriately for reaction to occur and to hold enzymes in the right position
Enzymes function as catalysts by providing a physical + chemical environment
Increasing local substrate concentration [S] through selective binding and orients substrates for efficient functional group interaction.
Reactive groups that participate in the reaction itself
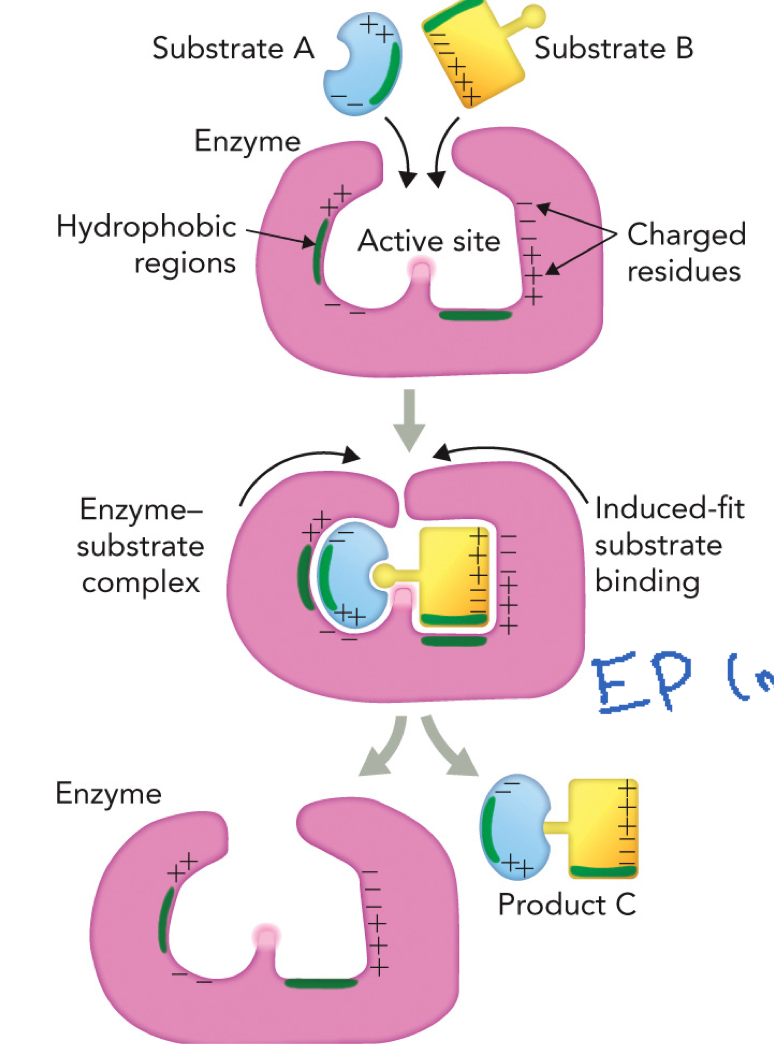
Provide a specific environment:
Hydrophobic regions → bind nonpolar parts
Charged residues → interact with charged groups
Physical and Chemical Properties of Active Sites Mechanism
Enzyme site provides an optimal physical and chemical environment that promotes product formation
Reaction sequence steps:
Substrates bind: E + S → ES, Substrate A and B enter active site
Induced fit: Enzyme changes shape, substrates held tightly and properly oriented
Catalysis: Bonds rearranged, ES → EP (enzyme-product complex)
Product release: EP → E + P, enzyme returns to original state
Random collision between substrates without enzyme are inefficient due to misalignment of reactive groups
The enzyme site selects correct substrates and aligns reactive groups by using weak interactions through polar and nonpolar regions in the substrates and enzyme
Chemical groups present in the enzyme or cofactors are close to substrates
If there are two substrates, one could be a cofactor/coenzyme
Active Sites Contribute to Catalytic Properties (Part 1)
Sequestered microenvironment: Active site isolated from surrounding solution (water)
Provides optimal orientation of substrate relative to reactive chemical group and increase reactivity of functional groups
Excludes water and prevents unwanted side reactions to create a controlled environment. Put the reaction in a dry room (it’s wet outside).
Induced-fit mechanism of substrate binding which conformational changes eject H2O
Gated hydrophobic channel control substrate entry and product exit to exclude water and control substrate entry and product exit
Active Sites Contribute to Catalytic Properties (Part 2)
Binding interactions between the substrate and the enzyme to stabilize the transition state (‡)
Active Sites Contribute to Catalytic Properties (Part 3)
Catalytic functional groups in the active site, derived from amino acid side chains or cofactors, participate directly in converting substrates to products by facilitating reactions through mechanisms such as:
Acid-base catalysis
Covalent catalysis
Metal ion catalysis
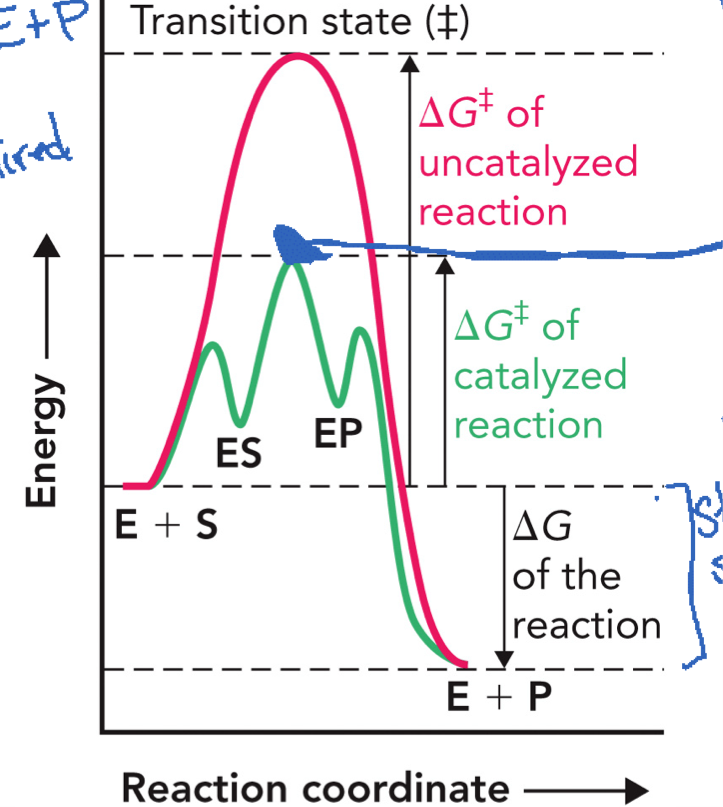
Catalyzed vs Uncatalyzed Reaction Diagram
X-Axis → reaction coordinate
Y-Axis → free energy (G)
Uncatalyzed reaction: starts at E + S, goes up to a HIGH transition state (‡), comes down to E + P (slow reaction)
Catalyzed reaction (with enzyme): E + S → ES → EP → E + P, first small rise → ES complex forms, then a lower peak (transition state), then drops to EP, then to E + P (faster reaction)
ΔG of the reactions (reaction → products) stays the SAME
Many weak bonds/interactions between substrate and enzyme releases energy, which help LOWER the activation energy (ΔG‡)
Kd (dissociation constant)
General binding strength (ANY ligand)
Used for:
Substrates
Inhibitors
Common Catalytic Mechanisms (part 1)
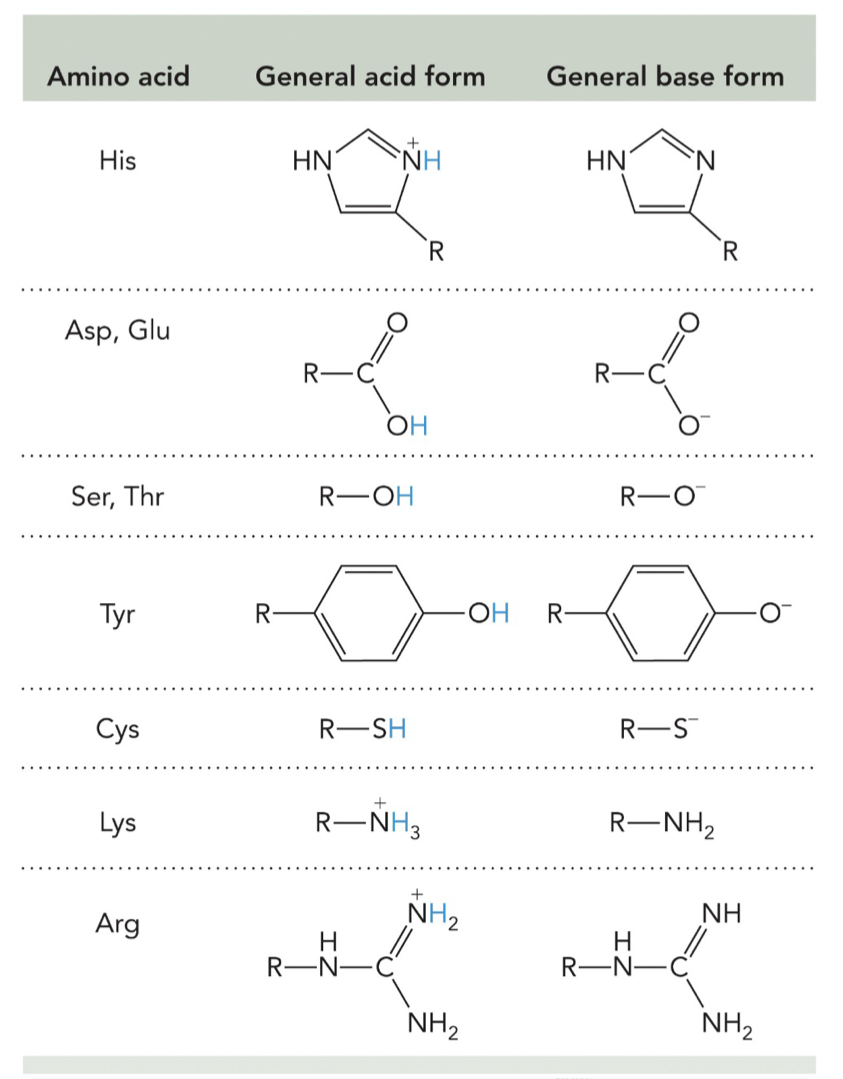
Acid-Base catalysis: Functional group donates protons that either involves water (specific acid-base) or a functional group (general acid-base) to substrate, causing it to break a bond and form new bonds → product.
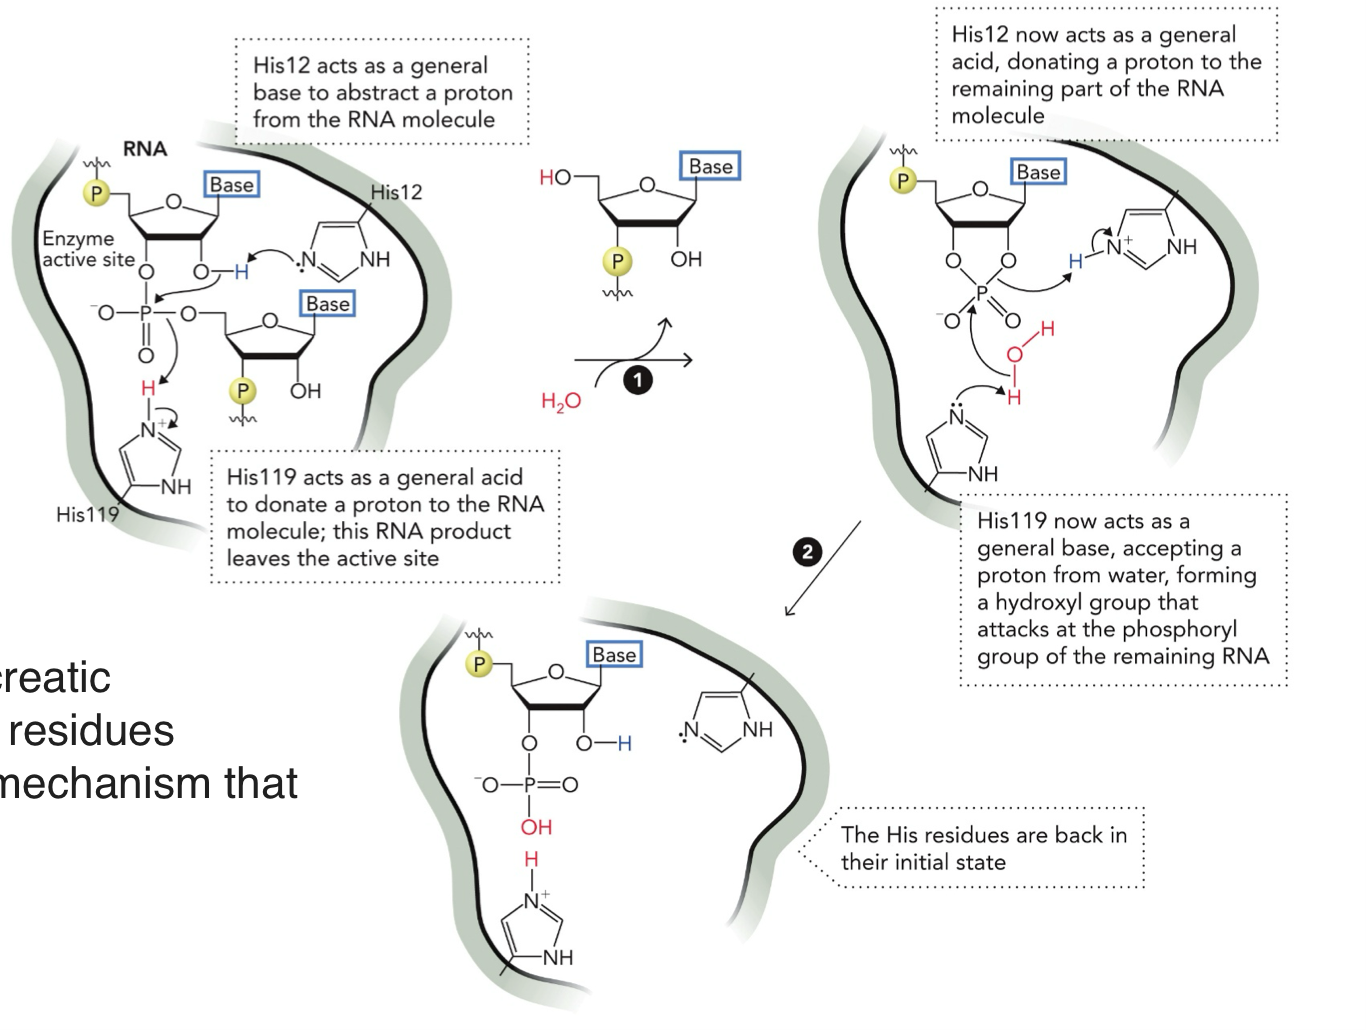
Mechanism of RNA cleavage by pancreatic ribonuclease (enzyme)
STEP 1:
His12 = BASE - takes H+ from RNA (OH group)
His119 = ACID - donates H+ to leaving group (RNA piece)
RNA bond is broken, one piece leaves
STEP 2: H2O enters
His119 = BASE - takes H+ from water (H2O), turns water into OH- (strong nucleophile
His12 = ACID - gives H+ to RNA intermediate
OH- (hydroxyl) attacks phosphate, final product forms
STEP 3:
Both histidines go back to their original state
His12 = BASE
His119 = ACID
Common Catalytic Mechanisms (part 2)
Covalent cataysis
Enzyme reactive amino acid (like Ser, Cys) attack the substrate and temporarily bonds to the substrate, forming a temporary covalent bond. This creates an intermediate (multiple steps) where now the bonds breaks and substrate is able to form new bonds → product
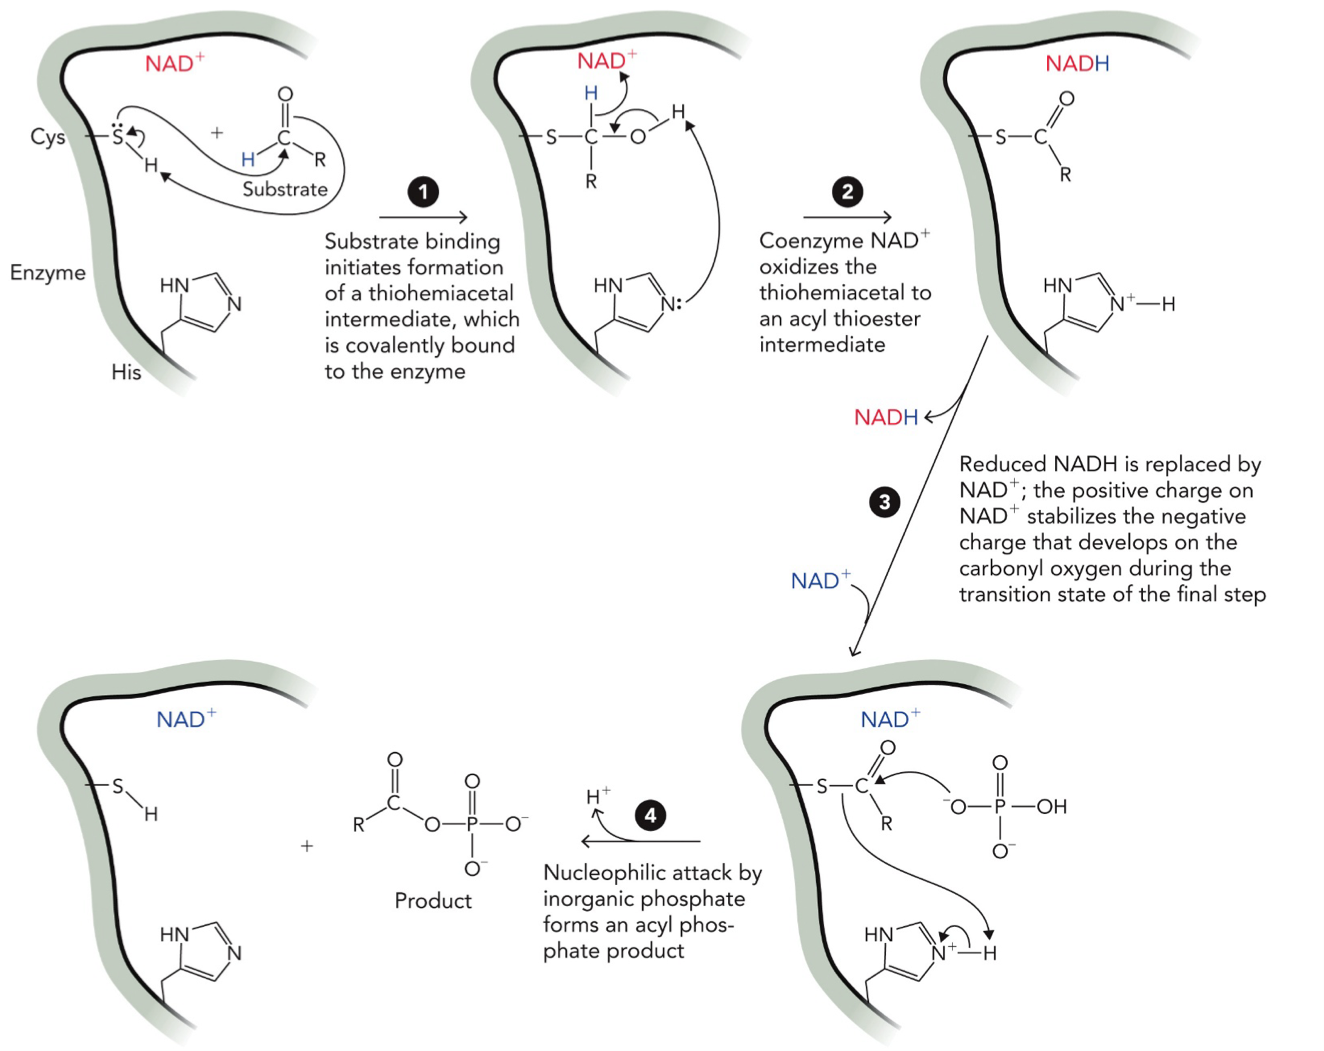
Formation of 1,3-biphosphoglycerate from glyceraldehyde-3-phosphate by the glycolytic enzyme glyceraldehyde-3-phosphate dehydrogenase
STEP 1: Covalent bond formation (thiohemiacetal)
Cys loses its H → becomes S- (nucleophile), that H is transferred to the substrate oxygen (O → OH). Cys-S- attacks the carbon of the substrate to form thiohemiacetal intermediate (enzyme covalently attached)
STEP 2: Proton rearrangement (His involved)
His removes a proton (H) from the intermediate to stabilize structure and prepare for oxidation (loss of H)
STEP 3: Oxidation by NAD+
NAD+ takes hydride (H-) from the intermediate. NAD+ → NADH, intermediate becomes acyl thioester (S-C=O)
STEP 4: NADH leaves, NAD+ returns
NADH leaves the enzyme, new NAD+ binds
STEP 5: Phosphate attack (Pi)
Nucleophilic Inorganic phosphate (Pi) attacks the carbonyl carbon and H of Pi is removed by His, Cys breaks bond between enzyme (Cys) and substrate by taking H from His and forming (S-H). This forms 1,3-biphosphoglycerate (product)
Common Catalytic Mechanisms (part 3)
Metal ion catalysis: help stabilize unstable charges in reactions by creating a strong nucleophile and positioning/orienting substrates properly
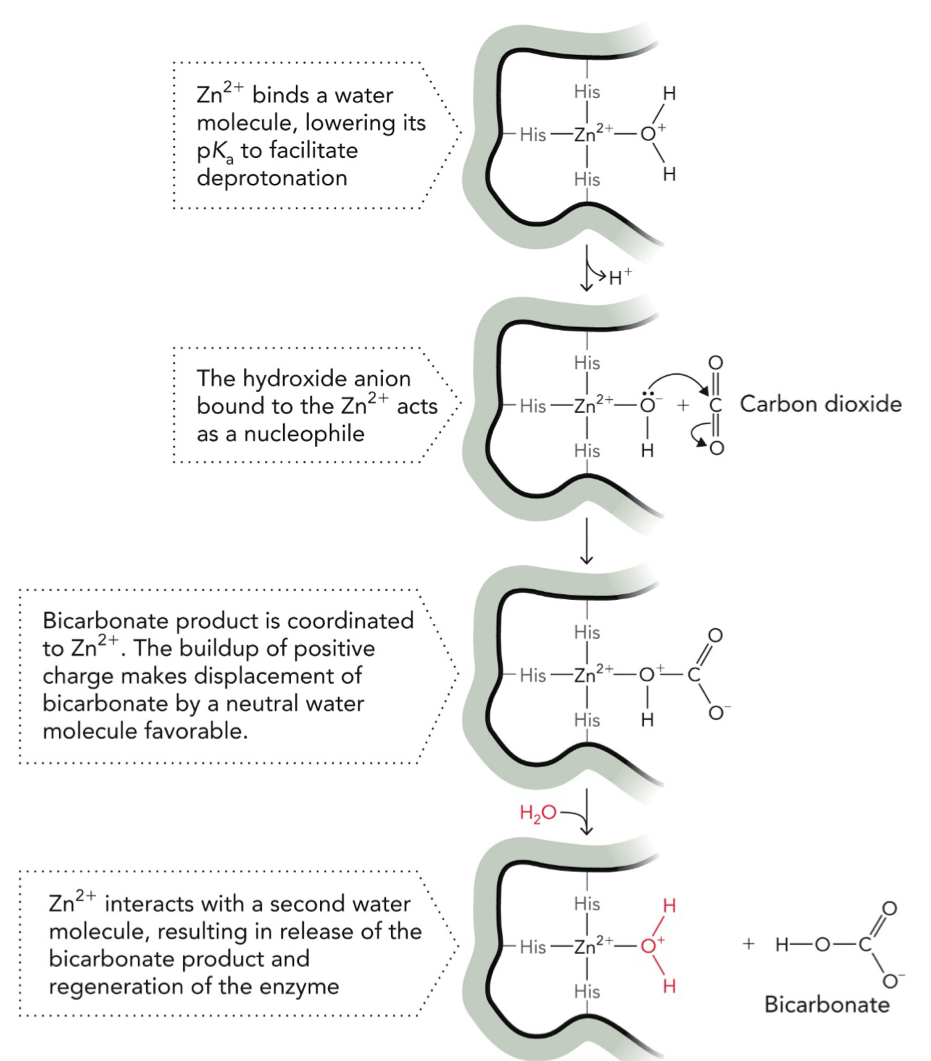
Carbonic anhydrase reaction uses a coordinated Zn2+ ion as a catalytic group that supports the nucleophilic attack on the CO2 substrate, yielding biocarbonate
Metal Ion Catalysis (Zn2+) to convert CO2 → (bicarbonate)
STEP 1: Zn2+ activates water
Zn2+ binds H2O, makes it easier to deprotonate/lose H+ (lowers pKa)
Water → OH-
STEP 2: Nucleophilic attack
OH- (on Zn2+) acts as a nucleophile, attacks carbon of CO2, forms bicarbonate (HCO3-)
STEP 3: Product bound to Zn2+
Bicarbonate stays attached to Zn2+. The buildup of positive charge makes replacement of bicarbonate by neutral water favorable.
STEP 4: Product release
A new H2O comes in, it kicks bicarbonate off Zn2+
STEP 5: Enzyme resets
New water binds Zn2+, ready for next cycle
Enzyme-Mediated Reactions (part 1)
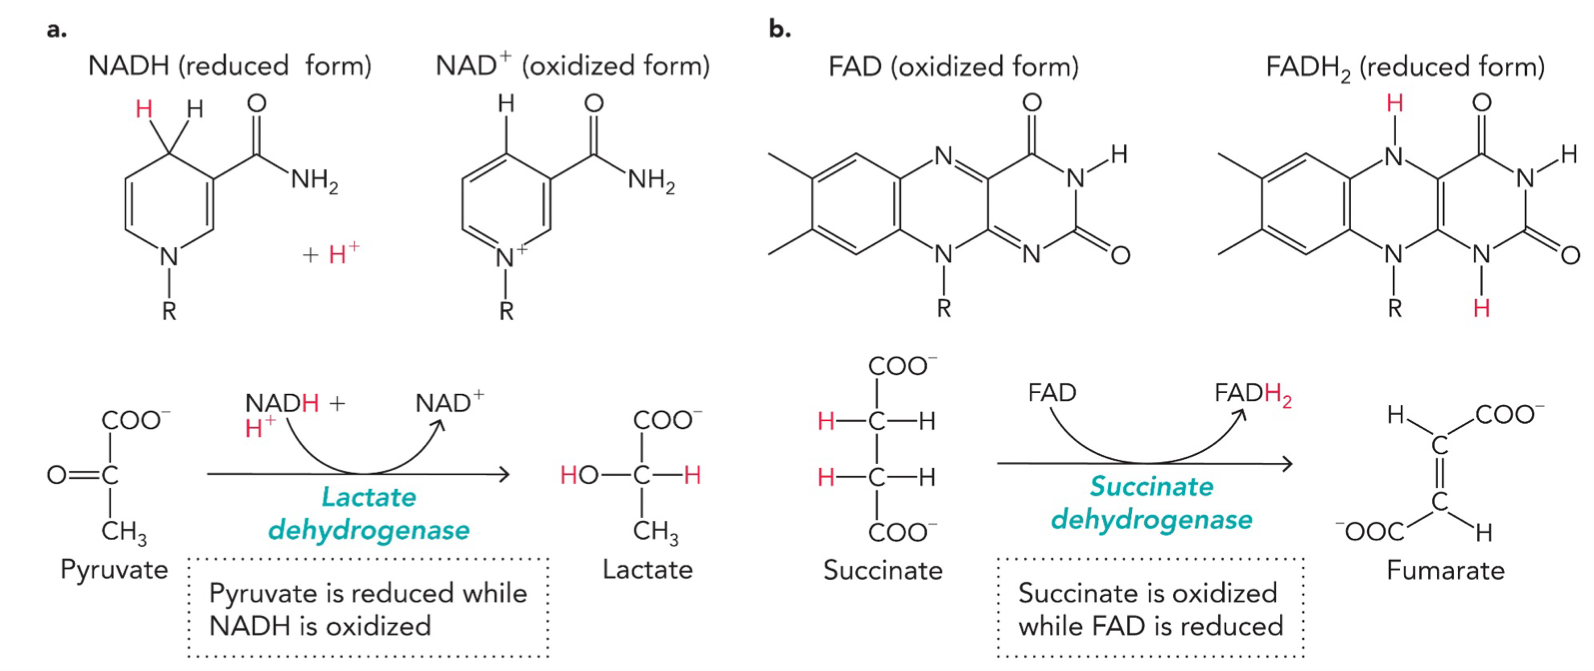
Coenzyme-dependent redox reactions: Enable enzymes to transfer electrons, capture and release energy, and transport electrons
EXAMPLE 1: Lactate dehydrogenase (enzyme)
Reaction:
NADH → NAD+: loses electrons, oxidized, NADH gives hydride (H-) and H+
Pyruvate → Lactate: gains electrons, reduced, accepts hydride (H-) and H+
EXAMPLE 2: Succinate dehydrogenase (enzyme)
Reaction:
FAD → FADH2: gains electrons, reduced, accepts 2 H atoms
Succinate → Fumarate: loses electrons, oxidized, loses 2 H atoms
Enzyme-Mediated Reaction (part 2)
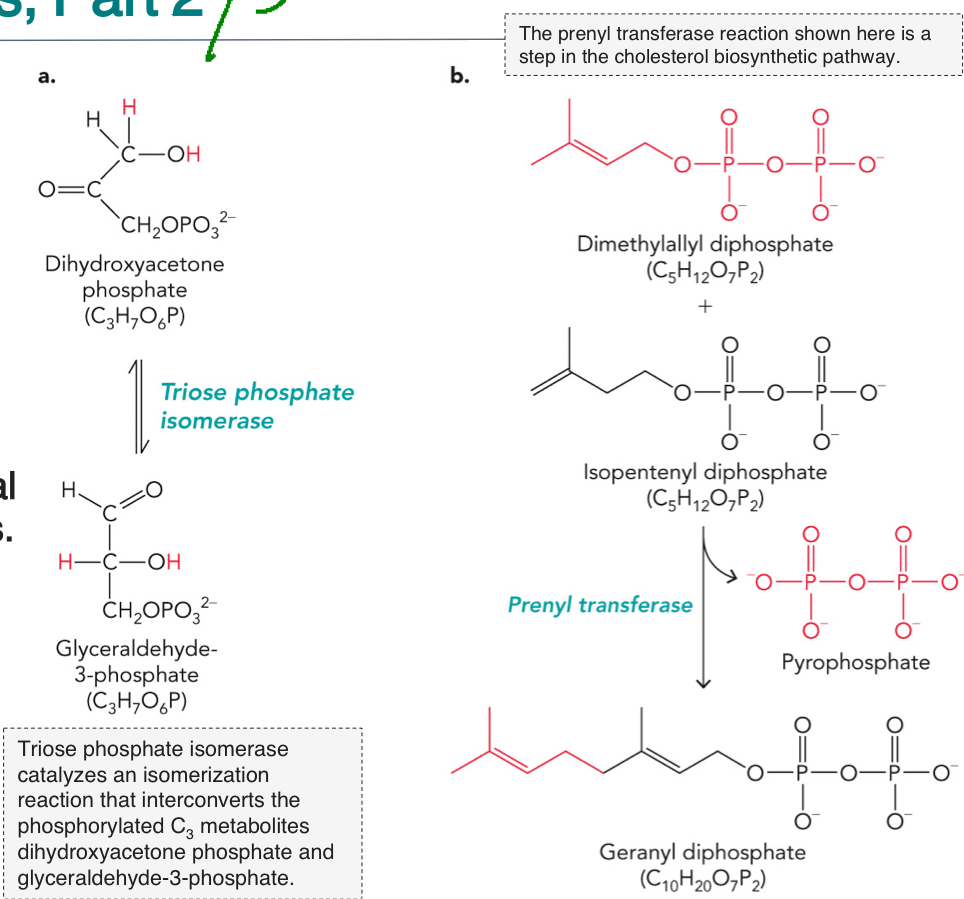
Metabolic transformation reactions: Involves isomerization condensations and dehydration (hydrolysis) reactions
Isomerization: generates a produce that has the same formula as the substrate, different shape
Condensation: Combination of two substrates with the same molecular formula to form a bigger molecule to function as building blocks for larger molecules (usually by losing water)
EXAMPLE 1: Isomerization
DHAP ⇌ G3P (Triose Phosphate Isomerase)
STEP 1: DHAP binds to the enzyme (triose phosphate isomerase)
STEP 2: The enzyme removes a proton (H+) to form enediol intermediate
STEP 3: The enzyme repositions the double bond
STEP 4: A proton is added back in a different position to form Glyceradlehyde-3-Phosphate
EXAMPLE 2: Condensation
DMAPP + IPP → GPP (Prenyl transferase)
STEP 1: DMAPP binds enzyme, pyrophosphate (PPi) leaves, forms a carbocation
STEP 2: IPP attacks carbocation
STEP 3: New C-C bond forms
STEP 4: Products rearrange slightly, forms Geranyl diphosphate
Enzyme-Mediated Reaction (part 3)
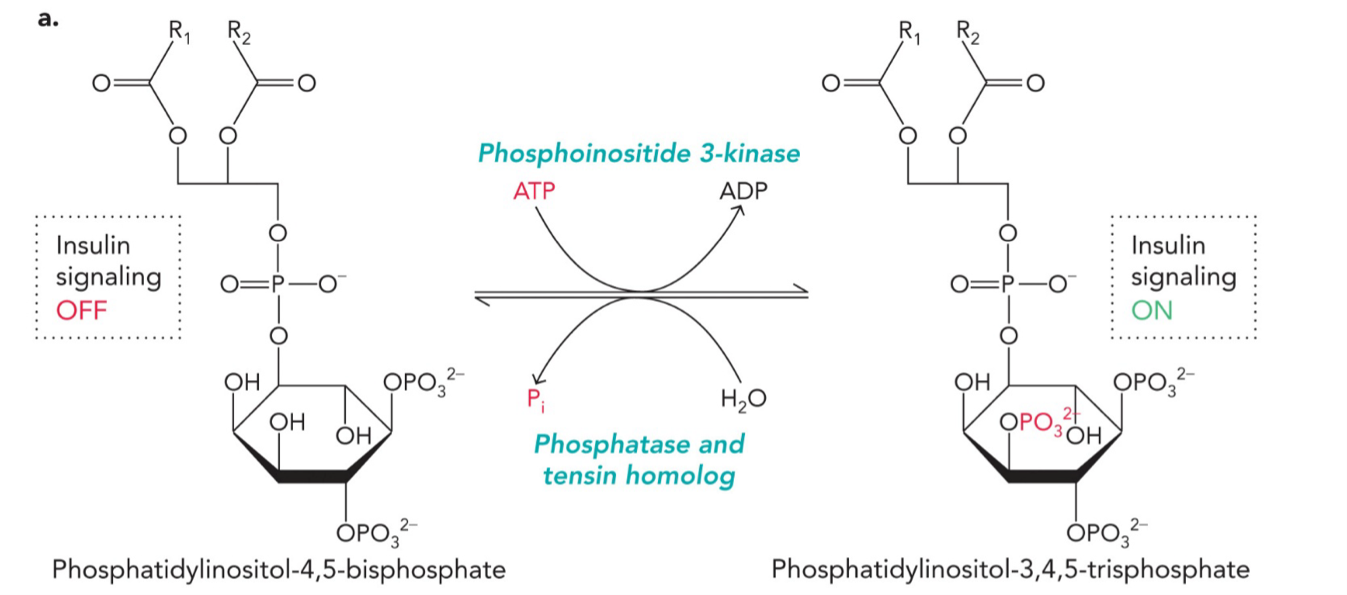
Reversible covalent modifications: Molecular switches that turn on/off cell signaling and gene expression
Kinases, phosphatases
ATP is phosphoryl group source
PIP2 = phosphatidylinositol-4,5-bisphosphate (insulin signaling OFF)
PIP3 = phosphatidylinositol-3,4,5-trisphosphate (insulin signaling ON)
FORWARD REACTION (turns signaling ON)
Enzyme: Phosphoinositide 3-kinase (PI3K)
STEP 1: PIP2 binds enzyme
STEP 2: ATP donates a phosphate group and is converted to ADP
STEP 3: That phosphate is added to the molecule (PO32-)
REVERSE REACTION (turns signaling OFF)
Enzyme: Phosphatase and tensin homolog
STEP 1: PIP3 binds enzyme
STEP 2: Water (H2O) is used to remove phosphate
STEP 3: Phosphate is released as Pi (inorganic phosphate)
Core concepts in enzymology
Substrates bind to enzyme active sites through weak noncovalent interactions, which orient amino acid functional groups within close proximity to substrate reactive centers
Enzymes use conventional catalytic reaction mechanisms that follow basic organic chemistry
Examples:
Chymotrypsin: Covalent catalysis +acid-base
Enolase: Metal ion catalysis
HMG-CoA reductase: Redox reaction
Why we study chymotrypsin
Enzyme of the digestive system - catalyzes peptide hydrolysis (break peptide) on the carboxyl group of aromatic amino acids like Phe, Tyr, or Trp, or on the carboxyl group of large hydrophobic amino acids.
Protein breakdown = protein turnover, removes damaged protein and recycle amino acids. Absorption in gut.
Hydrolysis is favorable but slow, without enzyme can take 10+ years
Chymotrypsinogen
Chymotrypsinogen is a 245-residue polypeptide. It is the inactive zymogen (precursor) of the digestive enzyme chymotrypsin, it’s made in the pancreatic acinar cells and secreted into the duodenum. It is inactive to prevent premature protein digestion, protecting the pancreas from damage.
Activation mechanism of chymotrypsinogen
STEP 1: Trypsin cleavage, cuts between Arg15 - Ile16
This causes a conformational change that forms the active site
STEP 2: Autolysis, chymotrypsin cleaves itself at Thr147-Asn148, resulting in active, mature chymotrypsin.
Structural change of chymotrypsinogen
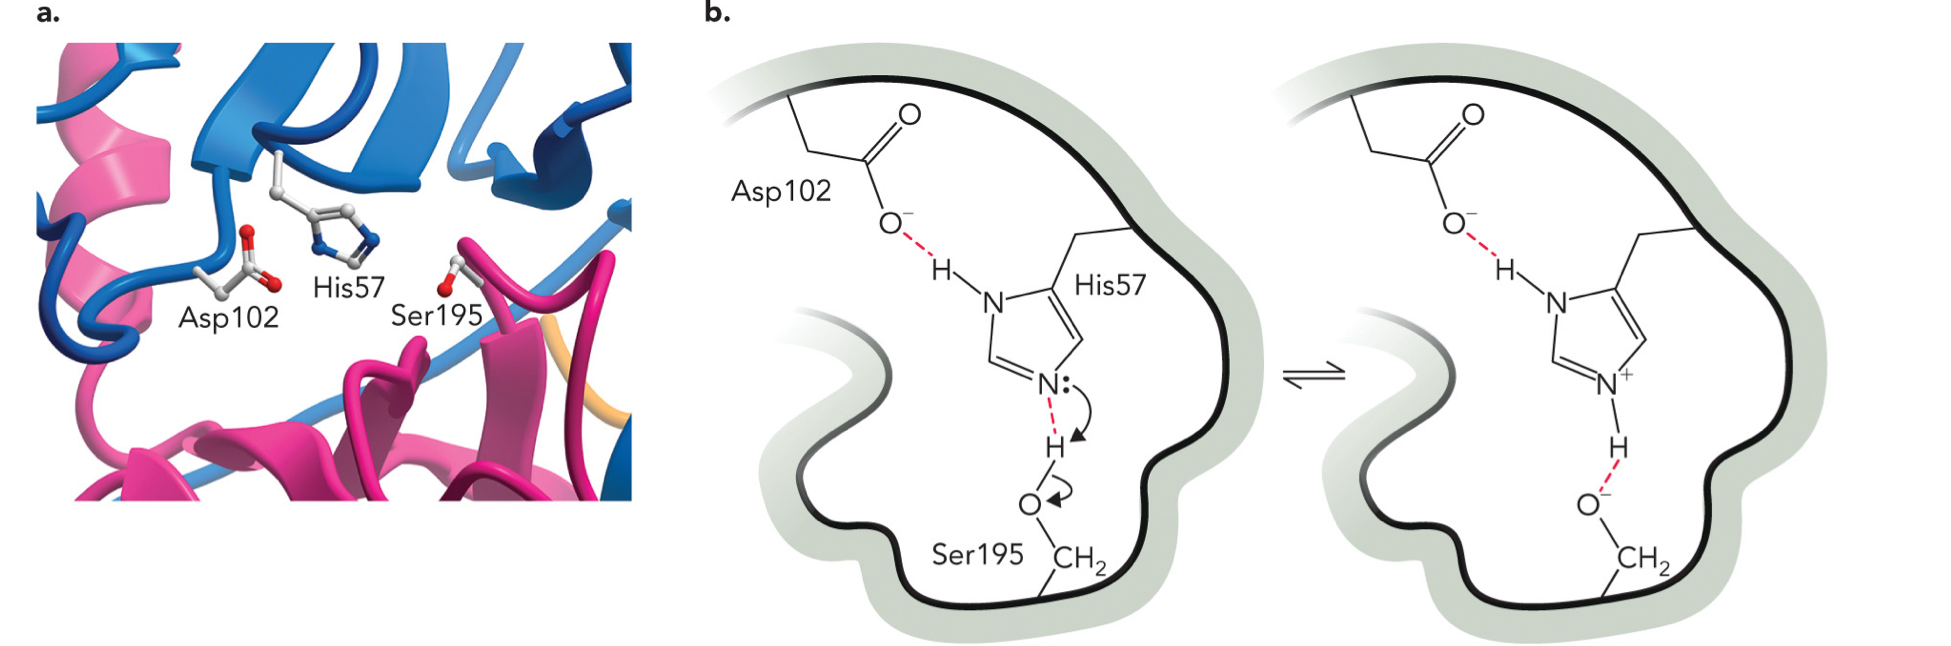
Starts as single chain and becomes 3 chain active enzyme held together by disulfide bonds, this enzyme is serine protease. It uses Serine (Ser195) in the active site, also uses histidine (His57) and aspartate (Asp102) (catalytic triad)
B chain: His57 and Asp102
C chain: Ser195
Function of active chymotrypsin
Once activated in the small intestine, it functions as a serine protease, specifically cleaving peptide bonds adjacent to aromatic amino acids like tyrosine, phenylalanine, and tryptophan
Chymotrypsin: A Serine Protease
Involves covalent and acid-base catalysis. Uses a catalytic triad (His57, Asp102, Ser195) to form a hydrogen-bonded network required for catalysis. Ser is converted to a highly reactive nucleophile.
STEP 1: Asp activates His, Asp stabilizes His making His a stronger base
STEP 2: His takes H+ from Ser, Ser becomes O- (very reactive nucleophile), this is proton transfer (acid base reaction)
STEP 3: Ser attacks substrate, Ser-O- attacks the peptide bond carbon, this is covalent catalysis
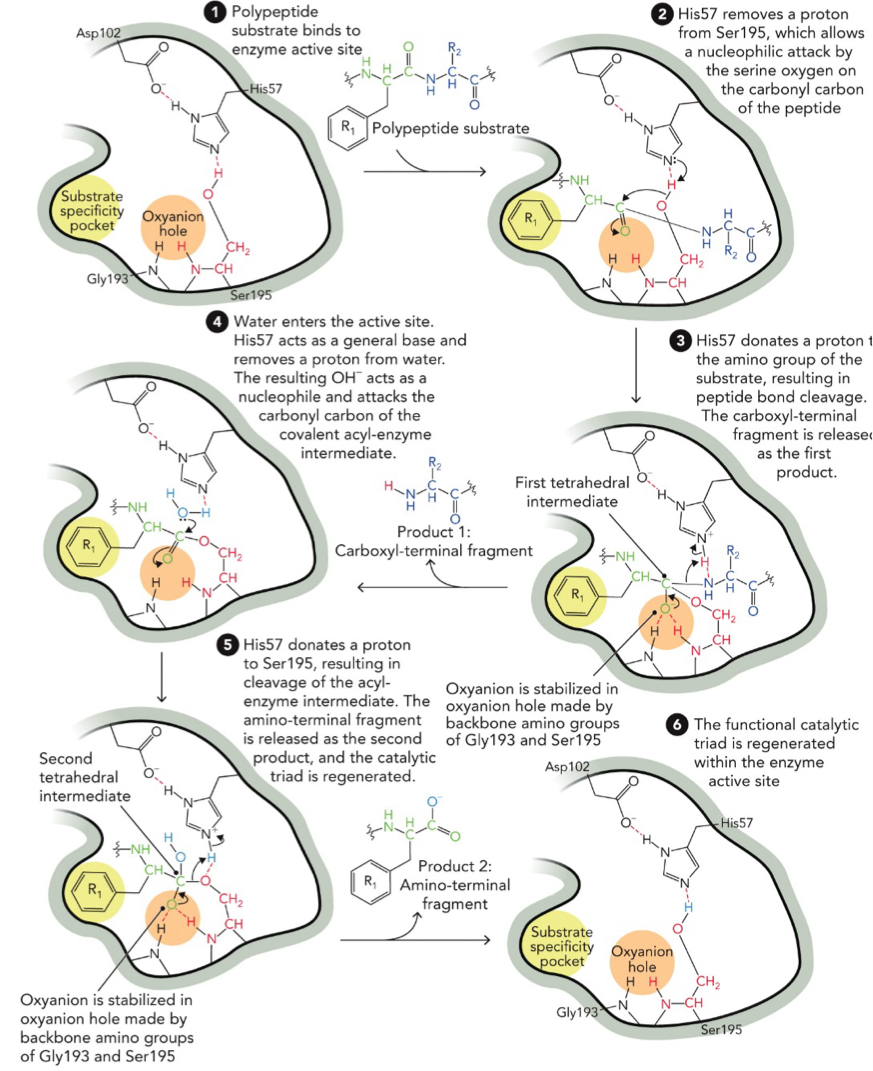
Catalytic Mechanism for Chymotrypsin
Covalent catalysis and acid-base catalysis
Substrate binds: polypeptide substrate enters the enzyme active site. It fits into the substrate specificity pocket and oxyanion hole
His57 removes a proton (H+) from Ser 195, which allows a nucleophilic attack by the serine oxygen (O-) on the carbonyl carbon of the peptide
His57 donates a proton to the amino group of the substrate, resulting in peptide bond cleavage. The carboxyl-terminal fragment is released as the first product.
Water enters the active site, His57 acts as a general bas and removes a proton from water. The resulting OH- acts as a nucleophile and attacks the carbonyl carbon of the covalent acyl-enzyme intermediate.
His57 donates a proton to Ser 195, resulting in cleavage of the acyl-enzyme intermediate. The amino-terminal fragment is released as the second product, and the catalytic triad is regenerated
The functional catalytic triad is regenerated within the enzyme active site
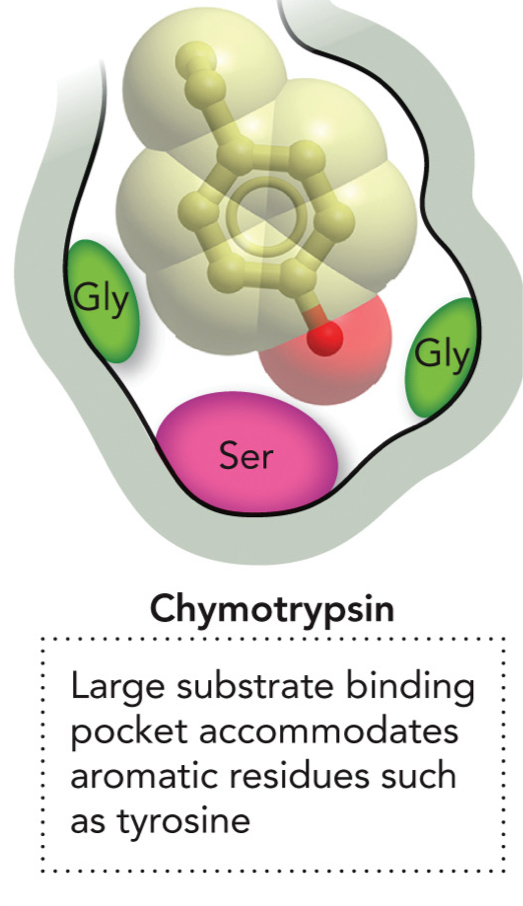
Enzyme specificity for binding pockets of Chymotrypsin
Large hydrophobic substrate binding pocket accommodates aromatic residues such as tyrosine. Has Ser at the bottom, and 2 Gly.
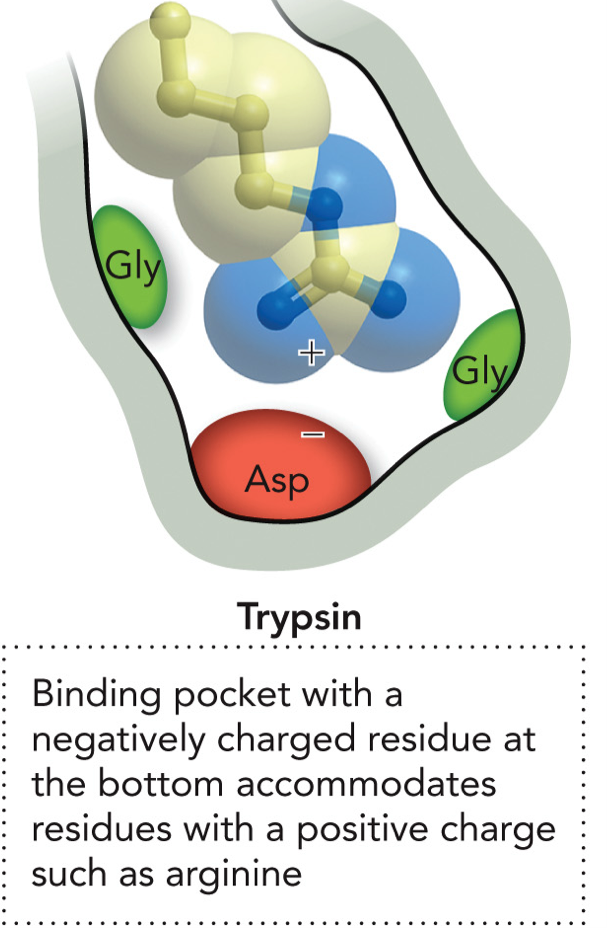
Enzyme specificity for binding pockets of Trypsin
Binding pocket with a negatively charged residue at the bottom accommodates residues with a positive charge such as arginine and lysine. Has Asp at the bottom and 2 Gly.
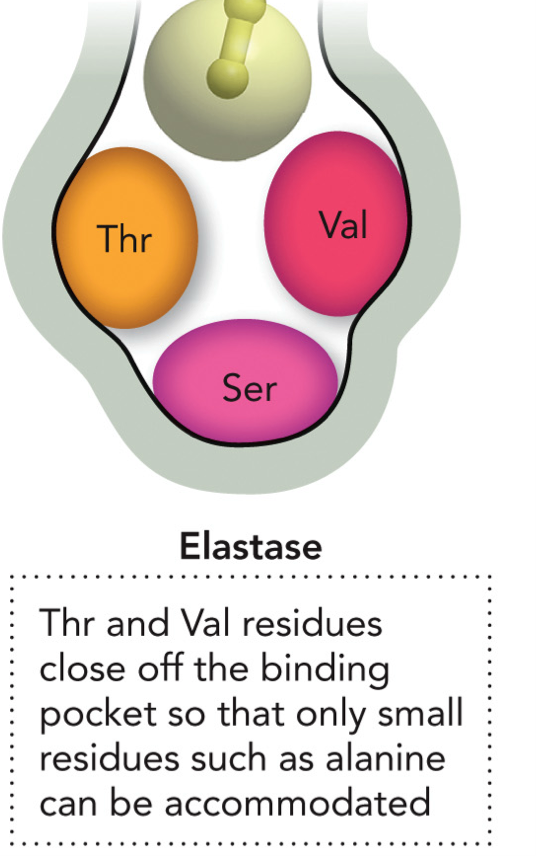
Enzyme specificity for binding pockets of Elastase
Thr and Val residues close off binding pocket so that only small residues such as alanine can be accommodated. Ser at the bottom.
Enolase: A Metalloenzyme
Glycolytic enzyme that is also used in gluconeogenesis. Active site contains two divalent (+2) metal ions required for catalysis. Uses general acid-base catalysis as well as metal ion catalysis in its reaction mechanism
Enolase Active Site
Residues in active site are arranged for recognition of substrate and promote catalysis
Lys396 + Gly167 form an ionic bond and hydrogen bond with the carboxylate group of the substrate (2-phosphoglycerate)
His159 makes a hydrogen bond with the phosphoryl group of the substrate
Arg374 interacts with Lys345 to help Lys345 act as a general base
Negatively charged Asp + Glu residues hold positive metal ion Mg2+ in place, which stabilizes negative charges during reaction
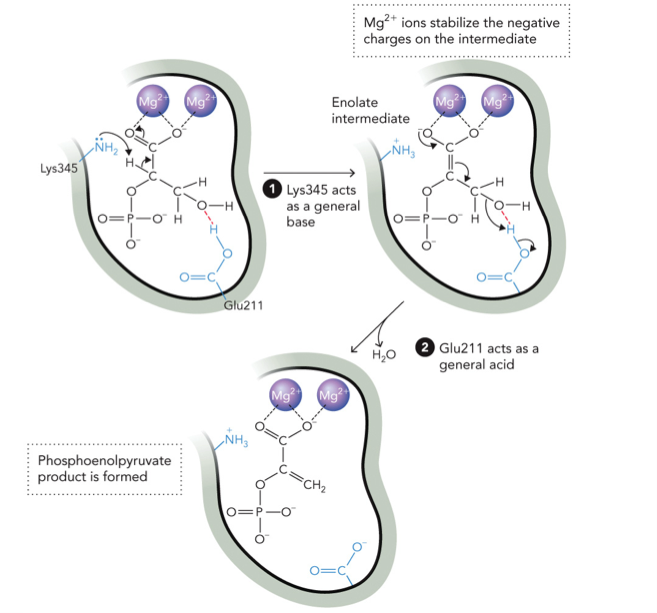
Catalytic Mechanism for Enolase
STEP 1: Lys345 removes a proton (H+) from the alpha carbon (C-H next to carbonyl), this creates enolate intermediate
Electrons shift:
C-H → C=C
C=O → O-
STEP 2: Mg2+ stabilizes the negative charge, Glu211 acts as acid and donates H+ to the -OH group, this converts -OH → good leaving group (H2O)
STEP 3: Elimination, water leaves (H2O removed), double bond forms, Phosphoenolpyruvate product is formed
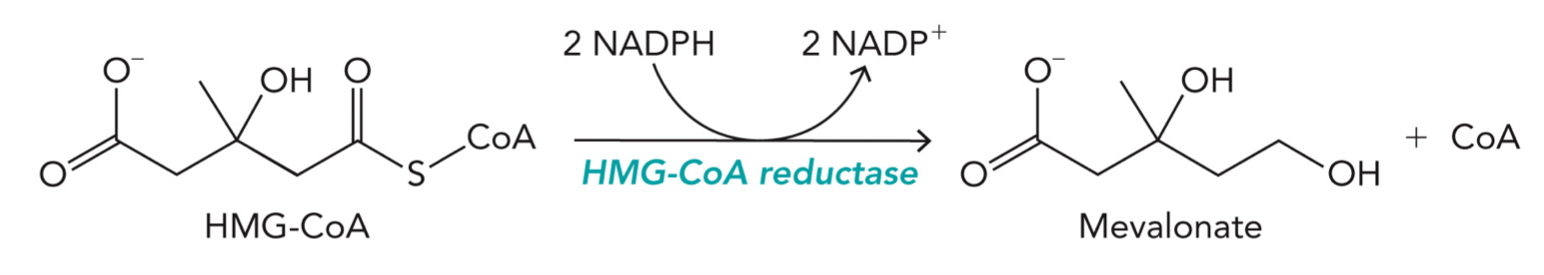
HMG-CoA Reductase (HMGR)
An enzyme involved in cholesterol, inhibitors directly reduce serum cholesterol levels, contains four active sites for the substrate and cofactor (NADPH) to bind
HMG-CoA reductase catalyzes the NADPH-dependent reduction of a thioester to a primary alcohol, producing mevalonate and CoA
2 NADPH → 2 NADP⁺
C=O - SCoA → CH2OH + CoA
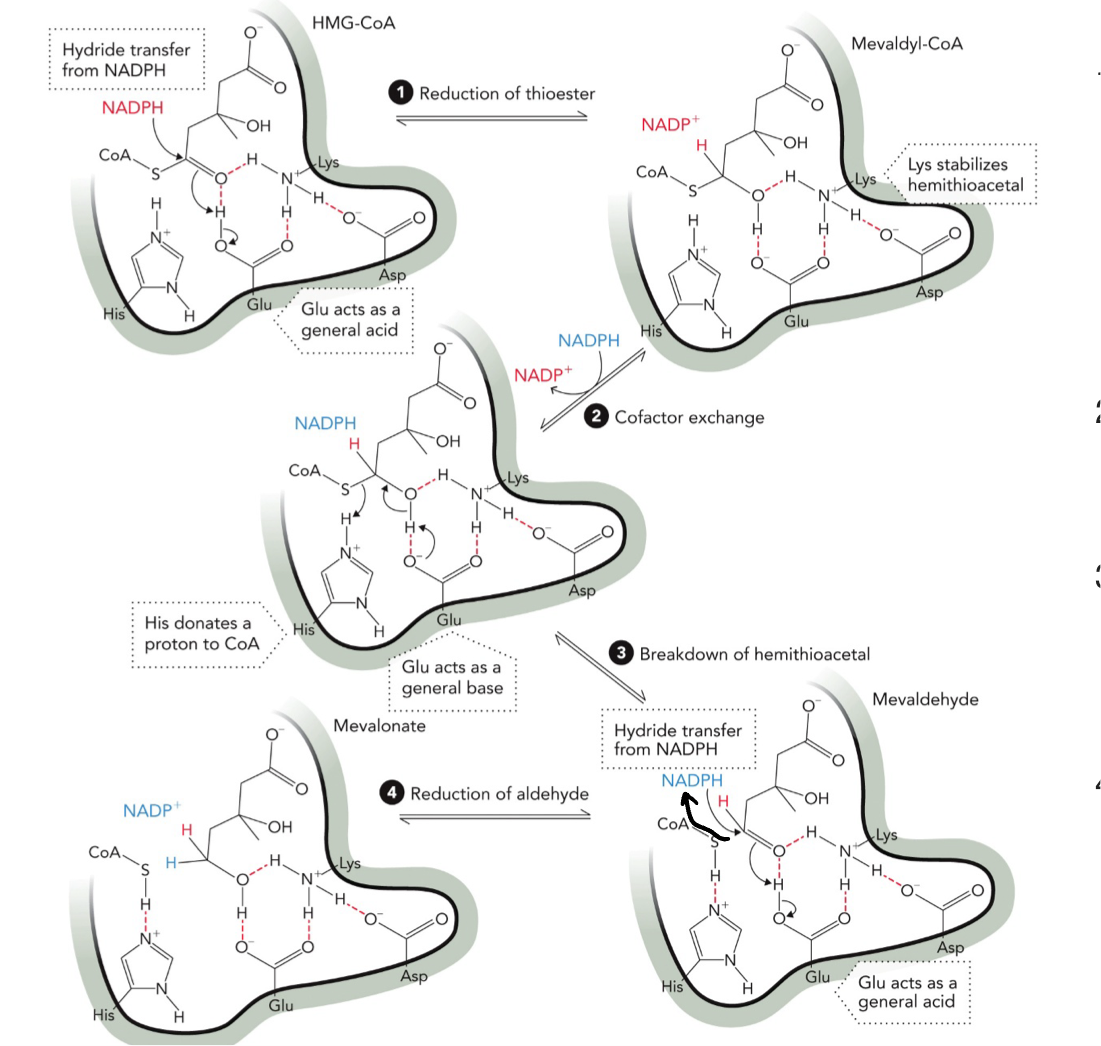
HMG-CoA Reductase Mechanism
STEP 1: First hydride transfer, NADPH → donates hydride (H-) and attacks carbonyl carbon of thioester. Forms oxyanion intermediate, Lys stabilizes negative charge, Glu acts as acid → gives H+, product hemithioacetal (mevaldyl-CoA)
STEP 2: Cofactor exchange NADP+ leaves and new NADPH binds
STEP 3: Glu acts as BASE now, removes H from the -OH, this helps break the C-S (CoA) bond. His donates H+ to CoA, makes CoA-SH leave. Product: aldehyde (mevaldehyde)
STEP 4: Second NADPH donates hydride (H-), attacks aldehyde carbon, Gly donates H+ again, mevalonate (alcohol formed) and NADP+
Enzyme Kinetics
The quantitative study of the rate of chemical reactions performed by enzymes
Involves reaction rates to free energy and equilibrium
Velocity (v)
=k[S], reaction rate
Substrate concentration
[S]
Disappearance of substrate
v = -d[S]/dt, how fast substrate is being used up in a given unit of time, S decreases
Appearance of product
v = d[P]/dt, how fast product is being formed, change in [product] in a given unit of time, P increases
Rate constant k
Rate constant of a reaction, tells us the rate of a step. Rate of a reaction (v) depends on concentration of substrate For first order reactions, depends on one substrate Rate=k[S] or v=k[S]. Rate constant k has units of (time)-1, sec-1, min-1
Second order reactions
Depends on two concentrations, v=k[A][B] or v=k[S]2, units M-1s-1
How to measure enzyme kinetics Product vs Time graph
x-axis: time
y-axis: product
Each curve = different [S]
[S1] low → slow slope
[S4] high → steep slope
Initial velocity is the slope at the very beginning of the curve, dashed line before curve starts bending. v0=d[P]/dt at t = 0
Initial is only at beginning because rate changes over time
![<p>x-axis: time</p><p>y-axis: product</p><p>Each curve = different [S]</p><p>[S<sub>1</sub>] low → slow slope</p><p>[S<sub>4</sub>] high → steep slope</p><p>Initial velocity is the slope at the very beginning of the curve, dashed line before curve starts bending. v0=d[P]/dt at t = 0</p><p>Initial is only at beginning because rate changes over time</p>](https://assets.knowt.com/user-attachments/7cc12deb-caa7-4a96-9401-bcead7ec0f45.png)
How to measure enzyme kinetics Initial velocity vs [S]
x-axis: initial substrate [S]
y-axis: initial velocity
This gives Michaelis-Menten curve, + first order bc low [S]
At low [S] → linear increase
At high [S] → plateaus at Vmax
![<p>x-axis: initial substrate [S]</p><p>y-axis: initial velocity </p><p>This gives Michaelis-Menten curve, + first order bc low [S]</p><p>At low [S] → linear increase</p><p>At high [S] → plateaus at Vmax</p>](https://assets.knowt.com/user-attachments/1a4a5fd0-0db6-45d8-be2c-0cd342019a34.png)
Enzymatic reaction rate slowing down
x-axis: time
y-axis: product formed
High [S] → starts very steep, fast rate, then slows down and plateaus
Slows down because: substrate is getting used up, product is building up and can bind to enzyme and interfere with its function, reverse reaction can start, enzyme denatures over time and loses activity
Low [S] → starts slower, looks more linear (straight), it will slow down over a longer time scale
![<p>x-axis: time</p><p>y-axis: product formed</p><p>High [S] → starts very steep, fast rate, then slows down and plateaus</p><p>Slows down because: substrate is getting used up, product is building up and can bind to enzyme and interfere with its function, reverse reaction can start, enzyme denatures over time and loses activity</p><p>Low [S] → starts slower, looks more linear (straight), it will slow down over a longer time scale</p>](https://assets.knowt.com/user-attachments/d5d74fa1-fa56-48da-b2e6-8909130a3b3b.png)
Enzymatic reactions are measured at the initial velocity
Reaction rate before substrate, [S]»[E], way more substrate than enzyme
Directly proportional to [S] linear slope, usually within 1 min of reaction
High [S] → steeper slope, higher velocity, enzyme works faster in short time and are saturated (all occupied by substrate)
Low [S] → flatter slope, lower velocity, enzyme works slower
![<p>Reaction rate before substrate, [S]»[E], way more substrate than enzyme</p><p>Directly proportional to [S] linear slope, usually within 1 min of reaction</p><p>High [S] → steeper slope, higher velocity, enzyme works faster in short time and are saturated (all occupied by substrate)</p><p>Low [S] → flatter slope, lower velocity, enzyme works slower</p>](https://assets.knowt.com/user-attachments/e9bb170d-7ed8-4233-ab9d-6964c68918d9.png)
Initial velocity vs [S] graph
Hyperbolic: describes shape of curve, starts steep almost linear, then bends, then levels off (plateau). (fast increase → slower increase → flat at Vmax)
Why is it hyperbolic? Combination of both:
LOW substrate ([S] small), many free enzymes available, rate increases proportionally, is linear at start
HIGH substrate ([S] large), enzyme becomes saturated, all active sites occupied, rate stops increasing → reaches Vmax
Rate of product is measured by the rate at increasing substrate concentrations while keeping enzyme concentrations constant
![<p>Hyperbolic: describes shape of curve, starts steep almost linear, then bends, then levels off (plateau). (fast increase → slower increase → flat at Vmax)</p><p>Why is it hyperbolic? Combination of both:</p><p>LOW substrate ([S] small), many free enzymes available, rate increases proportionally, is linear at start</p><p>HIGH substrate ([S] large), enzyme becomes saturated, all active sites occupied, rate stops increasing → reaches Vmax</p><p>Rate of product is measured by the rate at increasing substrate concentrations while keeping enzyme concentrations constant</p>](https://assets.knowt.com/user-attachments/d980db1e-32f8-49c5-9290-b0dc81a9387c.png)
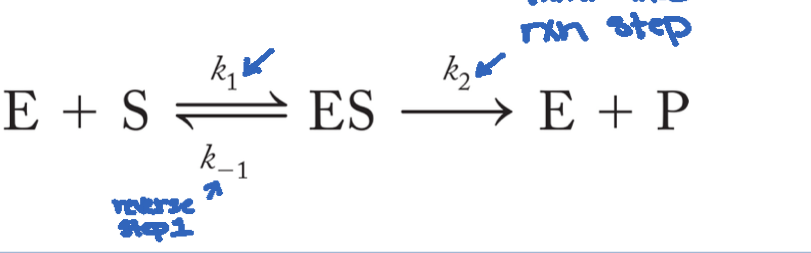
Explaining the shape of the rate curve
Curve (hyperbolic) is explained by this model: E+S⇌ES→E+P. Enzymes that follow this model and are first order reactions are termed Michaelis-Menten enzymes. The curve arises from the formation of ES complex because you cannot reach the transition state without ES first, thus the enzyme stabilizing transition state, then lowering activation energy. Initial velocity ensure negligible reverse reactions because [P] = 0 (since we are only measuring from the initial velocity).
What Michaelis-Menten kinetics tells us
How fast the enzyme works (Vmax)
How efficient the enzyme is (Kcat/Km)
How well substrate binds (Km)
How inhibitors affect activity (changes in Vmax, Km)
Whether enzyme can function in a cell (Km vs physiological [S])
How enzyme is regulated
Drug development
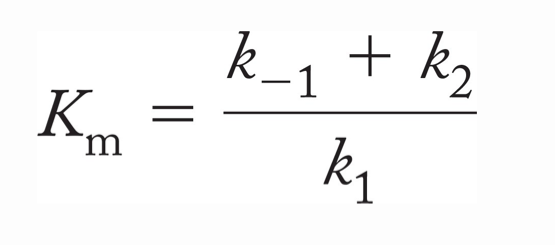
Michaelis-Menten constant (Km)
For the substrate
How well enzyme binds substrate
Lower Km = better binding
Describes rates of breakdown and formation of ES
Km= (k-1 + k2)/k1
Michaelis-Menten equation
Describes the variation of enzyme activity as a function of substrate concentration vo=Vmax[S]/Km+[S]
![<p>Describes the variation of enzyme activity as a function of substrate concentration v<sub>o</sub>=Vmax[S]/Km+[S]</p>](https://assets.knowt.com/user-attachments/954013a9-c3d3-4195-bd68-0bf969c38c29.png)
Major assumptions of Michaelis-Menten
Steady state condition, stable [ES]
[S] » [E]
[E]total is constant, so [E]total = [E] + [ES]
Initial velocity conditions, in the beginning product is low so k-1 » k2
k2 is a rate limiting step in the mechanism
The overall rate of the rate of the reaction is determined by how fast ES forms P
Steady State Conditions
Rates of formation and breakdown of [ES] are equal, concentration vs time
Pre-steady-state: ES is being formed quickly and not constant yet
Steady-state region: [ES] is constant, substrate [S] is slowly decreasing and product [P] is slowly increasing, the total enzyme [E] is constant.
[ES] is constant because rate of ES formation = rate of ES breakdown
![<p>Rates of formation and breakdown of [ES] are equal, concentration vs time</p><ol><li><p>Pre-steady-state: ES is being formed quickly and not constant yet</p></li><li><p>Steady-state region: [ES] is constant, substrate [S] is slowly decreasing and product [P] is slowly increasing, the total enzyme [E] is constant.</p></li><li><p>[ES] is constant because rate of ES formation = rate of ES breakdown</p></li></ol><p></p>](https://assets.knowt.com/user-attachments/39b97737-70e9-4474-8735-87d610734c79.png)
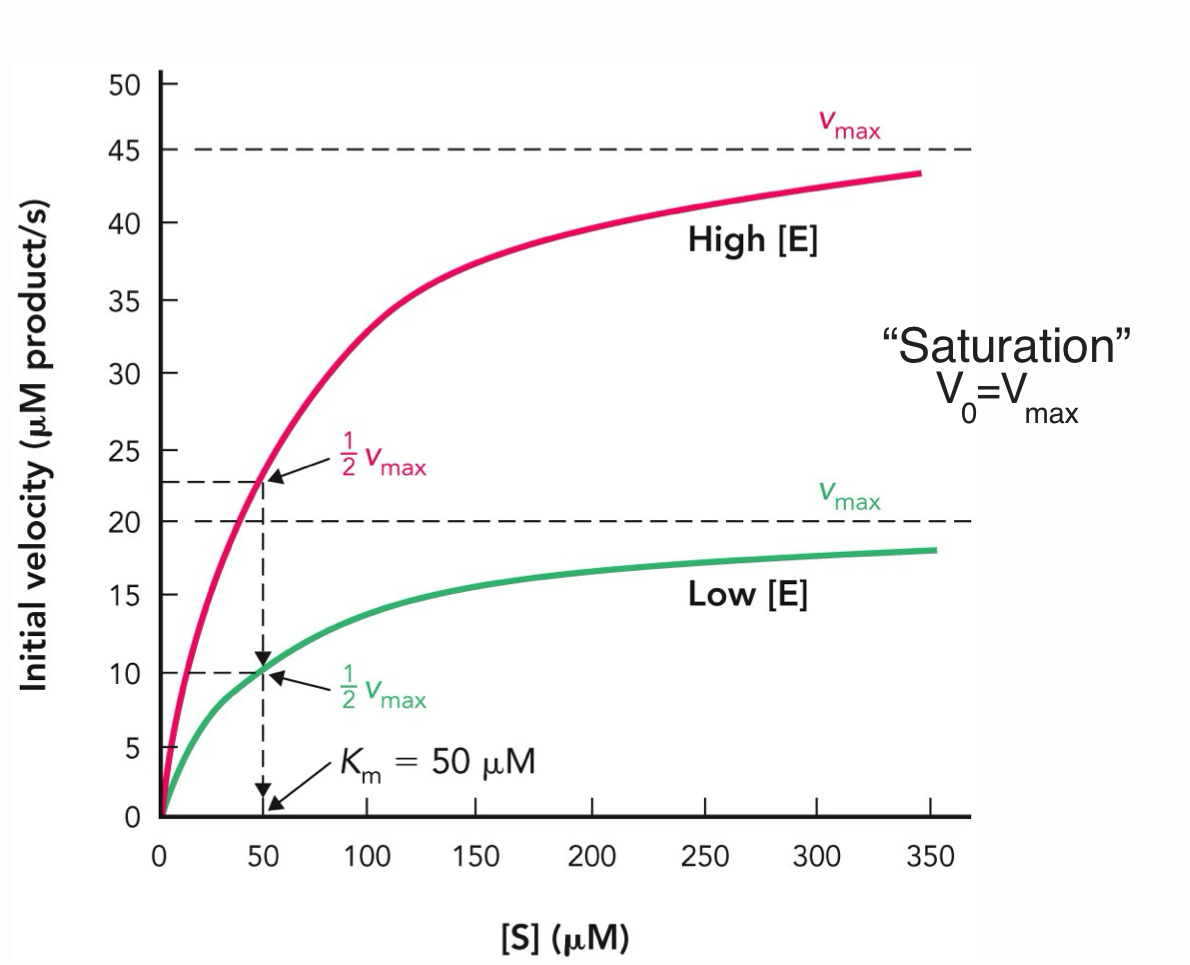
Michaelis-Menten enzyme
Vmax and ½ Vmax depends on enzyme concentrations
Km does NOT depend on enzyme concentration when it is limiting step for the reaction
At saturation, V0 = Vmax because all enzyme active sites are occupied and the reaction rate is at its maximum
Michaelis Constant (Km)
Unique to each enzyme-substrate pair
Independent of [enzyme]
Describes the properties of the E-S interaction
Based on rate constants:
It tells you how tightly the enzyme binds substrate
![<ul><li><p>Unique to each enzyme-substrate pair</p></li><li><p>Independent of [enzyme]</p></li><li><p>Describes the properties of the E-S interaction</p></li><li><p>Based on rate constants:</p></li></ul><p>It tells you how tightly the enzyme binds substrate</p>](https://assets.knowt.com/user-attachments/516c8949-80e5-40f5-a2d2-52b89ba277fa.png)
Enzyme affinity
The MM equations assume: k2 is « than k1 and k-1
The dissociation rate is greater than the rate of product formation, so ES is more likely to fall apart than make product
Km becomes ESdissociation constant, Km = Kd
Higher affinity = Small Km, tighter association
Lower affinity = Larger Km, looser association
Km tells you how much substrate you need for effective enzyme activity meaning low km → enzyme works well even at low [S], and high Km → needs high [S] to work efficiently
![<p>The MM equations assume: k<sub>2</sub> is « than k<sub>1</sub> and k<sub>-1</sub></p><p>The dissociation rate is greater than the rate of product formation, so ES is more likely to fall apart than make product</p><p>K<sub>m</sub> becomes ESdissociation constant, K<sub>m </sub>= K<sub>d</sub></p><p>Higher affinity = Small Km, tighter association</p><p>Lower affinity = Larger Km, looser association</p><p>Km tells you how much substrate you need for effective enzyme activity meaning low km → enzyme works well even at low [S], and high Km → needs high [S] to work efficiently</p>](https://assets.knowt.com/user-attachments/16aab0c7-b4ca-4fbe-ac82-464722a38ba8.png)
Vmax
Vmax is proportion to the concentration of enzyme, the more [E] the higher the Vmax
Vmax represents maximum reaction rate when enzyme is saturated
Km is the [S] required to reach ½ Vmax and is independent of enzyme concentration
Turnover number (Kcat)
Number of substrate molecules that an enzyme can convert into product per unit time (units of s-1), measured when enzyme is fully saturated and if the concentration of enzyme is knows
K2 = Kcat = vmax/[E]T,
ES → E + P
Vmax depends on how much enzyme you have, kcat REMOVES that effect, so… it tells you how fast ONE enzyme works
![<p>Number of substrate molecules that an enzyme can convert into product per unit time (units of s<sup>-1</sup>), measured when enzyme is fully saturated and if the concentration of enzyme is knows</p><p>K<sub>2 </sub> = Kcat = vmax/[E]T, </p><p>ES → E + P </p><p>Vmax depends on how much enzyme you have, kcat REMOVES that effect, so… it tells you how fast ONE enzyme works</p>](https://assets.knowt.com/user-attachments/86650826-e30e-4554-8aea-35604b9adc2d.png)
Catalytic efficiency
Combines:
kcat → speed of catalysis
km → binding affinity
It tells how well enzyme binds the substrate AND how fast it converts substrate into product
When [S] « Km → NOT saturated, low substrate, Michaelis-Menten simplifies to:
![<p>Combines:</p><p>kcat → speed of catalysis </p><p>km → binding affinity</p><p>It tells how well enzyme binds the substrate AND how fast it converts substrate into product</p><p>When [S] « Km → NOT saturated, low substrate, Michaelis-Menten simplifies to:</p>](https://assets.knowt.com/user-attachments/164502b3-360d-44cb-8597-52659f200a74.png)
Lineweaver-Burk plot
The original Michaelis-menten graph is hyperbolic so its hard to exactly see Vmax and find Km, so we linearize it to make it a straight line.
You take the reciprocal of the v0 equation
This plot is known as a Lineweaver-Burk double reciprocal plot
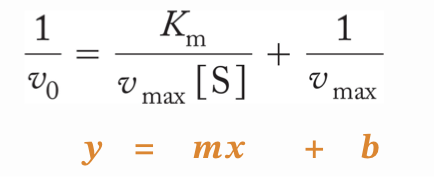
Lineweaver-Burk plot graph
A plot of:
y-axis: 1/ v0
x-axis: 1/ [S]
Slope: Km/vmax
Y intercept: 1/ vmax
X intercept: -1/Km
Increasing the enzyme concentration increases Vmax so 1/Vmax is smaller
Enzyme concentration does not change Km
These will cause the Y-intercept to go down and the slope to get smaller (flatter)
![<p>A plot of:</p><p>y-axis: 1/ v<sub>0</sub></p><p>x-axis: 1/ [S]</p><p>Slope: K<sub>m</sub>/v<sub>max</sub></p><p>Y intercept: 1/ v<sub>max</sub></p><p>X intercept: -1/Km</p><p>Increasing the enzyme concentration increases Vmax so 1/Vmax is smaller</p><p>Enzyme concentration does not change Km</p><p>These will cause the Y-intercept to go down and the slope to get smaller (flatter)</p>](https://assets.knowt.com/user-attachments/2d321cb2-bda9-43f8-a204-9d877fafe1df.png)
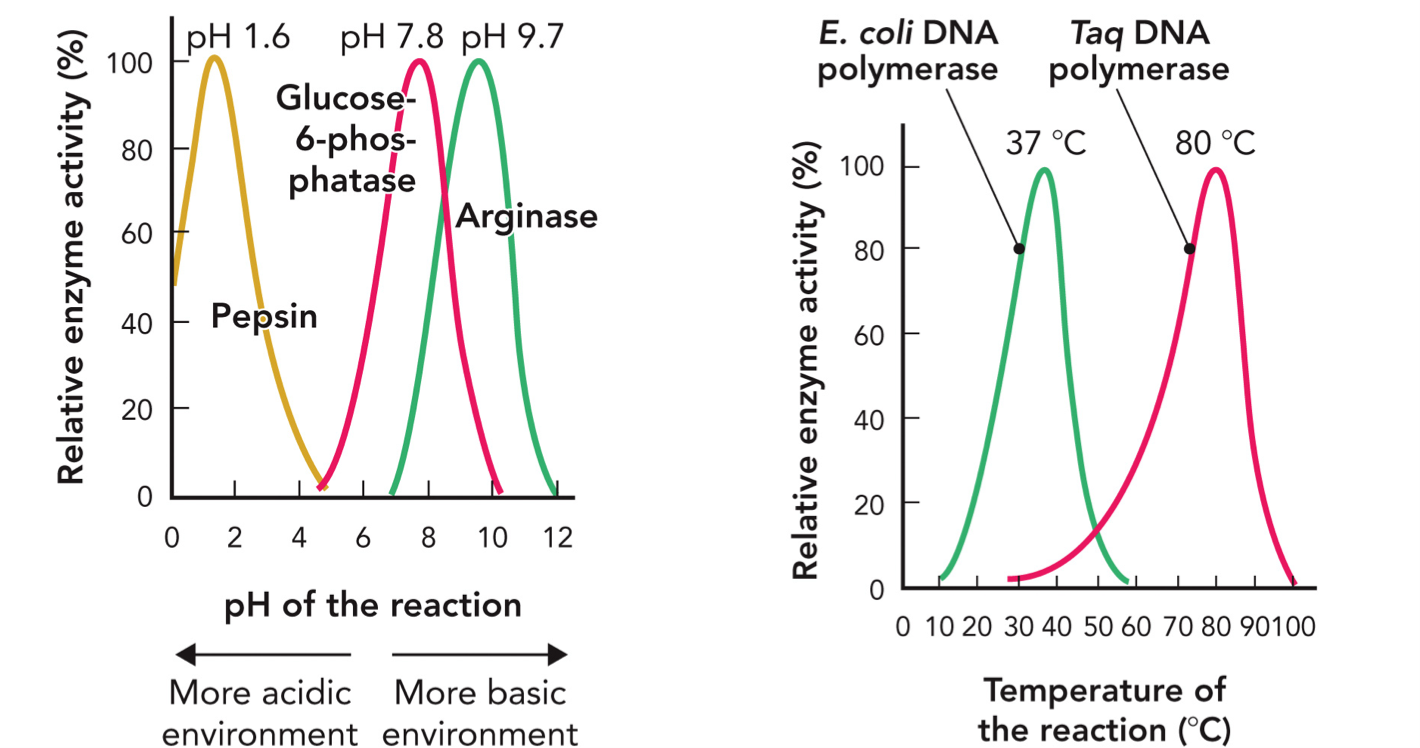
pH and Temperature Effects on Enzyme Activity
Every enzyme has an optimal pH where it works best. Reflects the chemical environment of the active site and is consistent with the physiologic role of enzyme
Pepsin → pH 1.5-2 (acidic)
Glucose-6-phosphatase → 7-8
Arginase → 9-10 (basic)
Ph changes charge of amino acids, shape of active site, ability to bind substrate
E. coli DNA polymerase, optimal 37 degree celsius
Taq polymerase, optimal 80 degree celcius
As temp increase, rate increases, but too high and enzyme denatures
Experimental design measuring enzyme kinetics
Isolate the enzyme in an active form
Design an assay of progress of the reaction (color reaction)
Conduct a time test for product formation over time to obtain the initial velocity = v0
Repeat with a range of different substrate concentrations [S]
Plot v0 against [S]
Vmax = plateau, the highest rate
Km = substrate concentration where velocity is half of Vmax
Regulation of Enzyme Activity
Could be stimulatory or inhibitory
Mediated by two mechanisms:
Bioavailability (the amount of enzyme in different tissues and cellular components)
Control of catalytic efficiency through protein modification
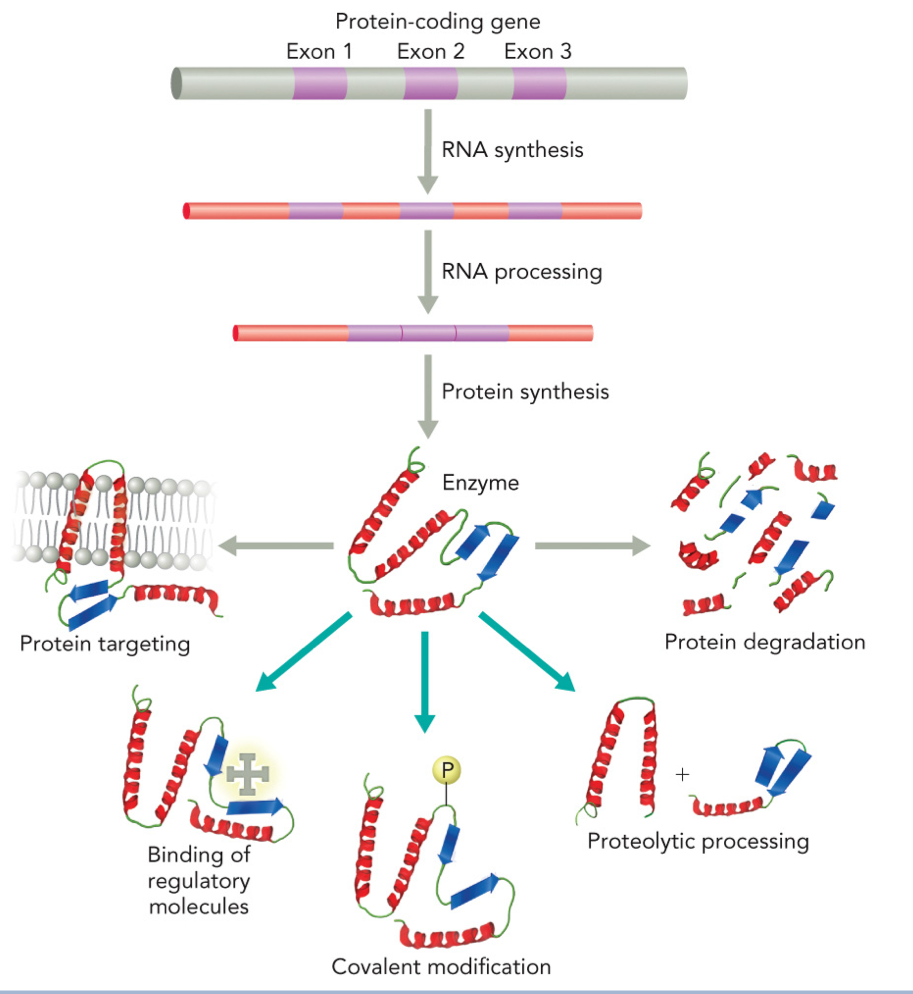
Bioavailability and catalytic efficiency
Quality of enzyme
Making the enzyme/how much/localization (bioavailability)
Protein-coding gene (exons 1, 2, 3)
RNA synthesis (transcription)
RNA processing
Protein synthesis (translation)
Enzyme formed
Protein targeting
Protein degradation
Controlling the enzyme activity/ protein modifications (catalytic efficiency)
Binding of regulatory molecules
Covalent modification
Proteolytic processing
Enzyme inhibition
Reversible:
noncovalent bonding of small biomolecules or proteins to the enzyme subunit
Can be decreased by diluting the enzyme reaction, three classes: competitive, uncompetitive, mixed
Irreversible:
Inhibitory molecules form a covalent bond or very strong non covalent bond with catalytic groups in the enzyme active site
Kill the enzyme by tight binding
Not affected by enzyme dilution
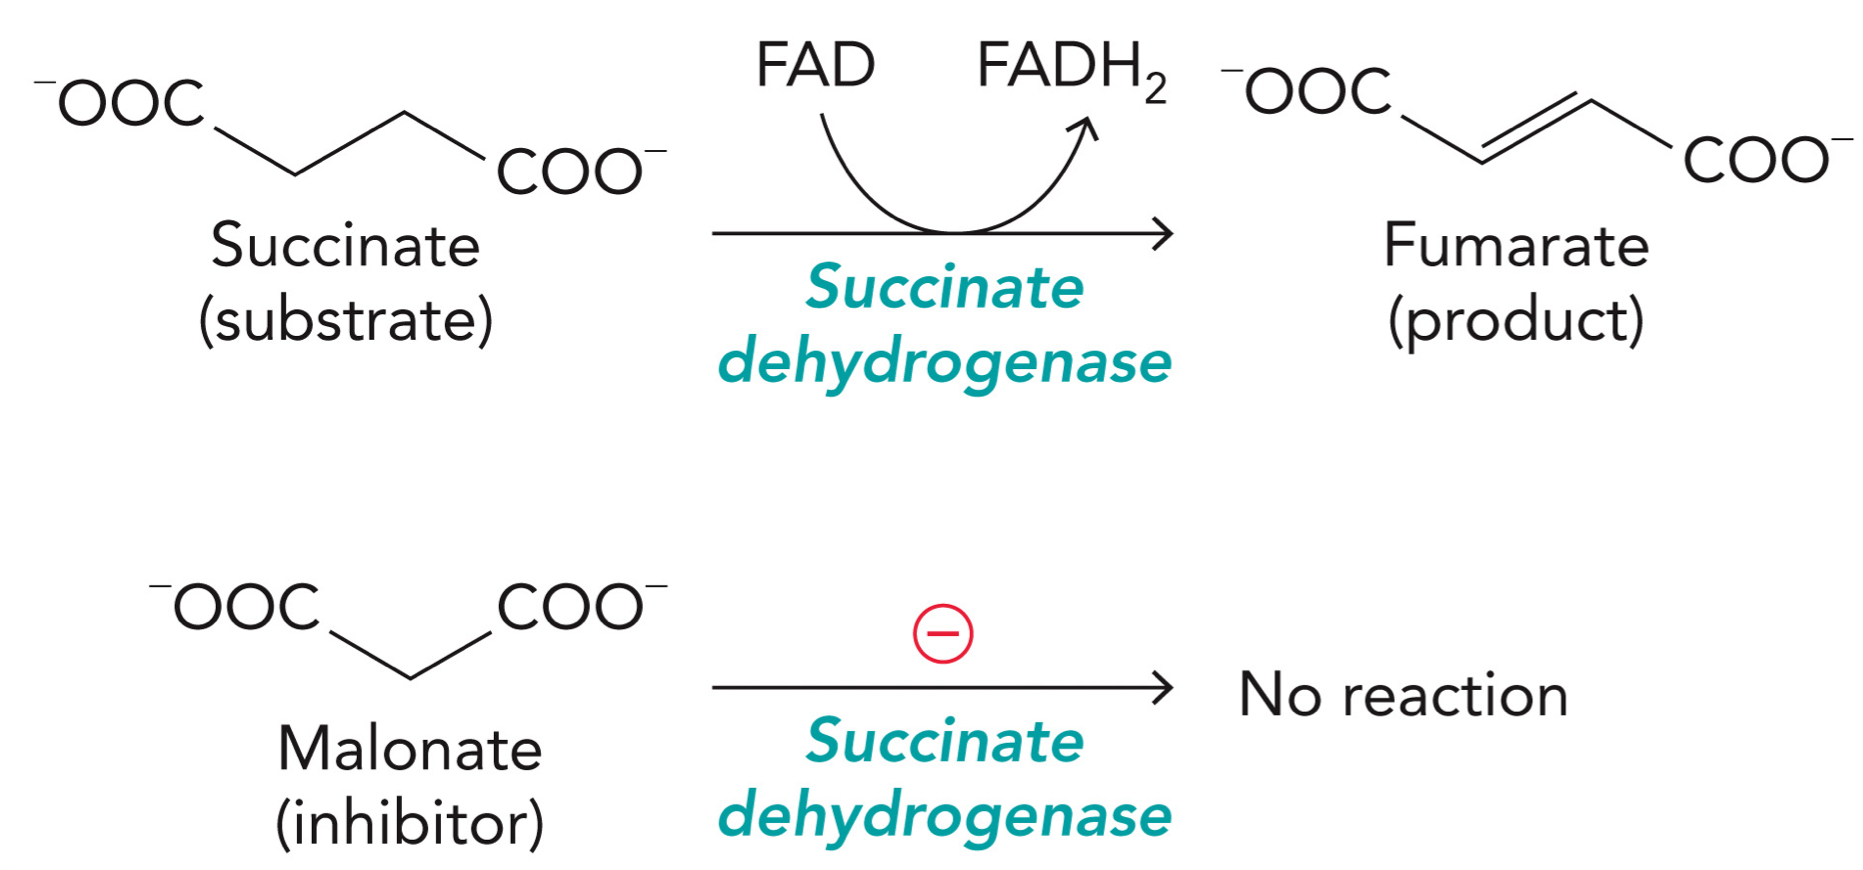
Malonate
A reversible inhibitor of succinate dehydrogenase
Normal reaction:
Substrate: succinate
Enzyme: succinate dehydrogenase
Cofactor: FAD becomes → FADH2
Reaction: Succinate → fumarate
2 hydrogens are removed, forms a double bond
Malonate: looks similar to succinate
Malonate sits in the active site but cannot be converted to product, it blocks succinate from entering. Malonate has one methylene group instead of two, so the oxidation reaction can’t proceed and enzyme is inhibited.
Reversible Inhibitor Summary
Competitive inhibition: Inhibitor binds only to enzyme (E), binds at active site, competes with substrate, doesn’t bind with it
Uncompetitive inhibition: Inhibitor binds only to ES complex, cannot bind free energy, binds after substrate is already bound, do not bind to active site
Mixed inhibition: Inhibitor binds E and ES, can bind with or without substrate, do not bind to active site
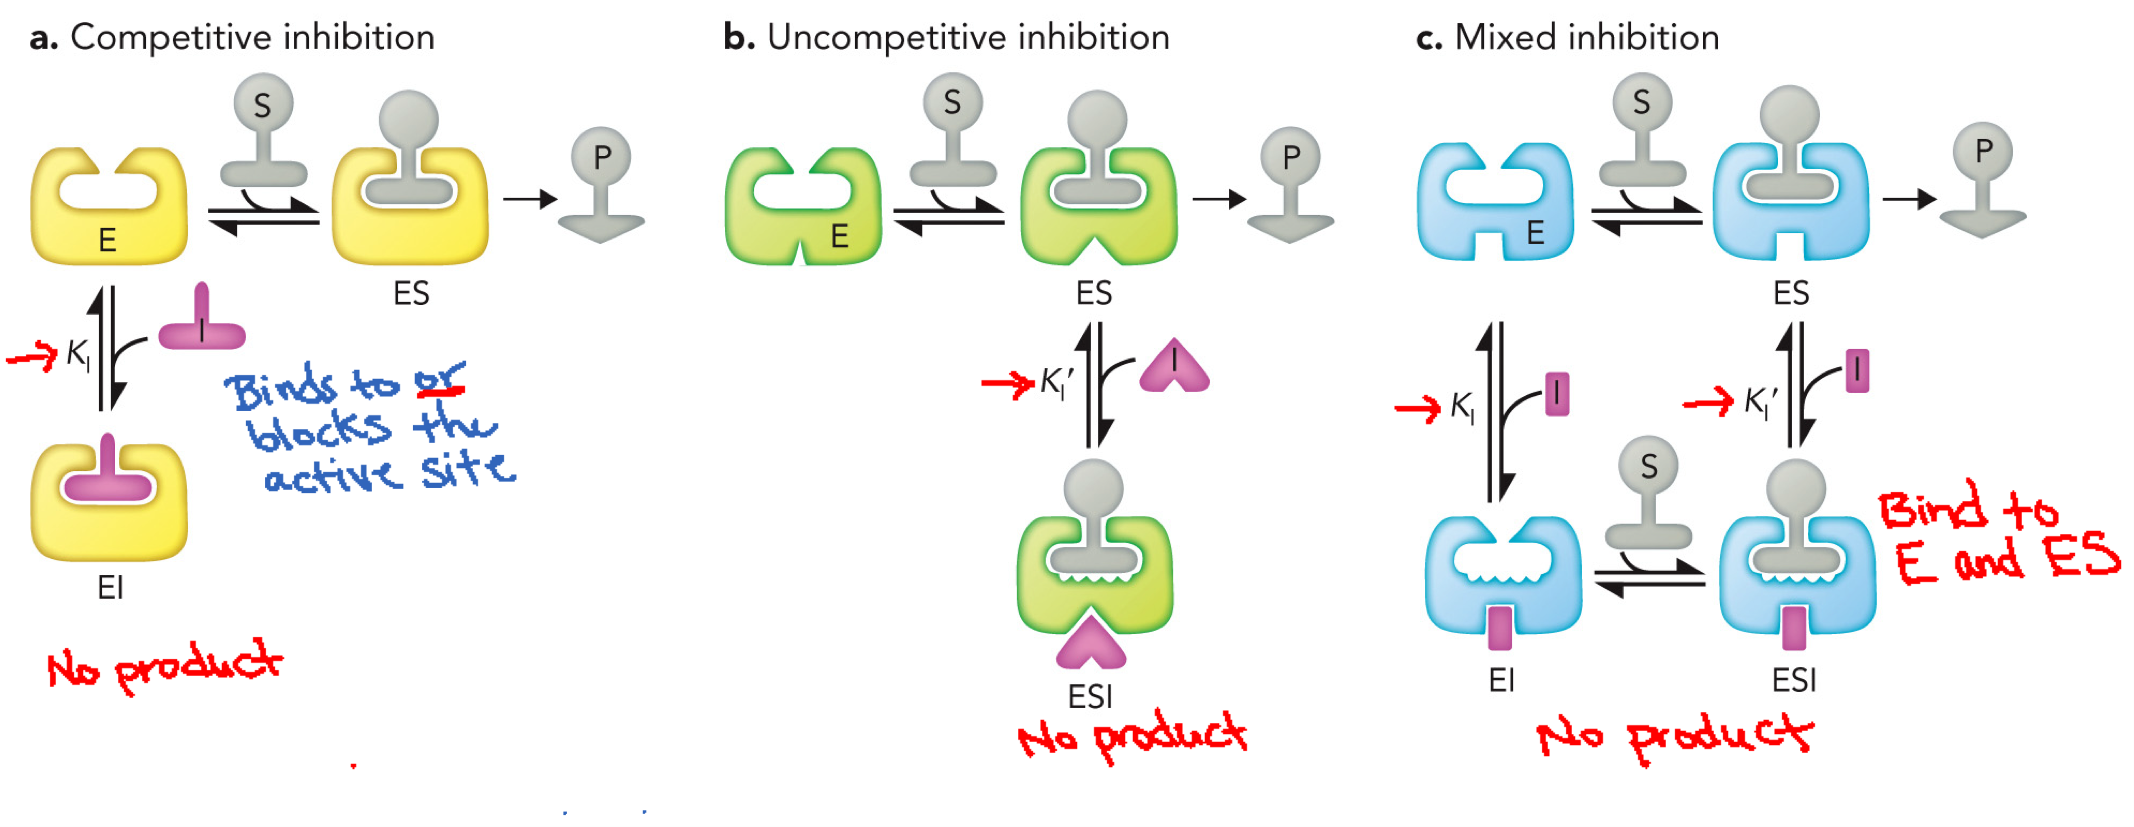
Competitive inhibition
Inhibits substrate binding at active site
Can bind to the active site or obstruct the substrate from binding through steric clash
Can be overcome by increasing [S], which outcompetes I for binding
Vmax is unchanged, but Km values change
Inhibitor constant KI = [E][I]/[EI], equivalent to Kd
Michaelis-menten equation
![<p>Inhibits substrate binding at active site</p><p>Can bind to the active site or obstruct the substrate from binding through steric clash</p><p>Can be overcome by increasing [S], which outcompetes I for binding</p><p>Vmax is unchanged, but Km values change</p><p>Inhibitor constant K<sub>I</sub> = [E][I]/[EI], equivalent to Kd</p><p>Michaelis-menten equation</p>](https://assets.knowt.com/user-attachments/4405f0b0-6b5d-4488-a9a5-8235d694f09f.png)
Competitive Inhibition graph
Michaelis-Menten graph, as inhibitor concentration increases:
Curve shifts to the right
Reaches the same Vmax
Km increases (more [S] needed to reach ½ Vmax
Lineweaver-Burk graph
Same y-intercept (Vmax unchanged)
Slope increases, Km ↑ → slope↑
Km ↑ → value gets closer to zero (x-intercept shifts right)
![<p>Michaelis-Menten graph, as inhibitor concentration increases:</p><ul><li><p>Curve shifts to the right</p></li><li><p>Reaches the same Vmax</p></li><li><p>Km increases (more [S] needed to reach ½ Vmax</p></li></ul><p>Lineweaver-Burk graph</p><ul><li><p>Same y-intercept (Vmax unchanged)</p></li><li><p>Slope increases, Km ↑ → slope↑ </p></li><li><p>Km ↑ → value gets closer to zero (x-intercept shifts right)</p></li></ul><p></p>](https://assets.knowt.com/user-attachments/7631dcd5-720a-4bf3-8a98-754f65a1d834.png)
Uncompetitive Inhibition
Binds to enzyme-substrate complex and alters the active site conformation. Often acts upon enzymes with multiple substrates, both km and Vmax are decreased.
KI’ = [ES] [I]/ [ESI] KI’= constant for inhibitor prime
![<p>Binds to enzyme-substrate complex and alters the active site conformation. Often acts upon enzymes with multiple substrates, both k<sub>m</sub> and Vmax are decreased.</p><p>KI’ = [ES] [I]/ [ESI] KI’= constant for inhibitor prime</p>](https://assets.knowt.com/user-attachments/10fa50a1-ecd3-4a67-9450-7443b596b831.png)
Uncompetitive Inhibition graph
Lines are parallel because slope = Km/Vmax, if both ↓ equally → slope stays the SAME.
Line shifts up: (Vmax ↓ → 1/Vmax ↑) y-intercept
Line shifts left: Km ↓ → -1/Km moves left (x-intercept)
↑ [S] = no effect on inhibition, no overcoming
![<p>Lines are parallel because slope = Km/Vmax, if both ↓ equally → slope stays the SAME.</p><p>Line shifts up: (Vmax ↓ → 1/Vmax ↑) y-intercept</p><p>Line shifts left: Km ↓ → -1/Km moves left (x-intercept)</p><p>↑ [S] = no effect on inhibition, no overcoming</p>](https://assets.knowt.com/user-attachments/d1074f44-89a0-4f80-8866-62021fde61ba.png)
Mixed Inhibition
Inhibitor binds to unique sites outside the active site (allosteric site)
Can bind:
E (free enzyme) → uses Kᵢ
ES (enzyme-substrate → uses Kᵢ'
Vmax always decreases
Km can increase or decrease
Kᵢ → affinity of inhibitor for E
Kᵢ′ → affinity of inhibitor for ES
Substrate cannot overcome inhibitor because it can still bind E or ES, so the enzyme is always getting blocked and Vmax goes down.
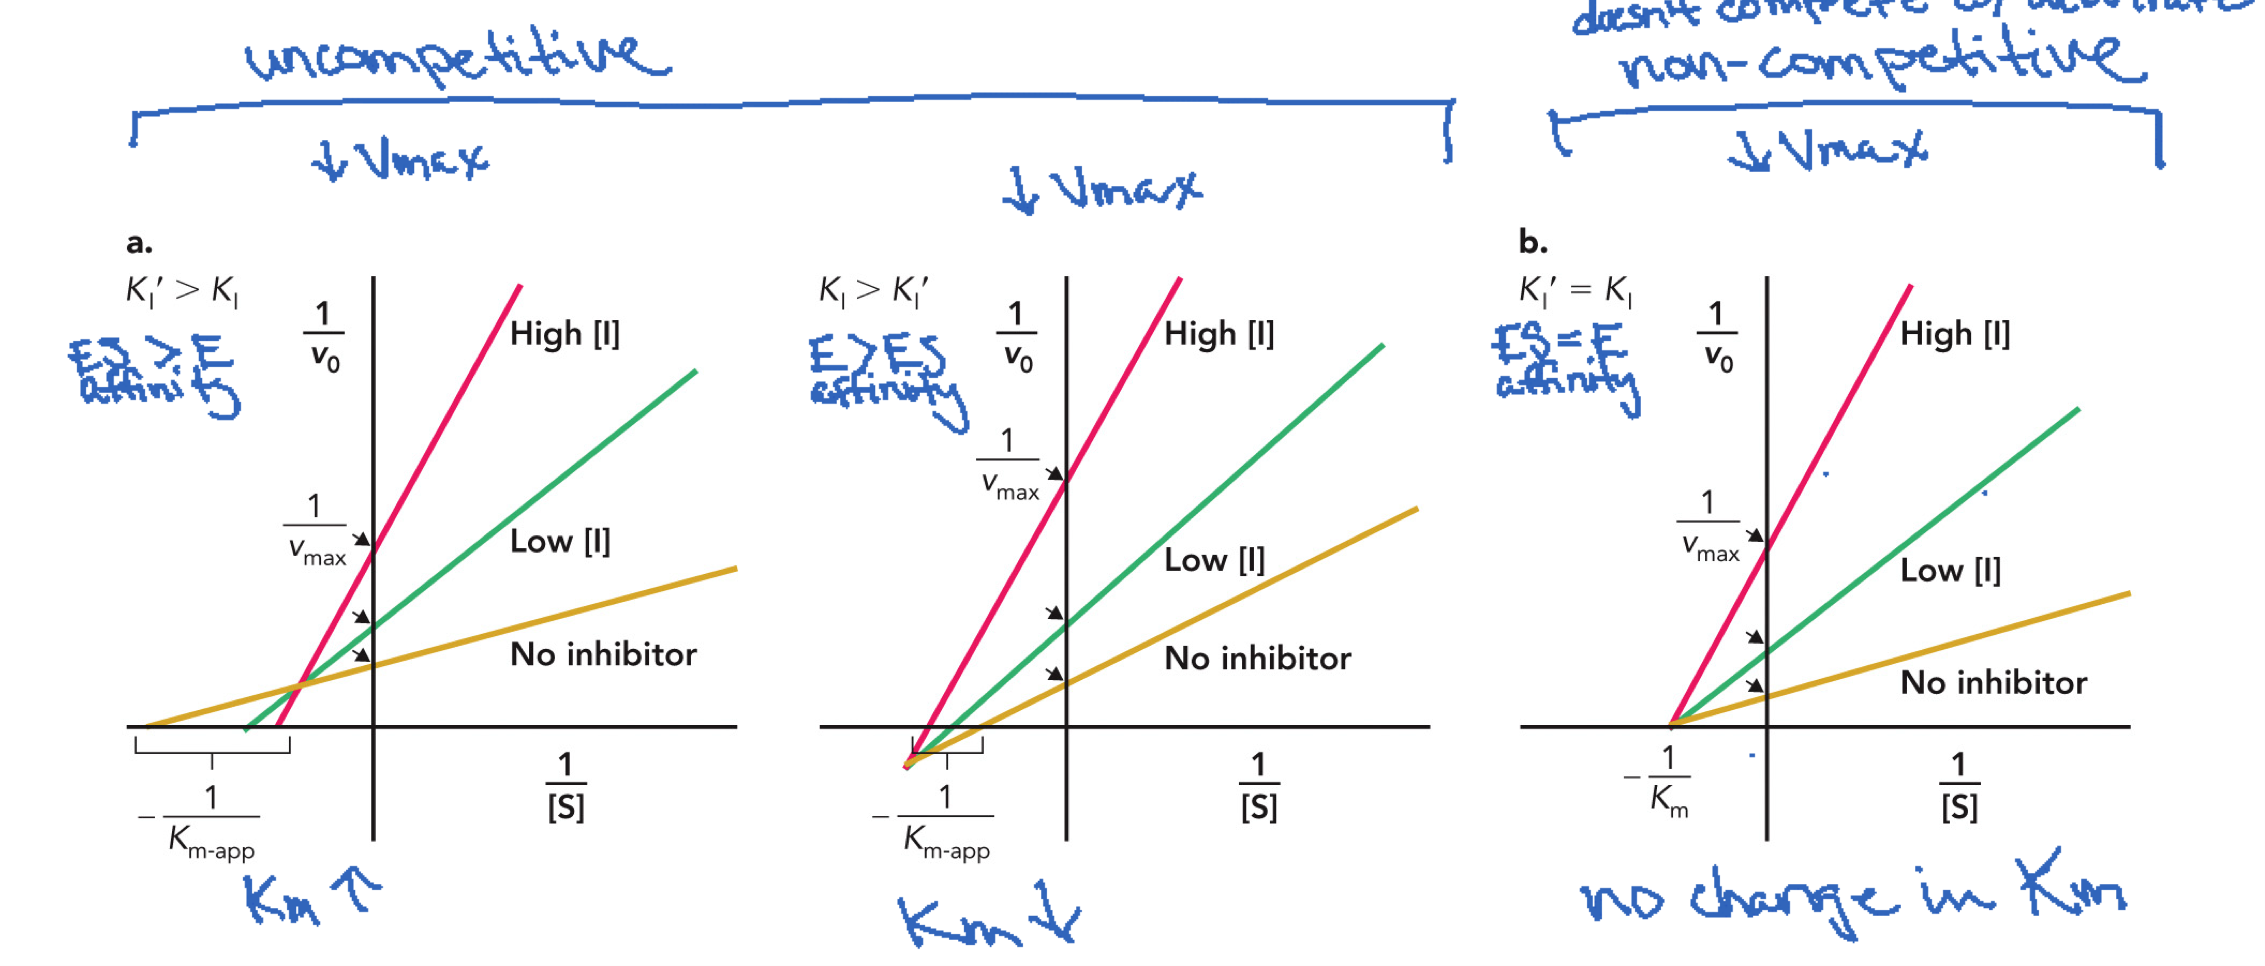
Mixed inhibition graphs
LEFT: Ki’ > Ki inhibitor prefers E over ES because smaller k = stronger binding, Km ↑Vmax ↓ (looks like competitive inhibition),
MIDDLE: Ki > Ki’, inhibitor prefers ES complex, Km ↓ Vmax ↓, (look like uncompetitive),
RIGHT: Ki = Ki’, equal binding to E and ES. Km unchanged and Vmax ↓, pure noncompetitive inhibition
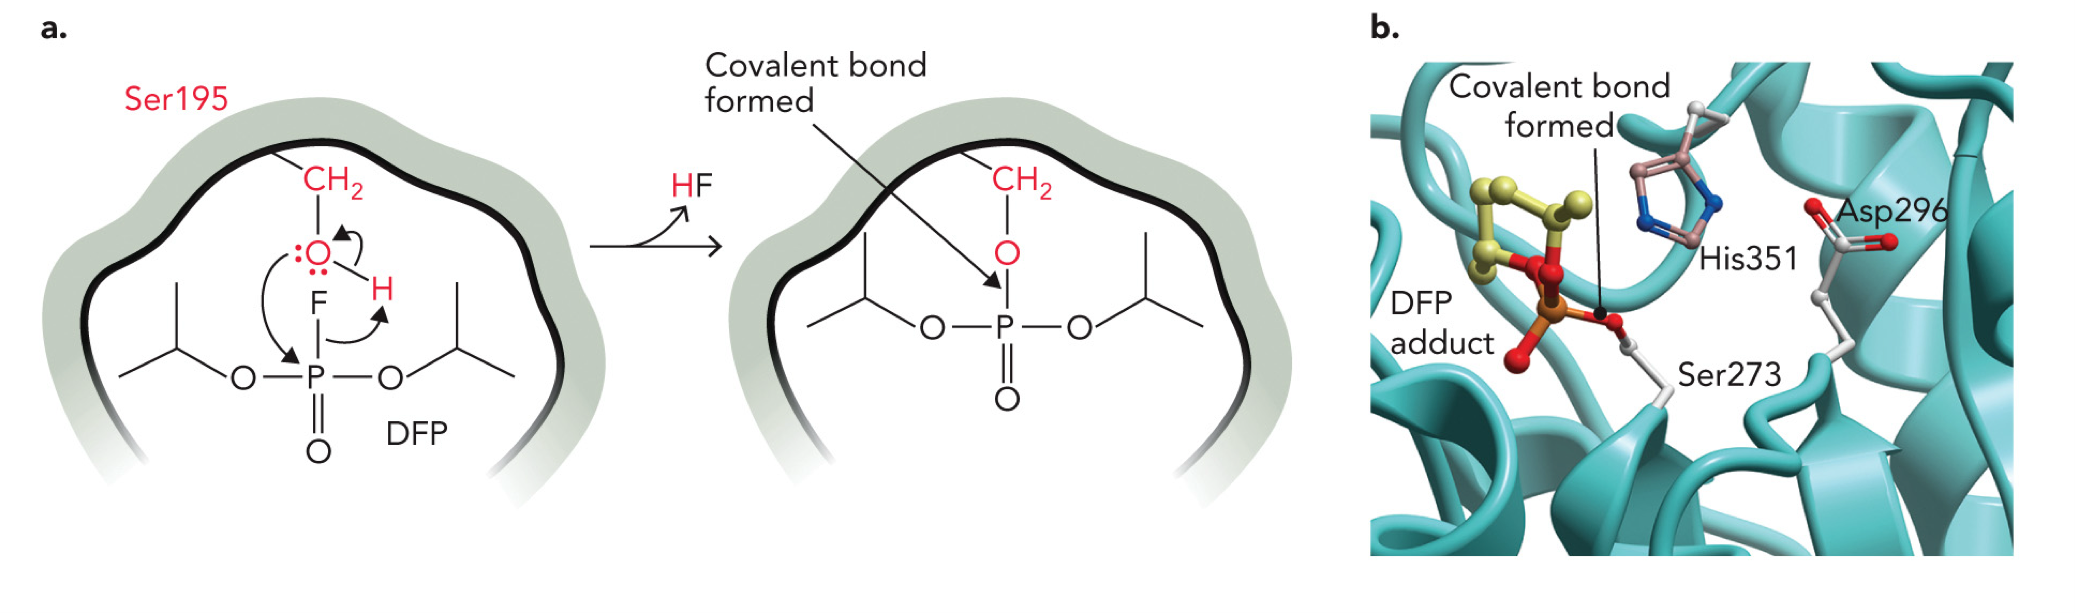
Diisopropylfluorophosphate
An irreversible enzyme inhibitor, blocks protease and phospholipase enzymes, forms a covalent bond with specific reactive serine residues
Serine -OH (Ser195) acts as a nucleophile
Oxygen from serine attacks the phosphorus (P) of DFP
Leaving group: H F
This forms a covalent bond: Ser-O-P
Molecular structure of the human phospholipase A2 enzyme, showing the location of a diisopropylfluorophosphate adduct formed with Ser273 in the active site. The other two residues contributing to the catalytic triad in this enzyme active site are His351 and Asp296
Suicide Inhibitors
Mechanism-based inhibitors
React with an enzyme during normal course of catalysis but fails to complete the reaction and remain irreversibly bound to the enzyme
Often form a covalent bond with the enzyme that results in irreversible inactivation
Highly specific, only enzymes that process that substrate get inhibited
Requires enzyme activity to work
Allosteric Regulation of Catalytic Activity
The first step of a metabolic pathway is often controlled by regulated enzyme to maximize to use of metabolic intermediates
Feedback inhibition:
The end product of a pathway functions as an inhibitor of the first enzyme in the pathway
EX: ATCase aspartate transcarbamolyase
ATCase Activity
STEP 1: Carbamoyl phosphate + L-aspartate. Enzyme ATCase transfers a carbamoyl group into N-carbamoyl-L-aspartate + Pi (rate limiting step)
STEP 2: N-carbamoyl-L-aspartate → CTP (final product)
CTP feeds back and inhibits ATCase
If CTP ↑ → ATCase ↓ → pathway slows
If CTP ↓ → ATCase active → pathway continues
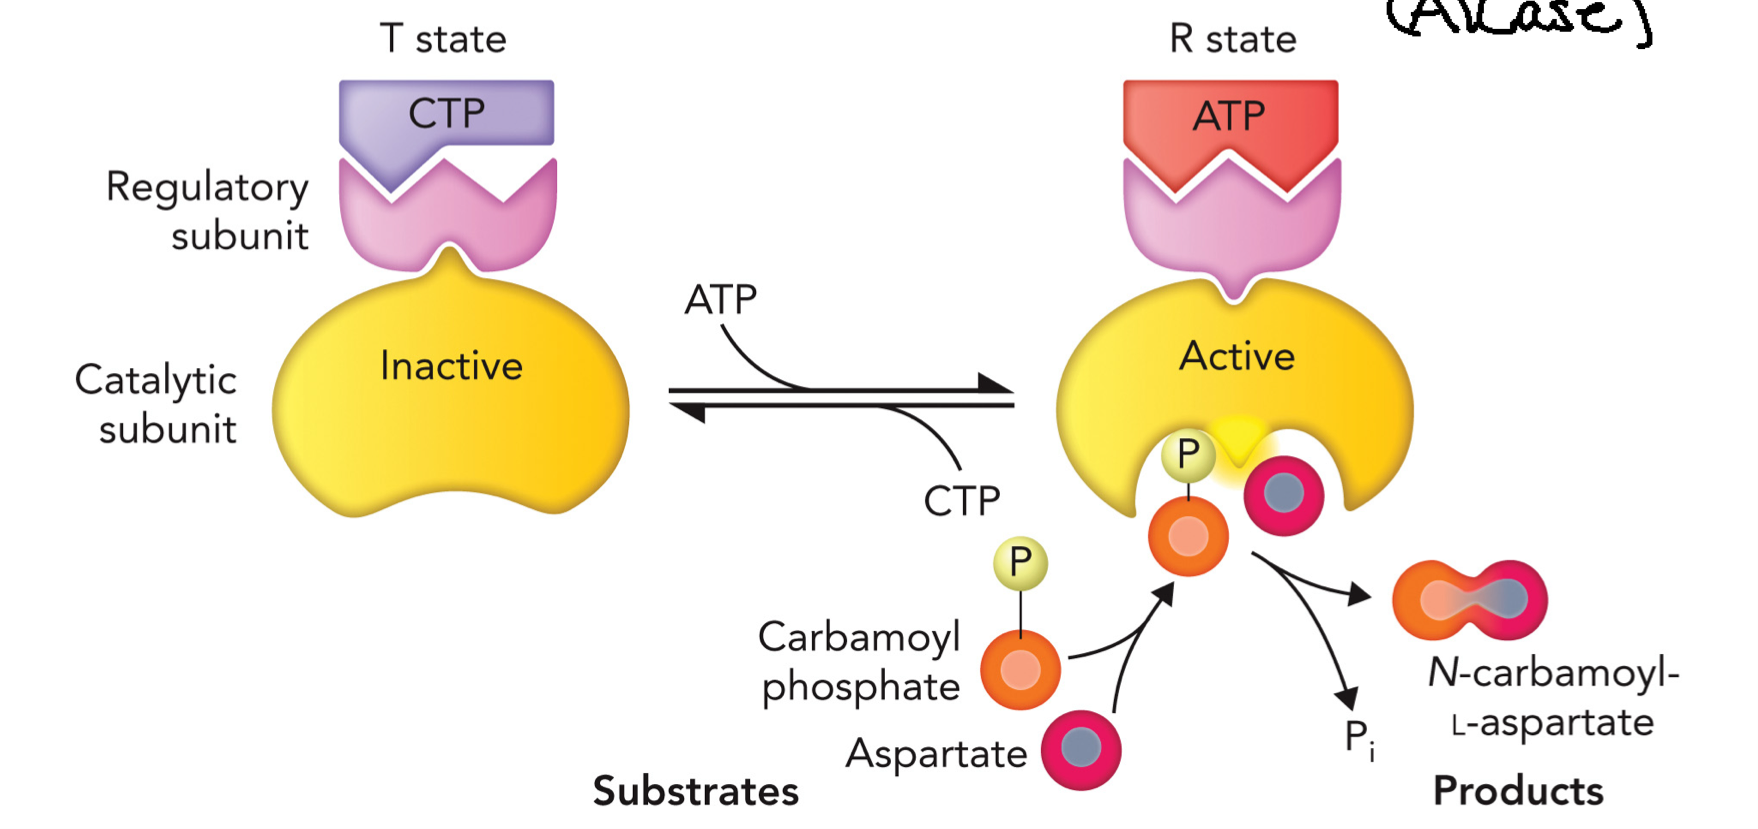
Allosteric Regulation of ATCase
T state (tense) → inactive
R state (relaxed) → active
CTP (inhibitor)
binds regulatory subunit
stabilizes T state
enzyme becomes inactive
ATP (activator)
binds regulatory subunit
stabilizes R state
enzyme becomes active
Full cycle:
Low CTP/ high ATP: enzyme shifts → R state (active) reaction proceeds
Reaction: carbamoyl phosphate + aspartate → N-carbamoyl aspartate+Pi
High CTP binds enzyme → T state (inactive) reactions slows/stops
ATCase graph
ATCase is a cooperative enzyme = binding at one site affects other sites (positive cooperativity increases affinity at others), sigmoidal (S-shaped)
ATCase has multiple subunits (c6r6), binding of substrate at one site increases affinity at other sites, this is positive cooperativity.
Low [Aspartate] → enzyme mostly in T state (inactive)
Some substrate binds → shifts toward R state
More substrate binds → enzyme becomes more active faster
ATP (activator): shifts curve LEFT, increases activity, higher affinity for substrate, reaches high velocity at lower [S]
CTP (inhibitor): shifts curve RIGHT, decreases activity, lower affinity, needs more substrate to activate enzyme
![<p>ATCase is a cooperative enzyme = binding at one site affects other sites (positive cooperativity increases affinity at others), sigmoidal (S-shaped)</p><p>ATCase has multiple subunits (c<sub>6</sub>r<sub>6</sub>), binding of substrate at one site increases affinity at other sites, this is positive cooperativity.</p><ol><li><p>Low [Aspartate] → enzyme mostly in T state (inactive)</p></li><li><p>Some substrate binds → shifts toward R state</p></li><li><p>More substrate binds → enzyme becomes more active faster</p></li></ol><p>ATP (activator): shifts curve LEFT, increases activity, higher affinity for substrate, reaches high velocity at lower [S]</p><p>CTP (inhibitor): shifts curve RIGHT, decreases activity, lower affinity, needs more substrate to activate enzyme</p><p></p>](https://assets.knowt.com/user-attachments/e8eae812-01b6-4e7b-b568-bb1ba0f2e084.png)
Covalent modification
Reversible chemical changes to an enzyme that alter its activity
Functional groups: phosphoryl, methyl, acetyl, adenyl, uridyl
Most common phosphorylation of Ser, Thr, Tyr residues by kinases that add phosphate group
Phosphatases - remove phosphate group
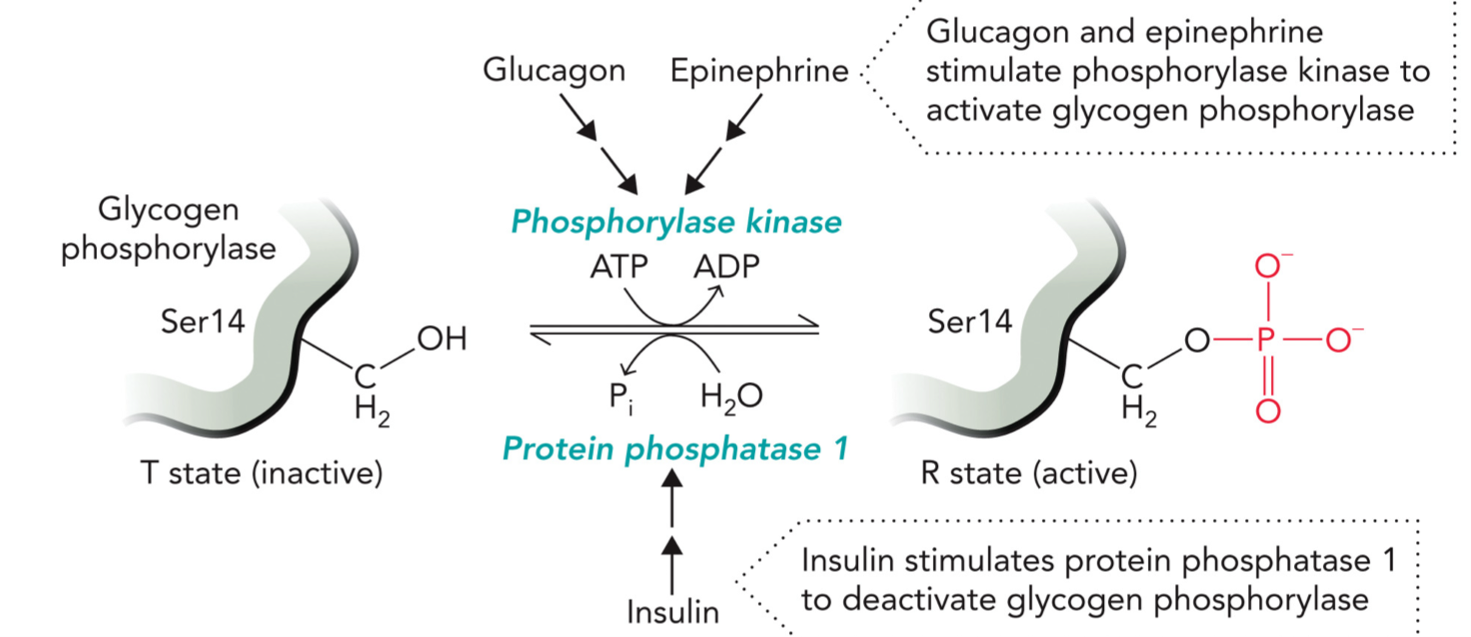
Glycogen phosphorylation
Breaks down glycogen → releases glucose (energy)
Dephosphorylated: T state, inactive
Phosphorylated (Ser14): R state, active
Activation
Hormones: Glucagon & Epinephrine stimulate phosphorylase kinase to activate glycogen phosphorylase
Phosphorylase kinase uses: ATP → ADP, adds phosphate to Ser14
Glycogen phosphorylase becomes phosphorylated, R state (active)
Deactivation:
Hormone: Insulin
Mechanism: Insulin activates protein phosphatase 1 (PP1)
PP1 removes phosphate
Phosphorylated enzyme + H2O → dephosphorylated enzyme + Pi
Enzyme goes back to T state (inactive)
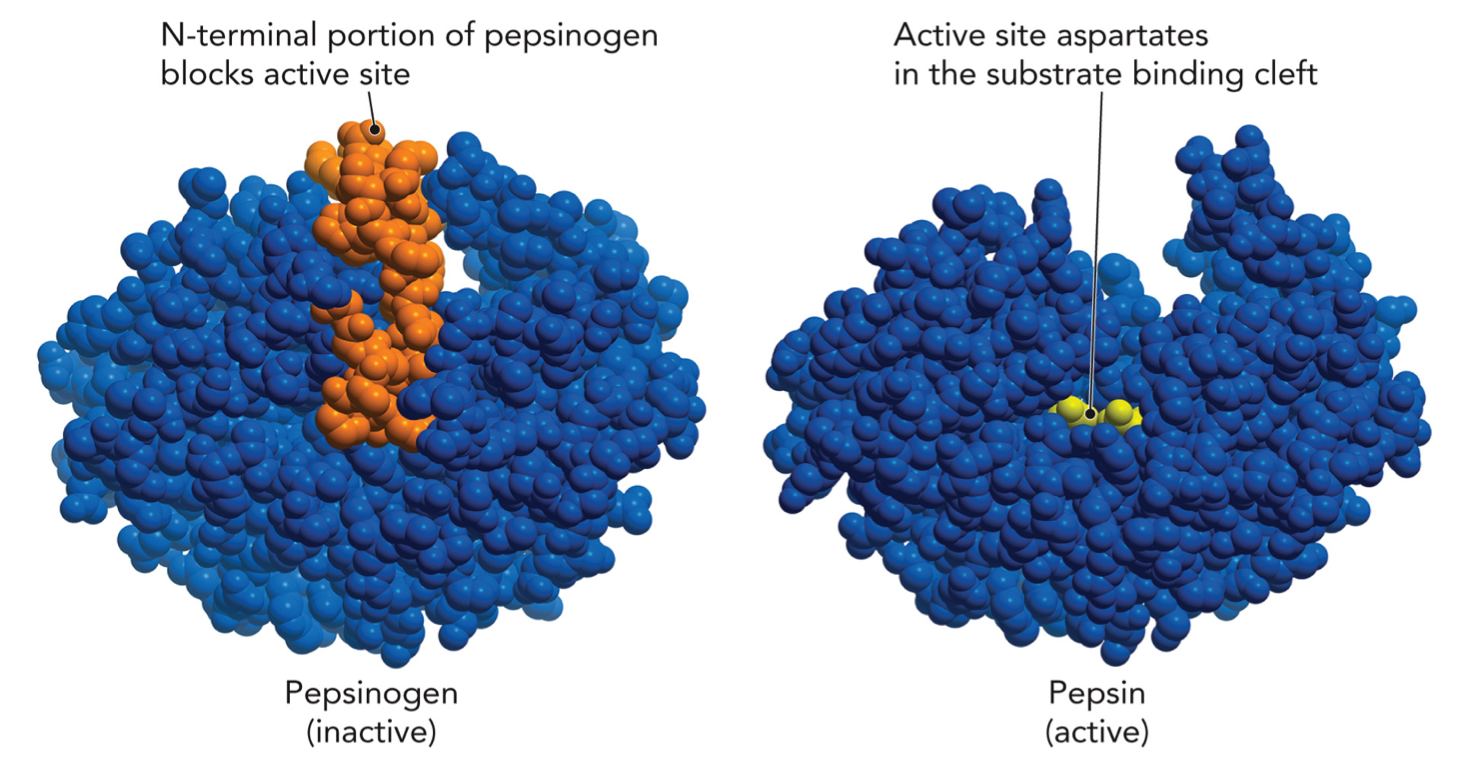
Enzyme Activation via Proteolysis
Zymogens - inactive precursor proteins become active upon cleavage
Inactive form (pepsinogen)
N-terminal segment blocks the active site
enzyme cannot bind substrate
Activation step
A piece of protein is cut off (proteolysis)
Occurs in acidic environment (stomach)
Sometimes autocatalytic (pepsin activates more pepsinogen)
Active form
blocking segment is now removed
active site is now exposed
substrate can bind → enzyme works
IRREVERSIBLE peptide bond is permanently cleaved, cannot go back to zymogens