Chapter 9 - Population Distribution and Abundance
1/75
There's no tags or description
Looks like no tags are added yet.
Name | Mastery | Learn | Test | Matching | Spaced |
|---|
No study sessions yet.
76 Terms
Population
A group of individuals of the same species that live in the same area and at the same time and that interact with one another
4 Interactions (Intraspecific) Between Individuals of the Same Species
1. Cannibalism
2. Competition
3. Cooperation (Hunting, Herding)
4. Sexual Reproduction (Mating)
Population Examples
- ALL populations can be found in populations somewhere on EARTH
- Emperor Penguins
- Forest Plants
- E. Coli
5 Components of Population Structure
1. Abundance (pop. size & density)
2. Geographical Range (distribution)
3. Spatial Pattern (dispersion)
4. Age/ Sex
5. Genetic Variation
2 Characteristics for Population Structure
1. Population Size= # Individuals in Population
2. Population Distribution= (# Individuals in population/ area or volume)
Population Density Formula
Dp= (# Individuals in pop/ area)
Dp= (# Individuals in pop/ volume)
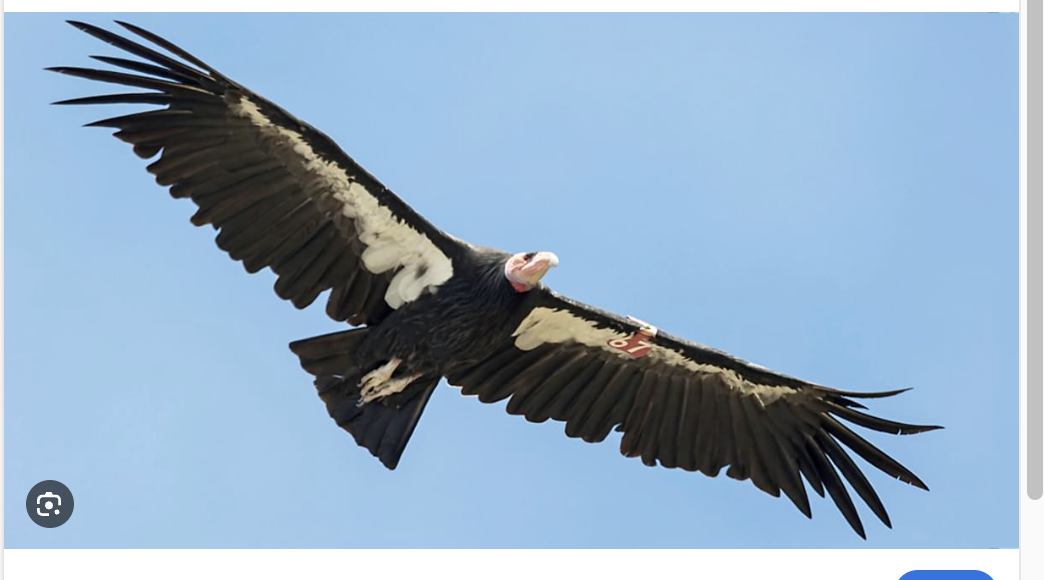
CC Small Population of California Condor, Its Causes, and Reintroduction
- Species: California Condor (Gymnogyps Californiaus)
- Causes: -Habitat Destruction
-Agricultural Chemicals (DDT)
-Poaching
- Lead Poisoning
- Reintroduction: -Captive Breeding
Asexual reproduction
- produces clones that are genetically identical to one another and to their single parent
-Clones either form separate new individuals or part of a larger colony.
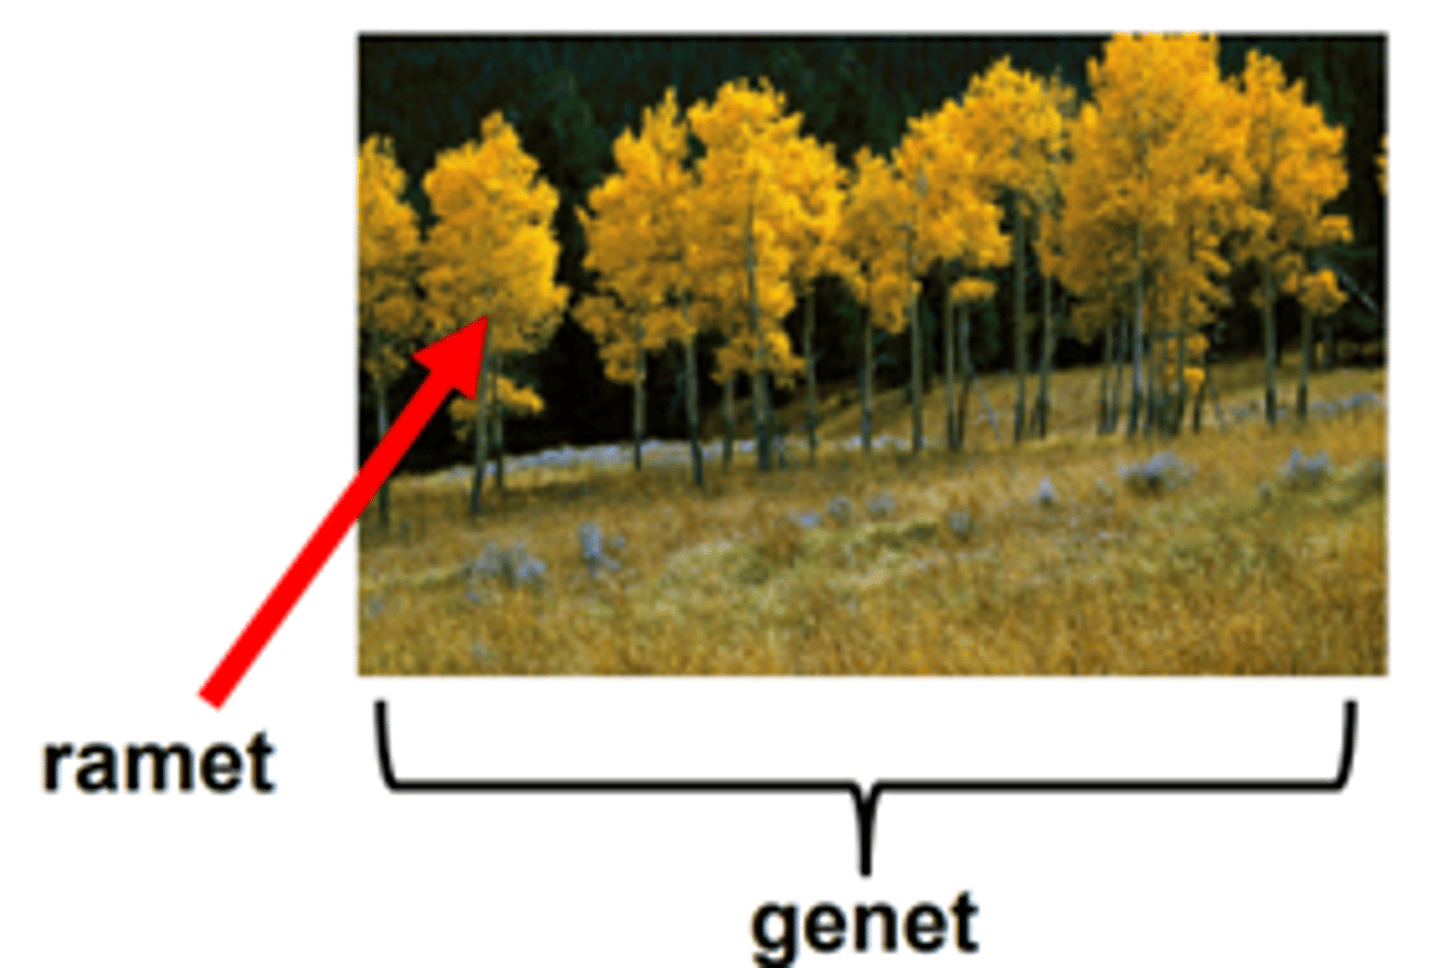
Pando Aspen Clone
- Quaking aspen (Populus tremuloides) reproduce asexually from roots and suckers (all are clones).
- 40,000 aspen trees (13 million pounds) share a collective root system across 106 acres.All are descended from a single seed at the end of the last ice age(though oldest trees are now 130 years old).
-A single tree can survive if cut off from other trees.
Ramet
- a single individual produced by clonal propagation
- e.g., one tree trunk of the Pando Aspen colony
- refers to a clone that is a physiologically independent plant
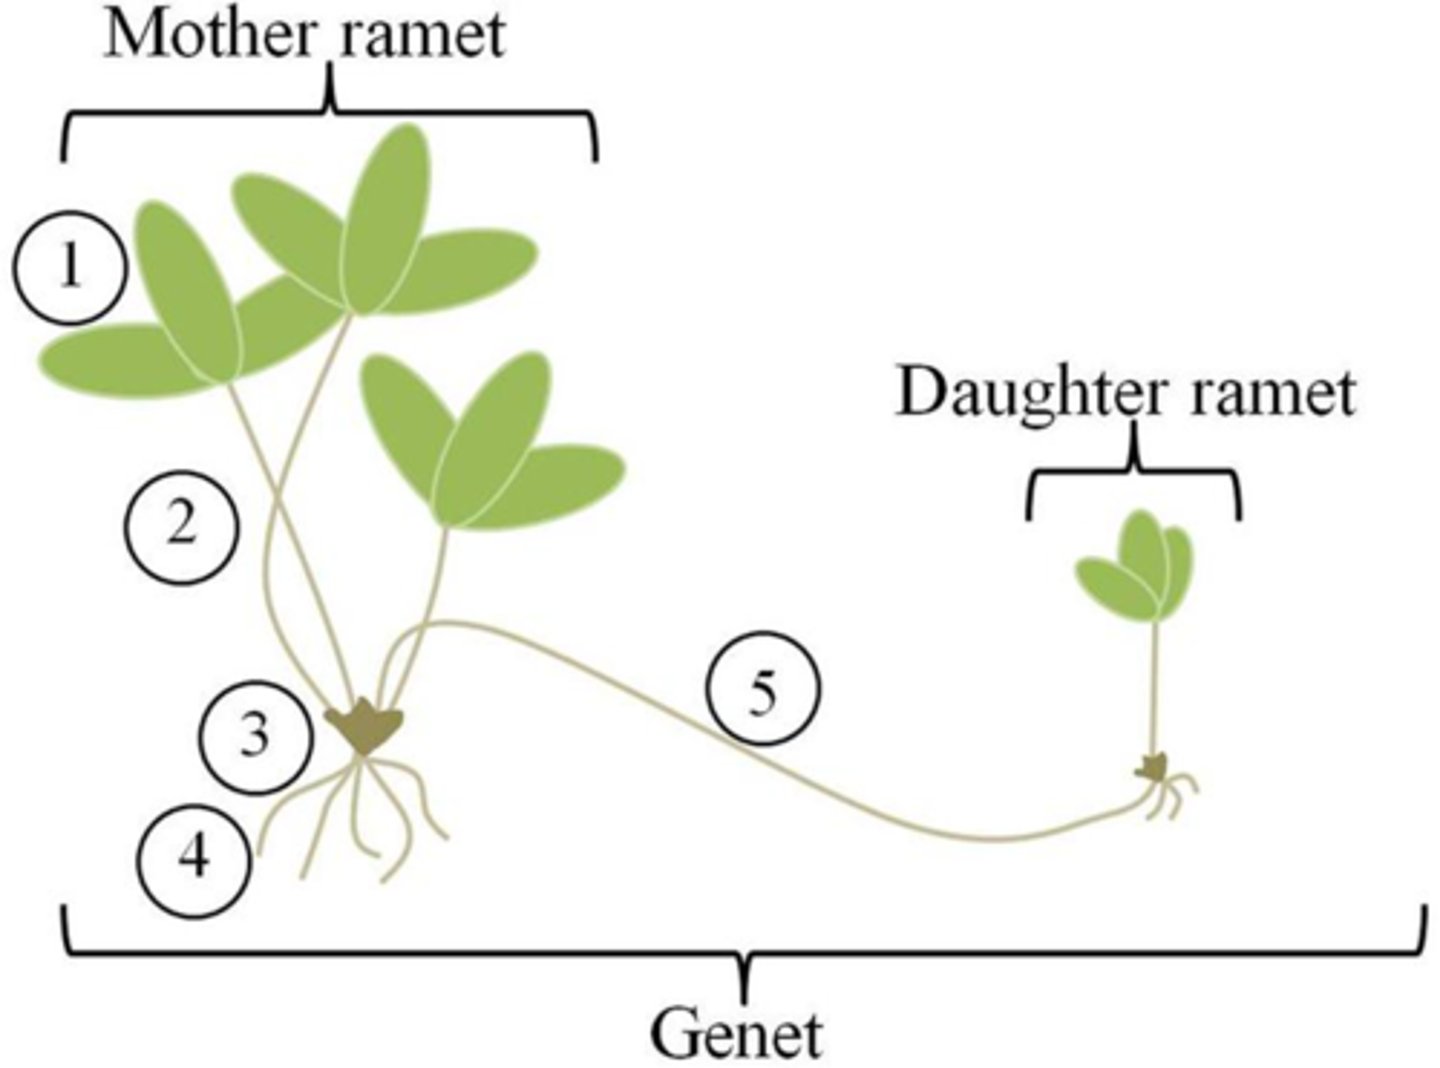
Genet
- A group of genetically identical ramets originating from a single parent seed
- e.g., all of the surviving clonal aspens descended from thesingle seed
- technical term for the single genetic individual
Siphonophore
- a colony of genetically identical individuals called zooids (all are clones)
- Zooids have various forms and functions (floating, capturing prey, feeding, and reproduction)
- Individual zooids cannot survive on their own.
- Portuguese Man O' War
Dynamic Behavior of Populations
- Populations change across both time and space because of births, deaths, and movements of individuals (change isthe norm, not the exception)
- Tracking abundance over time and space is critical data inthis effort
4 Ways to Estimate Abundance
1) Total count (count every individual)
2) Area-based count (estimate for sessile organisms)
3) Mark-recapture techniques (estimate for mobile organisms)
4) Relative population size estimates
Total Count (every individual counted)
- Useful for small populations where individuals can be easily be identified and marked/ tracked.
- Usually used for endangered species, and larger animals such as mammals and birds.
-Most expensive method
-Most time consuming method
- Most accurate method
How to Facilitate Total Count Method of estimating abundance
- Unique color patter, individual recognition marks
- Numbered tags
-PIT (Passive-Integrated Transponder) Tags
- Bands
- Telemetry (sensors)
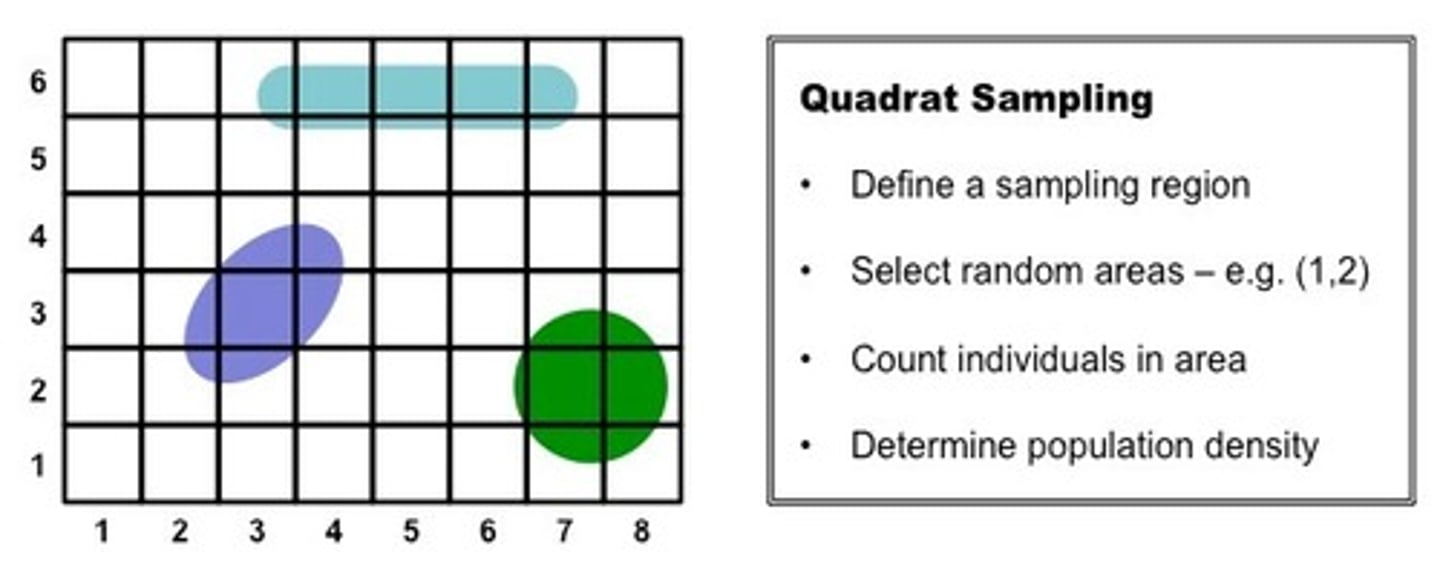
Area-based counts to estimate population abundance
- Usually used for Sessile organisms in large numbers over big areas
-Done by determining average density in randomly selected plots of equal size, then extrapolate over the area the species occupies
- Plots can be large or small, depending on organism size and range
- More number of plots used, more accurate the estimate
Example of Area-Based Pop. Abundance Count
Total # plots= 25
Sampled plots= 5
# individuals counted in sample plot= 20
Solve for Estimated Population Size
1. Find avg pop size in sampled plot, (20/5)=4
2. Multiply # total plots x avg pop size in sampled plots, (25 x4)= 100
Answer: 100
Mark-Recapture Method for Estimating Pop. Abundance
1. First a sample is collected and all individuals are distinctively marked.
2. The marked animals are then released into the population and allowed to mix with the population.
3. A second sample is then collected and the number of marked and unmarked animals is tallied.
How many previously marked individuals would expect to find in second count when population is extremely large? When population is extremely small?
- When the population is extremely large, the number of previously marked individuals that would be found in the second count would be relatively small compared to the total population. This is because the marked individuals are a small fraction of the total population, and thus, the probability of capturing one of them would be low.
- When the population is extremely small, the number of previously marked individuals found in the second count would be relatively large. This is because the marked individuals represent a higher proportion of the overall population, increasing the likelihood of capturing them during the second count.
Formula and Key Terms for Mark-Recapture Method
N = (nM/x)
N= estimated pop size
M= # marked individuals in first sample size
n= second sample size
x= # marked individuals in second marked sample size
What are the 4 assumptions of the Mark-Recapture Method?
1. Closed population
2. Equal catchability of marked and unmarked individuals
3. Marks are not lost
4. Random Mixing of marked and unmarked individuals of population
( If these assumptions don't hold, less reliability of the estimate)
Relative Population Size Estimate of estimating Pop. Abundance
- Provides estimate of number of individuals in one time period or place relative to the number in another.
- Its not the population that is counted, but rather a proxy that is believed to be proportional to population size.
- Examples:
- Number of cougar tracks in a given area
- Number of fish caught per unit of effort
- Christmas bird counts (sightings from a particular location)
Interpretation of relative population
- Can be tricky
- For example, number of tracks is related to population density, but also activity levels of individuals.
- Relative population size doesn't necessarily tell you all that much about actual population size.
Distribution/ Geographic Range
- Is the area across which all individuals of the species can be found.
- Within the range, areas of suitable habitat (called patches) and unsuitable habitat may occur.
Metapopulation
- Many populations living in isolated patches of suitable habitat all linked together by (limited) dispersal.
Dispersion
- describes spacing of individuals with respect to one another in a given patch
Patch and Example of Patch
- Each population lives in a" Patch" of suitable habitat.
- Clematis fremontii (Fremont's leather flower)
- Is only found only on calcareous (limestone) glades in prairies.
- Limestone or dolomite bedrock
- Limited soil development
- Hot and dry in summer
3 types of dispersion
1. Clumped
2. Random
3. Regular (Evenly Spaced)
Clumped Dispersion
- Individuals found together in groups (clustered in space).
Random Dispersion
- Individuals distributed independently of each other in space.
Regular (evenly spaced) Dispersion
- Individuals maintain similar distances from each other
Causation of Regular Dispersion in Animals
- Regular dispersion among animals is often caused by antagonistic behavior between individuals (e.g.,competition for space, water, food, etc.).
-Image: Breeding colonies of shore birds maintaining territories for mating and nest space.
Regular Dispersion in Plants
- Regular dispersion among plants is often caused by density dependent mortality.
- Probability of death is positively correlated with density, so maintenance of minimum distance is necessary for survival
- Ex: Equidistant plants in a desert with limited water and nutrients in soils
3 Causations of Clumped Dispersion
1) Clumped distribution of resources
2) Social predisposition to form groups
3) Tendency of progeny to remain near parents
Ex: Pack of Wolves, Herds of Elk
Causation of Random Dispersion
- Rarely Observed
- Statistically significant deviation from random distribution is used as the basis of selection between more clumped or more evenly spaced.regular
Endemic Species
- found in only one place on earth (very restricted range)
Example of Endemic Species
- Devil's hole pupfish (Cyprinodon diabolis) live in a single small desert pool in limestone cave in Nevada's Mojave Desert.
- Giant Galápagos tortoises( Chelonoidis niger) live exclusively on the dry lowlands of the Galápagos Islands, Pacific Ocean, Ecuador
- There are eight species of giant tortoise, each having evolved independently on individual islands of the Galapagos.
- Arguably the most famous example of endemic species, the giant tortoises were described byCharles Darwin during his famous voyage on the Beagle
Cosmopolitan species
-Widely distributed around the world in suitable habitats
Examples of Cosmopolitan Species
- Killer whale, or Orca (Orcinus orca) is located in every major oceanic body on Earth
- Rock dove (Columba livia), also known as the common pigeon, is found in nearly every urban center on earth.
3 Important Questions Relating to Species Distribution
1. Rare and endangered species:
- Are there additional places that we haven't yet looked where a rare species of interest may be present?
- Are there places where the species is absent that could represent viable future habitat?
2. Global warming:
- Where will species of today find suitable habitat 100-200 years in the future?
3. Invasive species:
- Is it possible to forecast where invasive species are likely to spread?
Importance of Species Distribution Models
- Can be used to help predict geographic ranges today and in the future
- Predict presence-absence, not abundance (though they can help identify favorable habitats that are more likely to support higher species abundance).
How to create Species Distribution Model
1.) First, create habitat rules based on the biotic and abiotic conditions (both positive and negative) that influence occurrence and abundance of the species. This is generally achieved by going to locations where the species live and measuring the most important features of the environment.
2.) Second, compare the habitat rules to a detailed map of actual (or future predicted) biotic and abiotic characteristics to identify locations that have the "right" combination of conditions for the species to live. This step is generally performed by sophisticated computer algorithms.
Example use of a species distribution model to look for Madagascar chameleons.
- SDMs predict presence-absence, not abundance (though they can help identify favorable habitats that are more likely to support higher species abundance).
Abiotic Factors that Affect Habitat Suitability (10)
1. Temp
2. Precipitation
3. Light
4. Nutrients
5. Salinity
6. Oxygen
7. Topography
8. Hydrology
9. Soil Characteristics
10. Disturbances (e.x fires, floods, drought)
Biotic Factors that Affect Habitat Suitability (5)
- Prey (food)
- Predators
- Competitors
- Mutualists and/or commensal organisms (especially with respect to presentation of critical habitat)
Correlation of Requirements and Specie's range
- Some species can have remarkably narrow requirements, others surprisingly broad. Generally, the narrower the requirements, the smaller a species' range.
- Example of why Habitat suitability is seldom (not) uniform throughout a species' range
- Kangaroo (Macropus rufus) density throughout Australia reflects strong pattern of habitat quality.
- Species are often (but not always)less common at the edge of their ranges, and most abundant near the center.
Examples of How some species can have dramatic effects on the distribution and abundance of other species
- Prickly pear plant (Opuntia stricta), brought from the Caribbean to Australia in early 1800s for use as hedge.
- By 1870, becomes major invasive species covering 240k square kilometers and representing major threat to grazing livestock
- In 1914 and 1926, caterpillars of the moth Cactoblastis cactorum brought from Argentina to control Opuntia stricta.
- Within 6 years, the cactus populations crashed (billions of cacti dying), a powerful example of biological control.
Example of How Extreme disturbances can be positive for some species, but negative for others.
- Pitch Pines (Pinus rigida) in the NJ Pine Barrens onlypersist where there are periodic fires. They not onlysurvive fires, but also have serotinous cones that onlyopen and shed seeds after a fire
Continental drift
- movement of continents over geological time
What other factors affect Distribution and abundance
- Ecological characteristics of habitats,
- evolutionary history across geologic time.
Evolution History of Ratites and what it means
- Ratites are a group of closely related birds on many continents that can't fly and (most) are very large.
- Scientific community originally assumed large flightless ancestor was spread across Gondwana.
- Genomic analysis has provided some surprising findings about the early ancestors, distribution and evolution of the birds, that state that some birds that are further from each other are actually closer related that those that are geographically proximal
Dispersal
- movement of one or more individuals from one population to another (joining another population or forming a new one)
Active dispersal
- dispersal under an animal's own power.
Passive dispersal
Dispersal helped by environment (e.g. wind or water) or another organism (hitchhikers)
Immigration
- Dispersal into existing population
Emigration
- Dispersal out of existing population.
3 factors that provide opportunities for dispersal
1) Nature of intervening environment
2) Distances between populations
3) Mobility of the species
What is the Relationship between highly mobile species and isolation
- Highly mobile species are less isolated.
- EX: The Snail kites experiences a very low degree of isolation, even with extreme distances between patches.
- Snail kites in Southern Florida are considered single population due to their high degree of mobility.
What is the Relationship between limited mobility species and isolation
- Geckos in Australia are separated by agriculture into separate populations between which there is little movement of individuals.
- Scale of separation is only kilometers, showing the effect of their low degree of mobility on isolation.
- The Australian Gecko experiences a high degree of isolation, despite there being short distances between patches.
Dispersal limitation
- Can prevent species from reaching isolated areas of suitable habitat
Example of how Barriers to long-range dispersal limit geographic distribution.
- Kaibab squirrel (Sciurus aberti kaibabensis)
- Found in ponderosa pine forests of Arizona.
- Separated from Albert's squirrel by deserts and Grand canyon.
- As result, confined to an area of only about 638 square miles.
- Evolved into a new subspecies
- The hoary bat (Lasiurus semotus)
- Is Hawaii's only native terrestrial mammal.
- This is because it was the only mammal able to fly toHawaii and survive over the 500k years subsequent to the islands' creation
Explain how Lack of barriers to long-range dispersal creates opportunities for range expansion
- 160 European starlings (Sturnusvulgaris) were introduced to the United States nearNew York City in 1890/91.
- Populations of starlings expanded across United States over next 75 years.Lack of barriers to long-range dispersal creates opportunities for range expansion.
- By 2020, there were an estimated 150 million European Starlings across North America and 250 million to 1.5 billion around the world.
Migration (Different than dispersal)
- Is the directional, synchronized movement of many or all individuals of a population.
- Some of the largest animals in the world migrate extraordinary distances on their own power every year
- Smaller animals also migrate extraordinary distances.
- Migration is a behavioral adaptation that allows a species to take advantage of favorable conditions at high latitude during the summer and escape extreme winters
- Monarch butterflies can fly 100 miles a day and migrate 3000 miles per year
4 Ways patches supporting a metapopulation can differ
1. Size of patch
2. Quality of patch in terms of resources
3. Distance from other patches
4. Quality of habitat between patches
Components of Source Patch
1. Resources are abundant.
2. Birth rate is higher than death rate.
3. Surplus offspring disperse to sink patches
Components of Sink Patch
1. Resources are scarce.
2. Death rate is higher than birthrate.
3. Population size is maintained by net immigration of individuals from source patch
5 Characteristics of how habitat between patches can affect metapopulation persistence
- Some matrix habitats more easily traversed than others, affecting opportunities for dispersal.
1. Amount of habit to traverse( distance between patches)
2. Resources available (food) 3. Abiotic stresses (e.g. temperature and water availability)
4. Topography and hydrology (rivers, ocean, manmade environments)
5. Predators
Importance of Simon Levins' mathematical model
Can help us understand the importance of colonization and extinction rates in maintaining metapopulations. Basics of the model
Basics of Simon Levins Model
- Extinctions and recolonizations of individual patches occur continuously through time, giving impression of "blinking lights."
- As long as one patch is occupied, the population persists.• - If percentage of patches occupied drops to zero, the metapopulation collapses (population goes extinct.) Blue = occupied White = not occupied
4 Assumptions of Simon Levins Model
- There are an infinite number of identical patches.
- All patches are equally likely to be colonized and go extinct.
- Patches are either occupied or not(number of individuals in a patch is not considered).
- Spatial arrangement of patches does not matter
- Note: The assumptions aren't realistic, but what we can learn from the model is important, nonetheless
Levin's metapopulation model (a differential equation)
- Rate of change in p:
(dp/dt)= cp(1-p)-ep
-Metapopulation persists if:
(e/c)< 1
p*= 1-(e/c)
p*: Equilibrium proportion of patches occupied
p: Current proportion of patches occupied (this changes with time)
c:colonization rate (this is constant)
e: extinction rate (this is constant)
Example Levin's Model:
c=0.4
e=0.3
(a) Will Metapopulation persist?
(b) What will equilibrium proportion of patches be?
(c) What is rate of change when p=0.10
(a) Metatpopulation persists if:
(e/c)<1
(0.3/0.4)=0.75, thus yes, metatpop persists
(b) Equilibrium proportion of patches
p*=1-(e/c)
p*=1-0.75= 0.25
(c) (dp/dt)=cp(1-p)-ep
(dp/dt)=(0.4x0.10)(1-0.10)-(0.3x0.10)= 0.006
3 Important Insights from Levin's Model
1. Metapopulations must have colonization rates that are higher than extinction rates to survive.
2. It is to be expected that all patches of suitable habitat will at times be unoccupied.
3. Maintaining unoccupied patches is critical for the long-term viability of metapopulations.
2 Effects of Fragmentation on Metapopulations Levin's Model
1) Increase distance between patches, making it more difficult to successfully travel between them. This would reduce the metapopulation colonization rate (C).
2) Reduce size of patches, increasing the probability of extinction in individual patches. This would increase theextinction rate (E).
The colonization rate (C) could eventually fall below the extinction rate (E)