chapter 4
3.0(1)
3.0(1)
Card Sorting
1/17
Earn XP
Description and Tags
Study Analytics
Name | Mastery | Learn | Test | Matching | Spaced | Call with Kai |
|---|
No study sessions yet.
18 Terms
1
New cards
a casual relationship is where
there is a reason why something happens
2
New cards
example of a casual relationship is
as the age of something increases its value decreases
3
New cards
with lines of best fit, if you have to plot it through the mean point, it means
find the mean of x and the mean of y and plot that point
4
New cards
interpolation is
within the data and therefore is reliable
5
New cards
extrapolation is
outside the data set and is therefore less reliable than interpolation
6
New cards
line of best fit is also known as
the regression line
7
New cards
equation of a line is
y=mx+c
8
New cards
gradient means that
every time that x increases by 1 the y increases/decreases by m
9
New cards
the y intercept is
the initial thing as it is where x is zero
10
New cards
spearman’s rank tests
how strong or weak the correlation between two things are
11
New cards
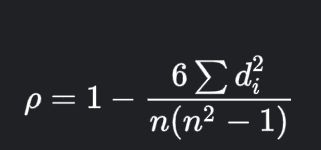
the equation for spearmans rank is
\

12
New cards
in spearman’s, a perfect positive or negative correlation is
1 or -1
13
New cards
in spearmans, a strong positive or negative correlation is
0\.8 or above, -0.8 or below
14
New cards
in spearman’s a weak positive or negative correlation is
0\.4 or above, -0.4 or below
15
New cards
in spearman’s you have to rank both x and y
the same way
16
New cards
spearman’s rank is represented as
rs
17
New cards
spearman’s rank is designed for
non-linear correlation
18
New cards
what is more suitable for linear correlation
pearsons product moment correlation