AP Statistics Unit 1
1/25
There's no tags or description
Looks like no tags are added yet.
Name | Mastery | Learn | Test | Matching | Spaced | Call with Kai |
|---|
No analytics yet
Send a link to your students to track their progress
26 Terms
variable
any characteristic, numbr, or quantity whos values can be changed and measured, counted or observed
Categorical Variable
A variable that can be put into categories but not measured or counted.
Example: Hair color, has a pet, job title
Quantitative Variable
A variable that can be counted or measured
Example: How many pets someone has
Frequency / Frequency Table
Gives the number of individuals in each category
Relative frequency table
Gives the proportion of individuals in each category
Proportion: frequency/total

Bar Charts
used to dispay frequencies or relative frequencies for one categorical variable
Discrete Variable
can take on a countable number of values with gaps
Example: number of students in a classroom, website clicks
Continuous Variable
can take on infiinitely many values, but those values cant be counted
Example: height weight, distance
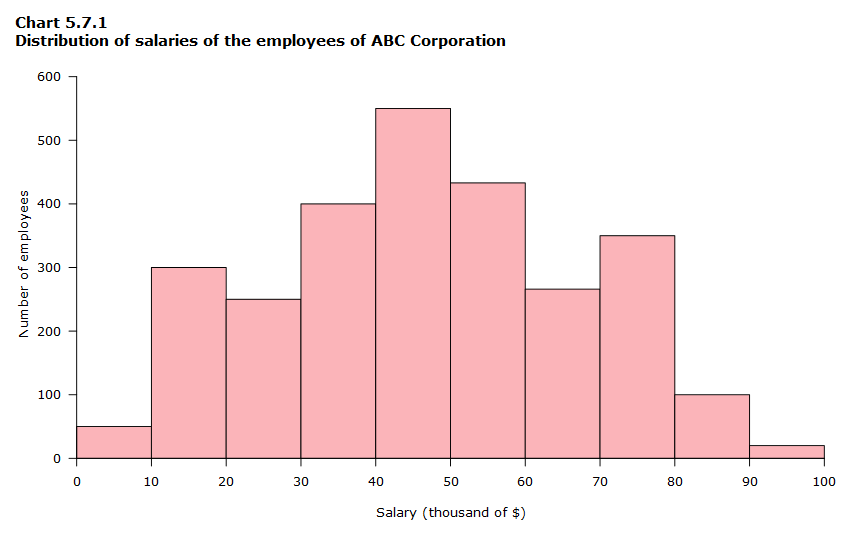
Histogram
Used for quantitative data
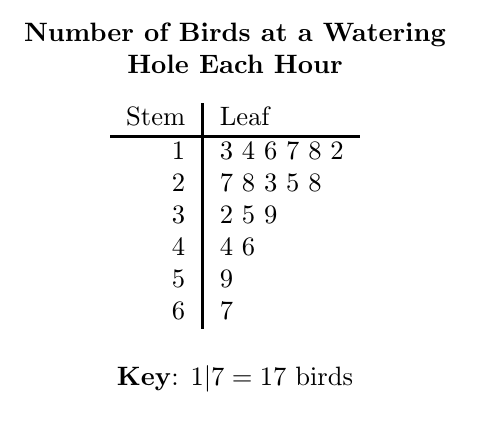
Stem and Leaf Plot
used for quantitative data; must have a key
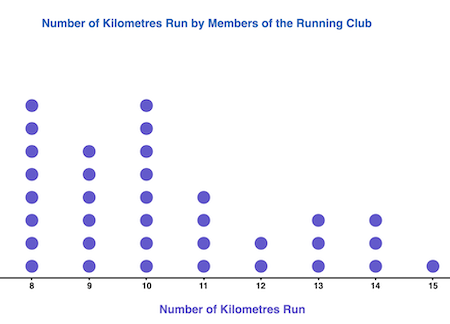
Dotplot
Shape of Distribution
Skewed right: tail is to the right
Skewed left: tail is to the left
Symmetric: no tail
Unimodal: one peak
Bimodal: two peaks
Multimodal: three peaks
uniform: all bars are the same height
Center of Distribution
median middle of the data (resistent to outliers)
mean: sum of all data values divided by the number of values (non-resistent to outliers)
Variability (Spread) of Distribution
Range: maximum-minimum
Interquartile Range: difference between q3 and q1
Standard Deviation: typical distance that each value is away from the meanUn
Unusual Features
Outliers
Gaps
Clusters
Lower Quartile (Q1) and Upper Quartile (Q3)
Q1 is the median of the first half
Q3 is the median of the second half
Percentile
the percent of data values (less than or equal to) a given value
“The value of __ is at the pth percentile. About (p) percent of the values are less than or equal to _”
Calculate the number of values below it (include that number too) and divide it by the total number of values to find percentile
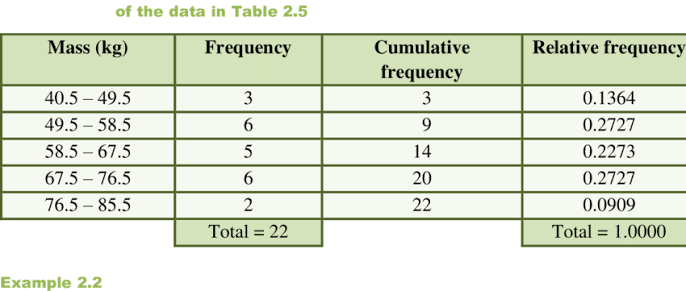
Cumulative Frequency
Cumulative Relative Frequency
1.5 IQR Method
Low outlier is less than Q1 - 1.5 x IQR
High outliers are greater than Q3 - 1.5 x IQR
Five Number Summary
miminmum
Q1
median
Q3
maximum
Box plots
Split data into 4 quartiles
The Normal Distribution
a mound shape and symmetric graph. determined by mean and standard deviation
Empirical Rule
68-95-99.7
Within 1 SD of mean = 68% of data
Within 2 SD of mean = 95% of data
Within 3 SD of mean = 99.7% of data
Z Score (Standardized Score)
data value-mean/standard deviation
Determining Proportions for Normal Distribution
Sketch the normal curve and shade the area in question
Calculate a z-score
Find the matching Probability using Table A
Interpret the probability: “__ percent of (context) is less than (value)”