CHI SQUARE TEST
1/5
There's no tags or description
Looks like no tags are added yet.
Name | Mastery | Learn | Test | Matching | Spaced | Call with Kai |
|---|
No analytics yet
Send a link to your students to track their progress
6 Terms
Null hypothesis
assumes data will fit given ratio or model
no difference between what you observed and what you expected
any apparent different between observation and the model is attributed purely to chance
can never be proven
your experimental evidence can only “support” or “reject” the null hypothesis
“support” is also sometimes worded “fail to reject”
Alternative hypothesis
assumes there is a difference between observed data and model
Chi square statistical test
also known as “goodness of fit” test
evaluates influence of chance on data
assesses whether your data is consistent with the model/hypothesis
model = expected outcome
p-value
statistical measure of significant differences between datasets
p value greater than α = null hypothesis is supported (fail to reject)
p value less than α = null hypothesis is rejected (too much variation)
p-value = 0.05 (5%)
means that if you repeated the same experiment, there would be a 5% chance you would observe the same variation or greater in your data
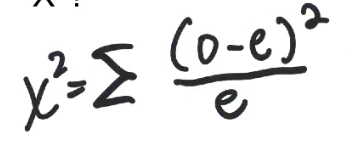
X2
o = observed
e = expected
∑ = sum