Biology 108 - Exam 2
0.0(0)
Card Sorting
1/165
Earn XP
Description and Tags
Last updated 8:23 AM on 11/7/22
Name | Mastery | Learn | Test | Matching | Spaced | Call with Kai |
|---|
No analytics yet
Send a link to your students to track their progress
166 Terms
1
New cards
Population size dictates the ________ .
strength of genetic drift
2
New cards
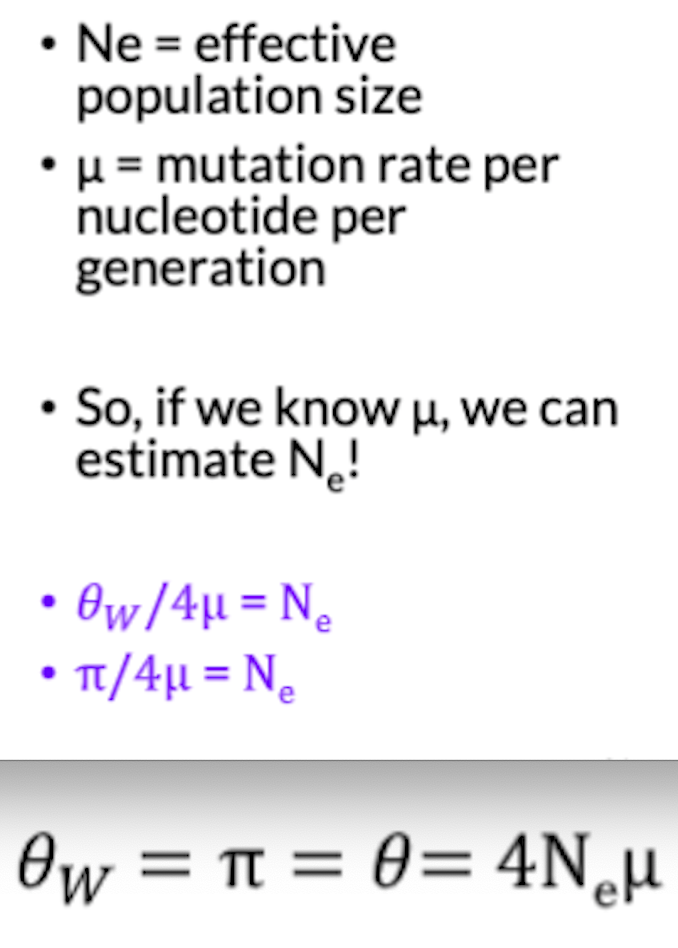
What can we estimate?
Effective population sizes for real populations
3
New cards
There is a balance between _______ .
the loss of variation due to drift and new mutations
4
New cards
Genetic drift causes ______ .
neutral genes to evolve in a "clock-like" manner
5
New cards
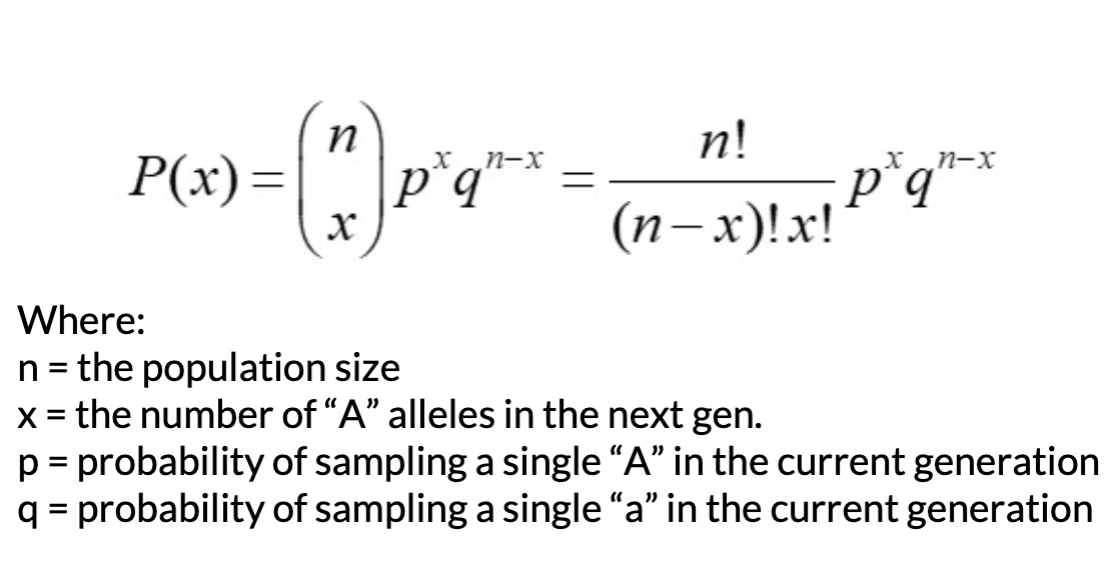
The binomial distribution
can model the probability of getting a particular number of “A” alleles in the next generation
6
New cards
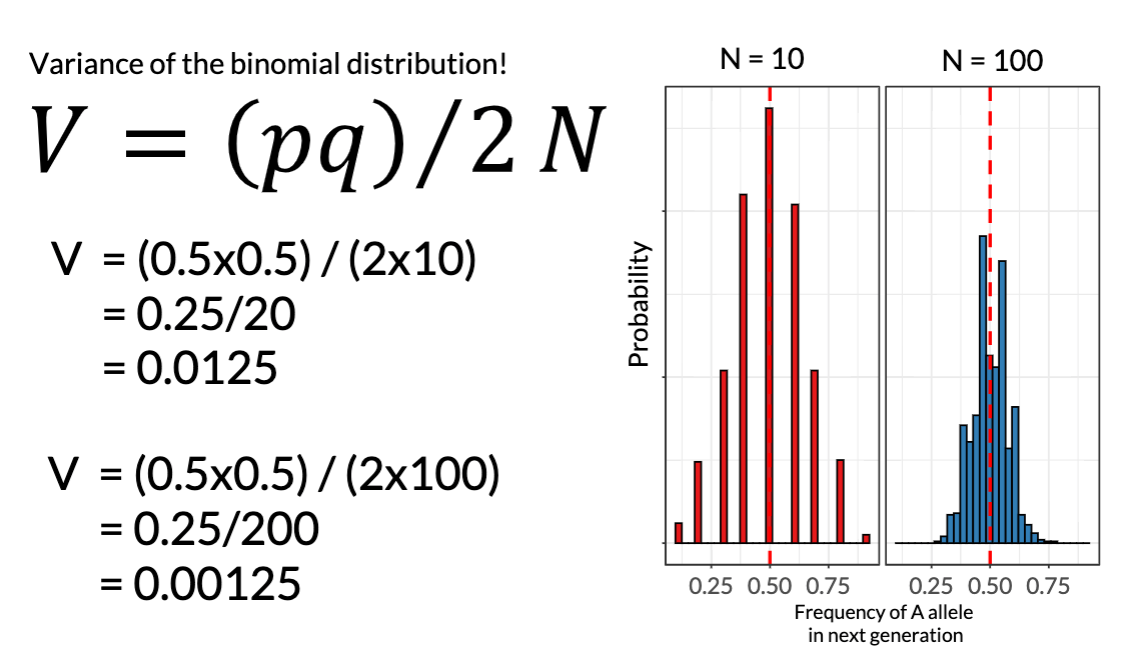
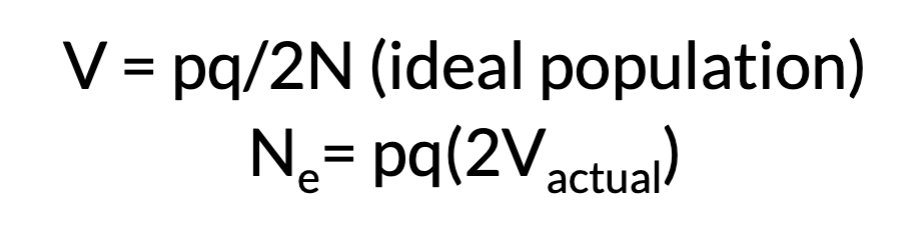
The expected variance in allele frequency due to one generation of drift is:
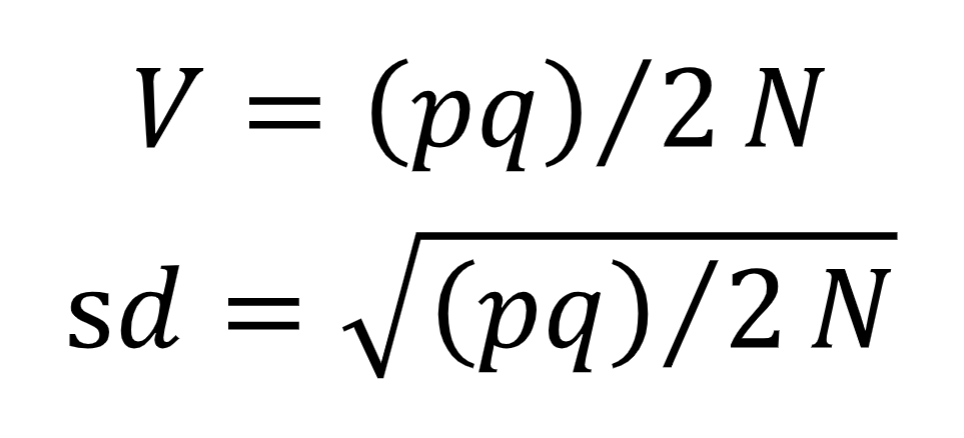
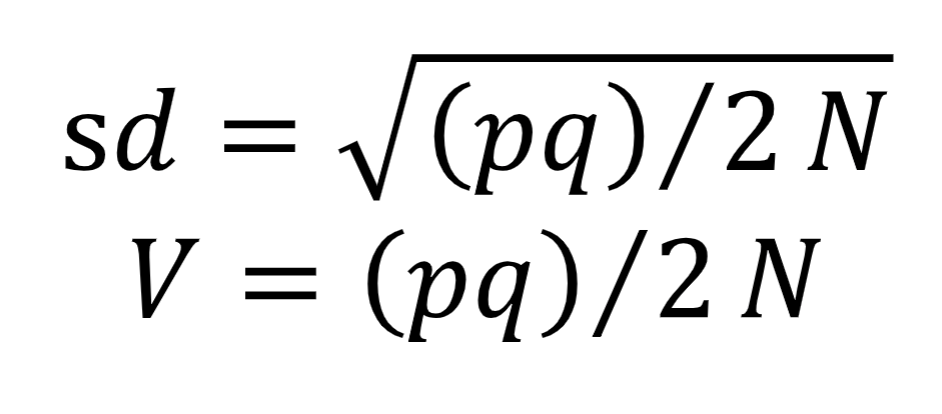
V = (pq) / 2N (variance of the binomial distribution)
7
New cards
The standard deviation is an _____ .
approximation of the magnitude of expected change in allele frequency in the next generation
8
New cards
Both the ________ and _________ of the ___________ are _________ .
magnitude, variance, change in allele frequency, proportional to population size
9
New cards
How can we estimate the size of real populations?
go out and count every single individual, use a mark-recapture approach, call the count of all the individuals in the population the “census size” (Nc)
10
New cards
The census size is often ______ as the “N” of the actual gene pool.
not quite the same
11
New cards
Every individual may ______ to the gene pool.
not contribute
12
New cards
The population size may be ________ .
fluctuating to some extent through time
13
New cards
Effective population size Ne
The number of breeding individuals in an idealized population that would show the same amount of genetic drift as seen in the population being studied
14
New cards
We can use the _______ to estimate Ne!
relationship between variance and N
15
New cards
We can measure _______ using ______ .
variance in allele frequency for a population, temporal
sampling
sampling
16
New cards
Estimating Ne by temporal sampling makes ______ .
many assumptions about the populations/alleles
17
New cards
Why does estimating Ne by temporal sampling make many
assumptions about the populations/alleles?
assumptions about the populations/alleles?
the allele you are measuring is drifting neutrally, often difficult/impossible to be sure of neutrality, 4-fold degenerate sites are a common choice for “neutral” alleles
18
New cards
Knowing Ne size allows you to ______ .
estimate many other key parameters; strength of genetic drift, times when populations/species split, mutation rates
19
New cards
New mutations _______ .
constantly arise and increase variation
20
New cards
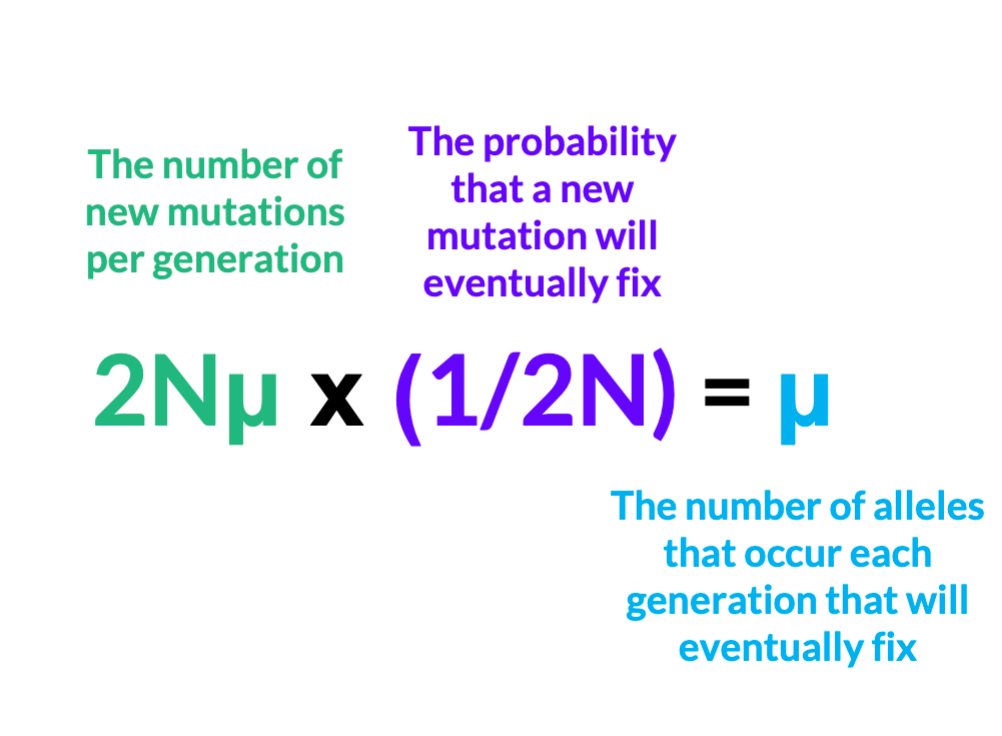
µ (“mu”)
the mutation rate for a single locus, probability of a new mutation each generation per haploid genome (gamete), number of alleles that occur each generation that will eventually fix
21
New cards
The per-generation probability that a gamete or offspring has an allele ______ .
is different from the parental genome at a particular locus
22
New cards
At least some mutations are _____ neutral.
not
23
New cards
Mutations with large fitness effects can ___ .
easily overcome drift
24
New cards
Mutations with small fitness effects _____ .
can’t easily overcome drift
25
New cards
When drift is weaker (larger Ne), _______ .
smaller effect mutations can overcome it
26
New cards
Recessiveness causes ______ .
the average selective effect of traits to be small
27
New cards
Many genetic diseases are the ______ .
result of drift in small populations
28
New cards
Amish populations show ____ .
unusually high allele frequencies for alleles related to dwarfism (Ellis–van Creveld syndrome), Angelman syndrome, and various metabolic disorders
29
New cards
In the long term, drift causes the ______ .
eventual fixation of one allele
30
New cards
The total number of NEW mutations each generation is _____ .
proportional to population size
31
New cards
2N
number of haploid genomes per diploid individual
32
New cards
2Nµ
number of new mutations every generation
33
New cards
initial frequency
the probability that a neutral allele will eventually fix
34
New cards
New mutations appear in ____ .
single copies
35
New cards
1/2N
probability that a new mutation will eventually fix

36
New cards
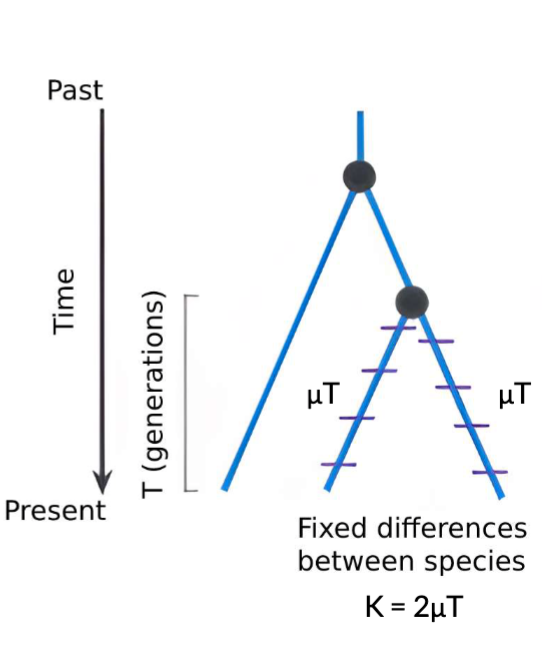
Populations accumulate fixed differences at a _____ .
constant rate
37
New cards
“Neutral Theory of Molecular Evolution”
populations/species accumulate fixed differences at a constant rate like a “molecular clock”, most mutations that differ between populations/species are neutral
38
New cards
We can use the molecular clock to ____ .
date how long two species have been isolated
39
New cards
K=2μT
# fixed differences (K) between 2 species that separated from one another T generations ago
40
New cards
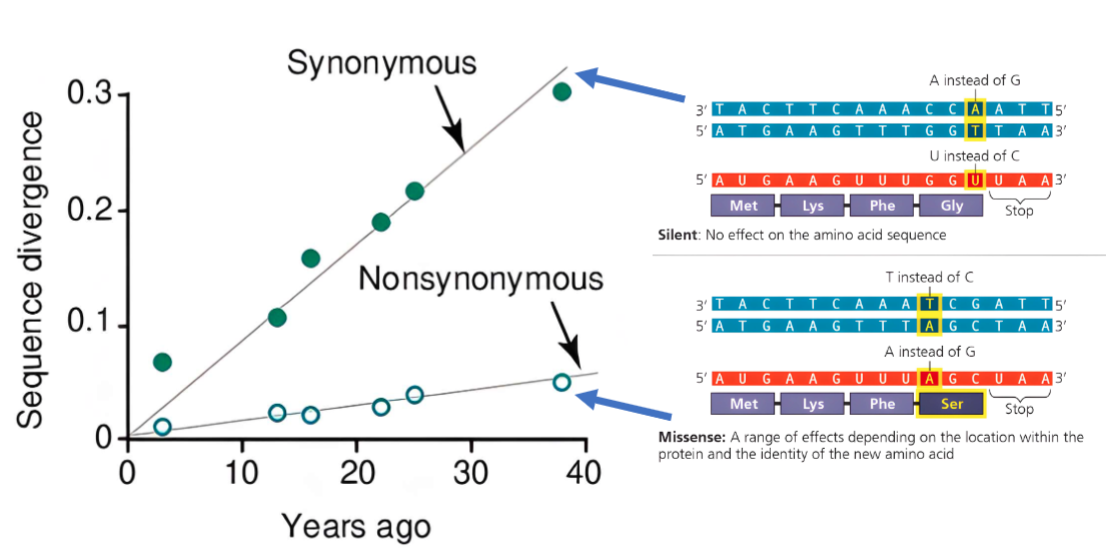
Non-neutral mutations evolve at _____ .
non-neutral rates
41
New cards
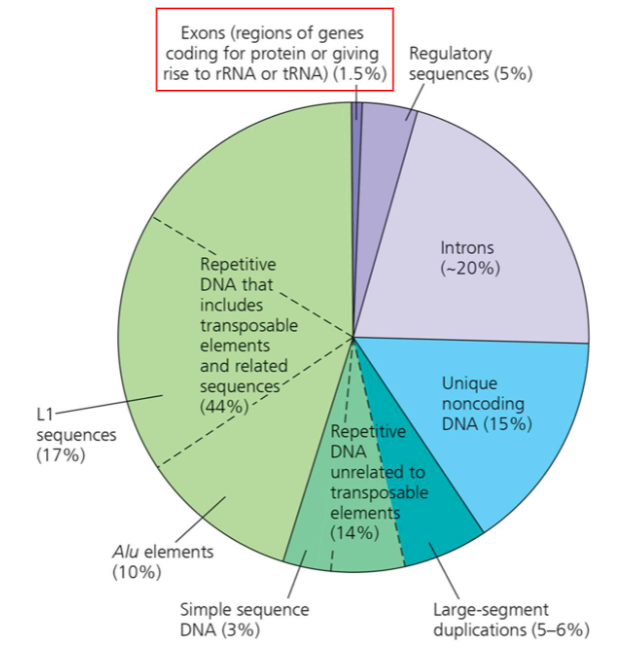
Most of the genome is ______ .
not particularly functional
42
New cards
When populations become geographically isolated, _______ .
they evolve differences in allele frequencies
43
New cards
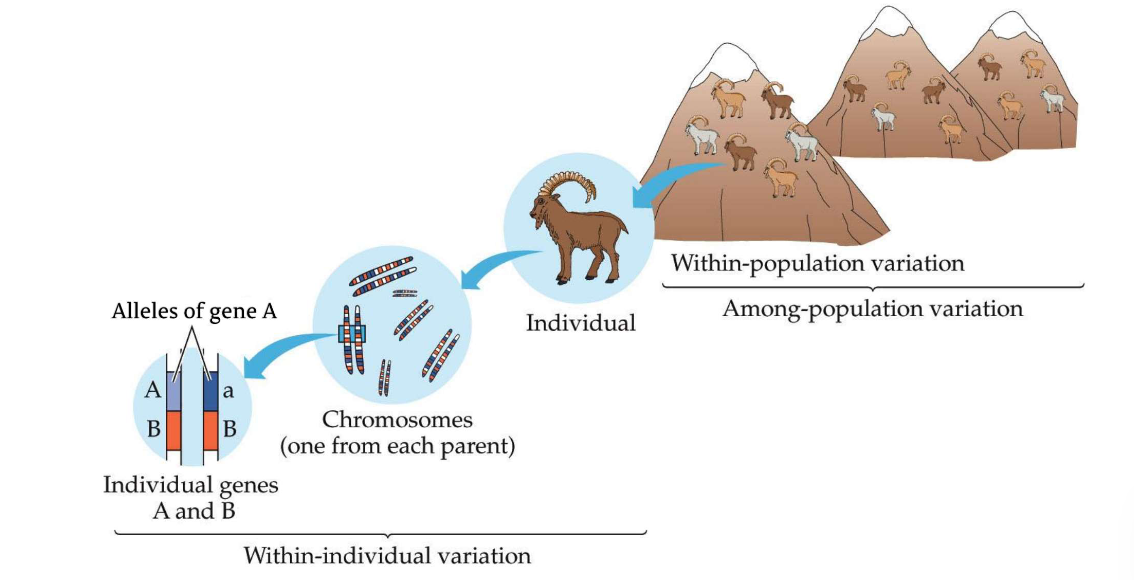
Genetic diversity is _____ .
hierarchically structured
44
New cards
We can summarize variation at ____ .
multiple loci or a single locus
45
New cards
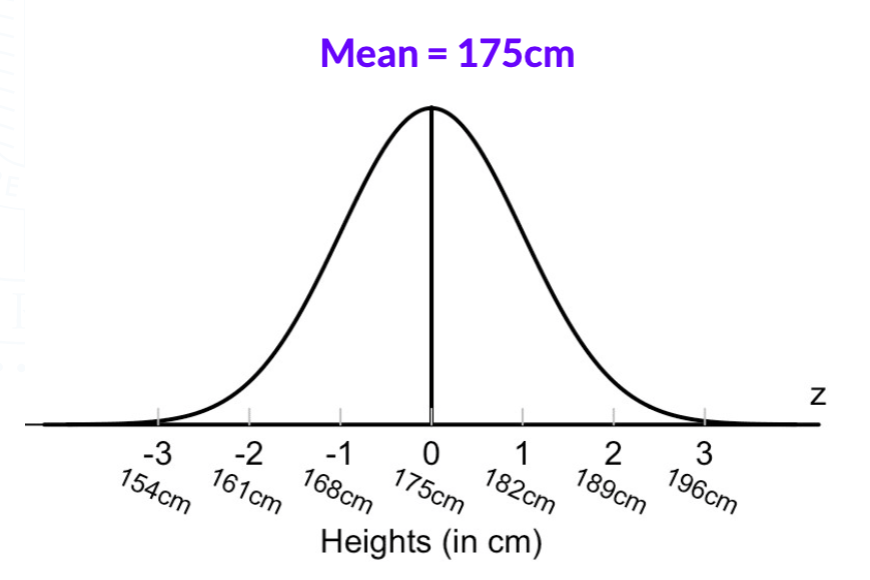
Summary Statistics
metrics (usually single values) that summarize/describe some attribute of a set of observations
46
New cards
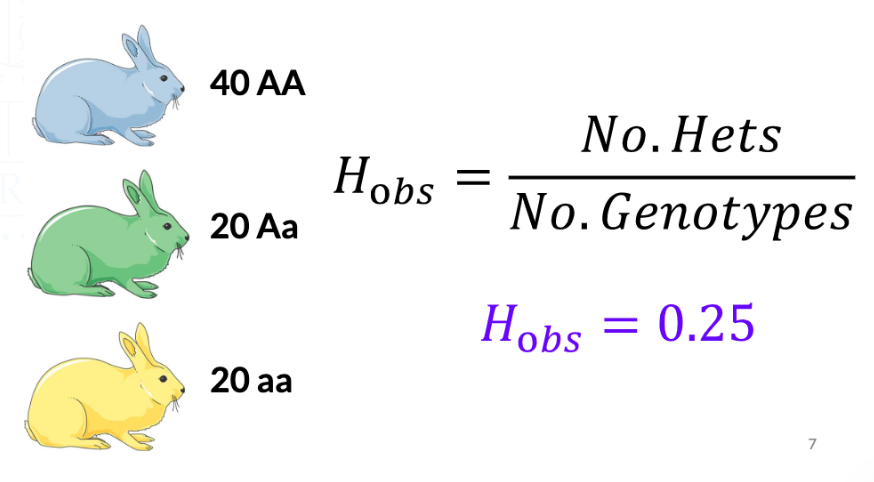
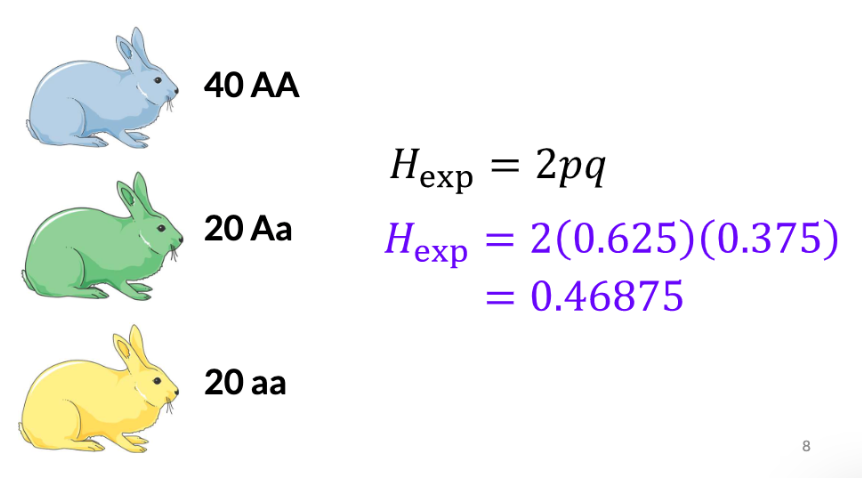
Two forms of heterozygosity:
Observed heterozygosity (Hobs or Ho), Expected heterozygosity (Hexp or He)
47
New cards
Observed heterozygosity is just the ______ .
proportion of heterozygous genotypes
48
New cards
Expected heterozygosity is the _____ .
number of heterozygotes expected under HW Equilibrium
49
New cards
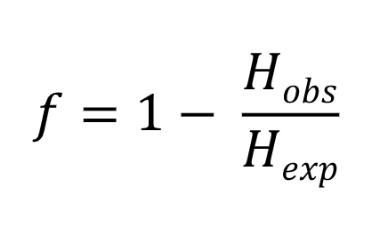
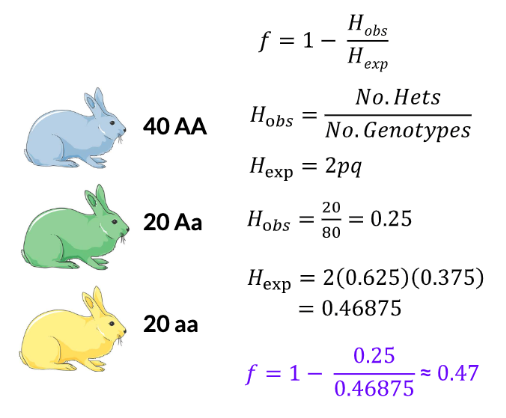
We can use Hobs and Hexp to ______ .
quantify inbreeding
50
New cards
Inbreeding (f)
measure of the deficit of expected heterozygotes, ranges from zero (no inbreeding) to one (no heterozygotes), undefined when p or q = 0, often elevated due to sibling matings and/or selfing (e.g. in plants)
51
New cards
We often want to ________ for a ______ .
quantify genetic variation, whole sequence
52
New cards
Example of interbreeding problem
53
New cards
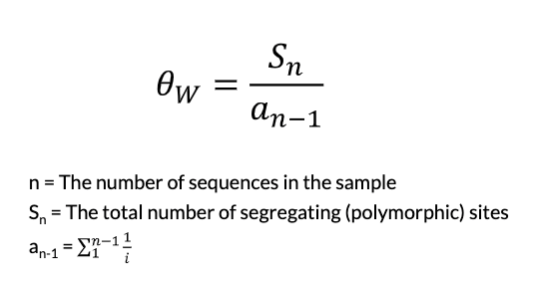
Watterson’s theta
number of polymorphic sites
54
New cards
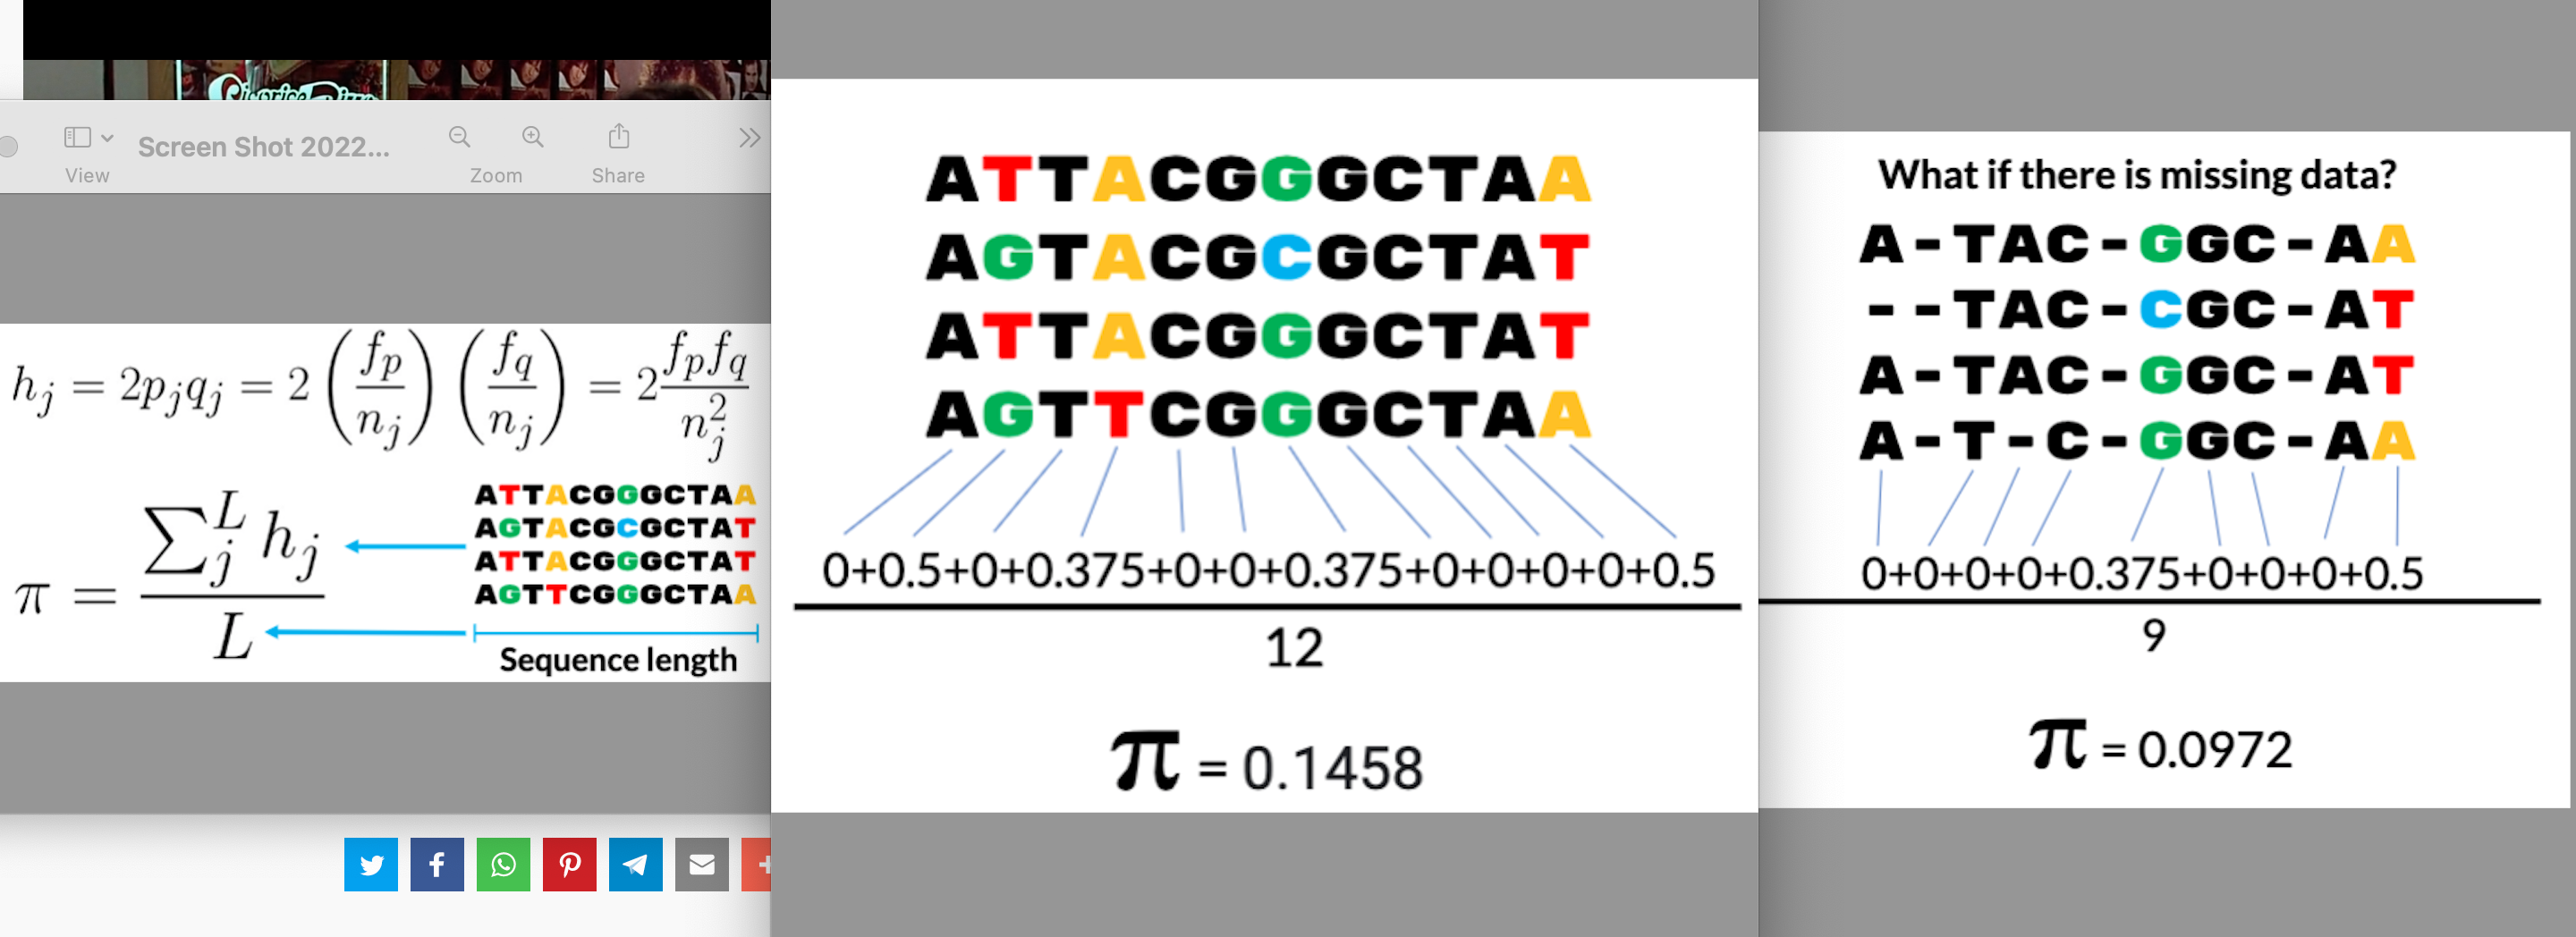
Nei’s theta (pi)
mean expected heterozygosity per nucleotide
55
New cards
How much variation do we expect to see in a sequence?
at equilibrium between drift and selection, both π and θ are expected to be equal to the “population scaled mutation rate”
56
New cards
We can use _____ to ______ in the ________ .
summary statistics, visualize diversity, genome
57
New cards
We can use ______ to ____ that might be _____ .
patterns of diversity, identify loci, evolving rapidly (or slowly)
58
New cards
Species are composed of ______ .
multiple populations
59
New cards
We can measure variation ______ .
both within and between populations
60
New cards
We are often interested in how populations _____ .
differ in diversity or allele frequencies
61
New cards
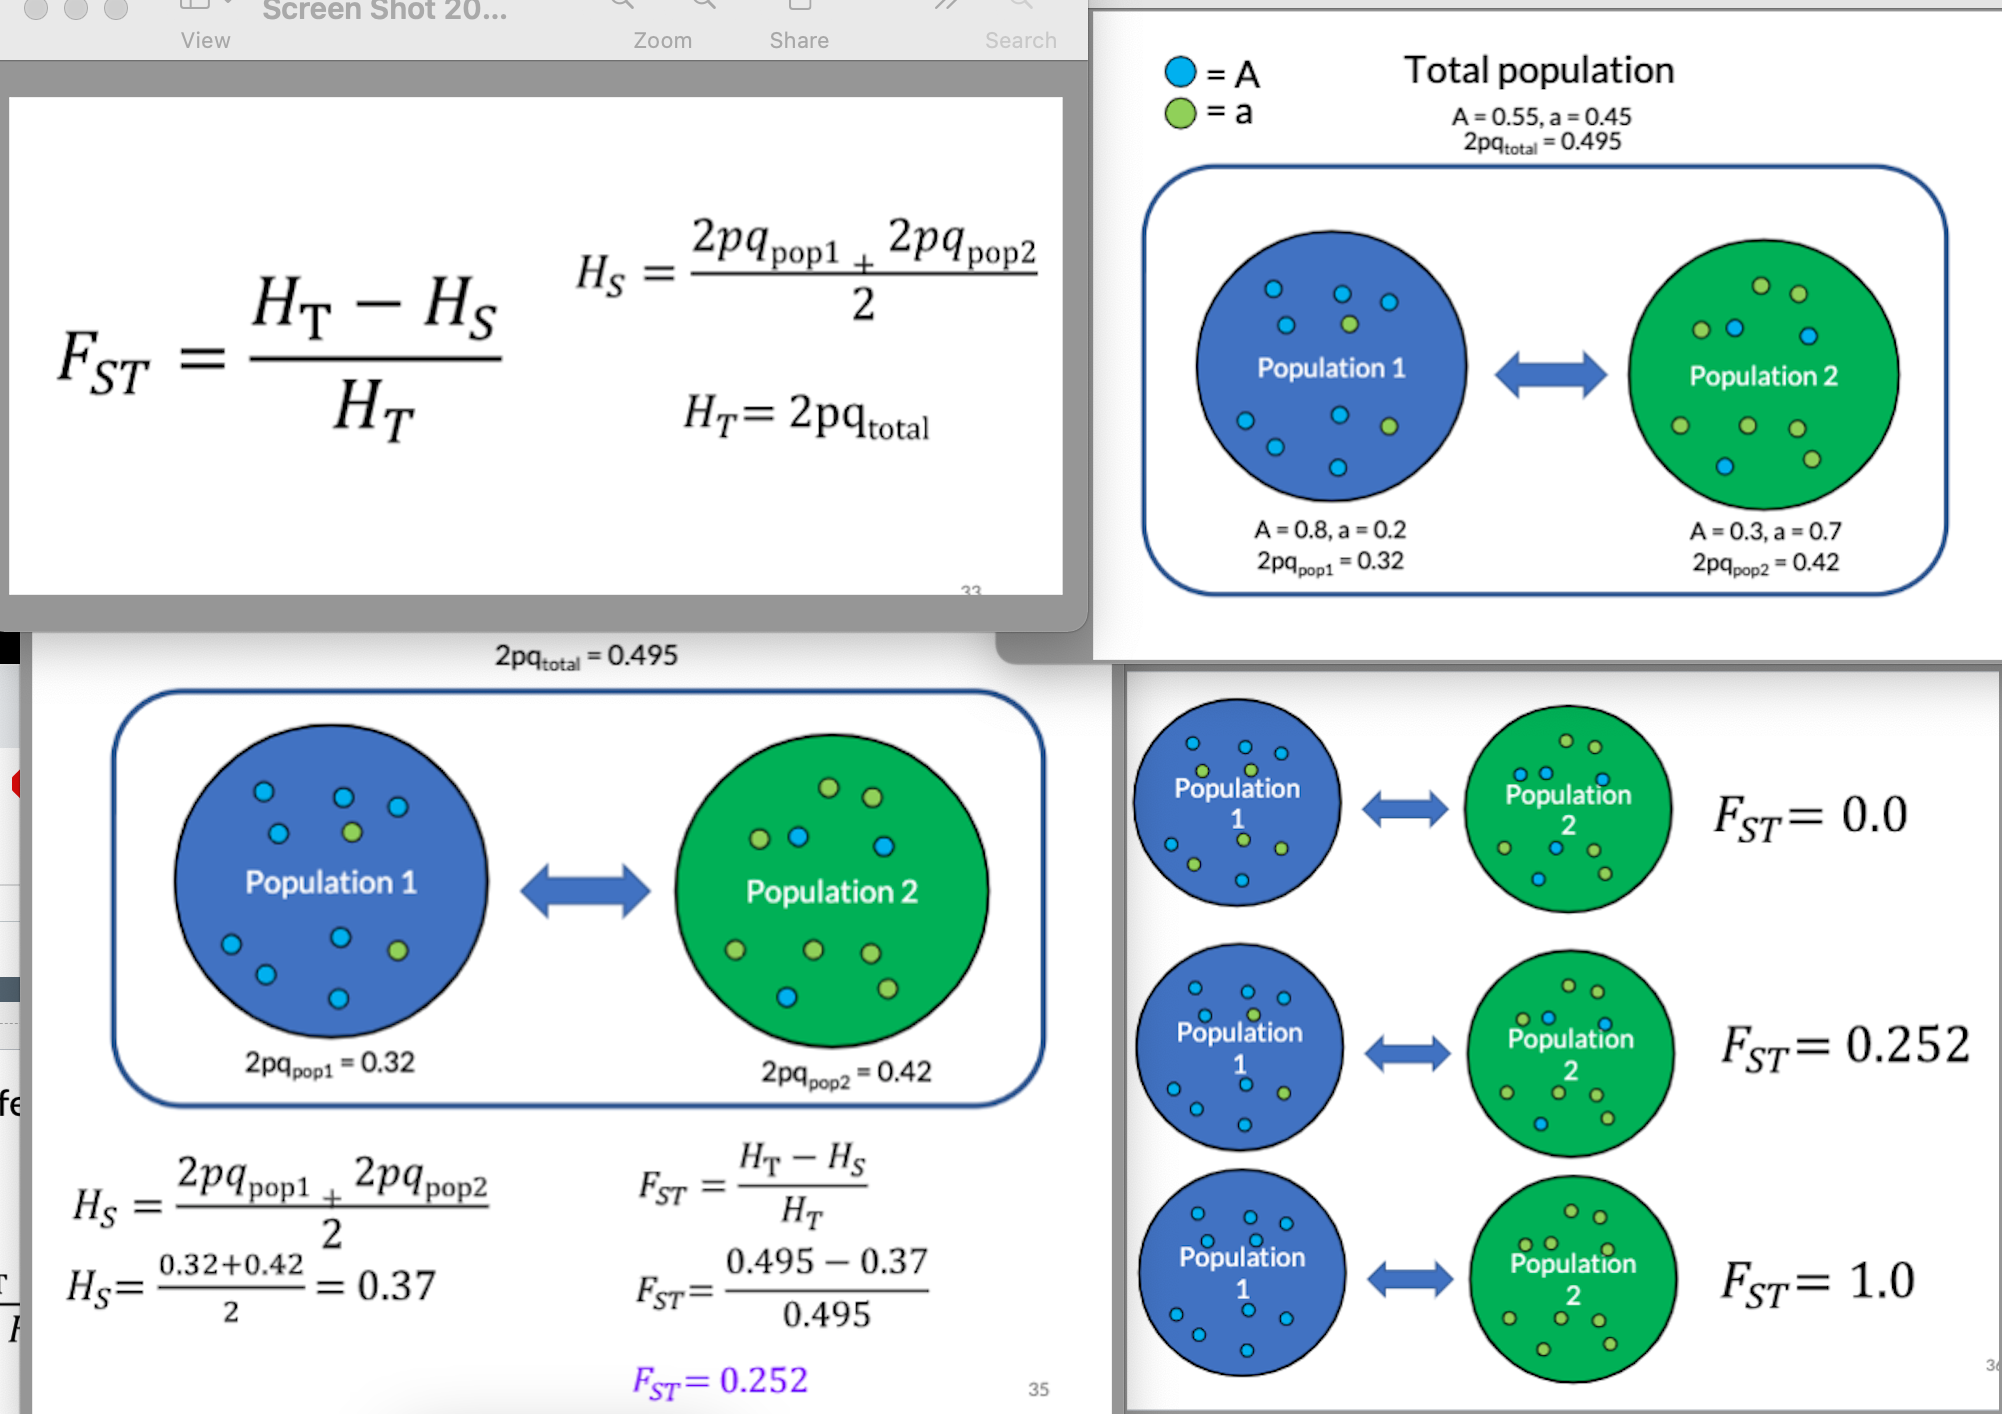
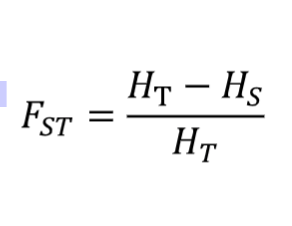
FST tells us _____ .
how much genetic variation is within populations compared to the total population
62
New cards
Evolutionary processes affect FST in various ways such as:
genetic drift causes FST to increase, selection (e.g. because of different environments) increases FST, gene flow decreases FST
63
New cards
FST tends to increase with ____ .
geographic distance between populations
64
New cards
We can compute FST along the ____ to _____ involved in _____ .
genome, identify loci, local adaptation
65
New cards
We can visualize genetic variation ______ .
within and between populations in various ways
66
New cards
Principal Components Analysis ______ .
compresses genotypes at many loci in a 2-D plot
67
New cards
Populations cluster together because of _____ .
close proximity, intermixing, and shared genetic history
68
New cards
Why can it be difficult to identify groups of individuals that cluster together (like humans)?
there are very small differences between populations
69
New cards
natural selection
change in allele frequency due to differential survival or reproduction of genotypes (fitness) with differing phenotypes
70
New cards
Selection is ______, but can be _________ .
non-random, overwhelmed by drift in small populations
71
New cards
What did Rosemary & Peter Grant perform in the Galapagos?
identified genes and SNPs strongly associated with beak size using FST
72
New cards
Selection causes ______ .
changes in the frequency of both phenotypes and alleles
73
New cards
“Selection for” a trait causes _________ .
both it and its allele(s) to increase in frequency
74
New cards
“Selection against” a trait causes _______ .
both it and its allele(s) to decrease in frequency
75
New cards
No evolutionary force other than _________ causes adaptation!
natural selection
76
New cards
Differences in fitness are the ________ .
ultimate cause of all natural selection
77
New cards
Fitness
quantitative measure of how much an individual with a particular phenotype or genotype will contribute to the next generation on average
78
New cards
What are the 2 types of fitness?
absolute and relative
79
New cards
Absolute Fitness
number of fertile, surviving offspring of an individual or a particular genotype
80
New cards
Relative Fitness
fitness of a genotype relative to the genotype with the highest fitness in the population
81
New cards
We can use _______ to represent _________ .
coefficients, differences in fitness between genotypes
82
New cards
What are the coefficients that represent differences in fitness between genotypes?
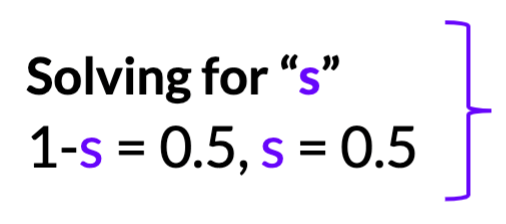
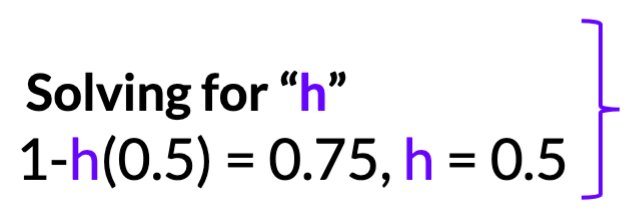
“W” = relative fitness of a genotype, “s” = the selection coefficient, “h” = the dominance coefficient
83
New cards
What does the selection coefficient tells us?
relative fitness of “aa” vs “AA”(i.e. how much “worse” aa is)
84
New cards
What does the dominance coefficient tells us?
how fitness is modified in heterozygotes
85
New cards
In sufficiently _____ populations, if there are ______ between genotypes , _________ .
large, fitness differences, selection will always occur
86
New cards
Unlike genetic drift, ______ is _____ .
natural selection, predictable
87
New cards
Natural selection tends to ______ .
reduce genetic variation
88
New cards
Strong selection can _____ .
severely deplete genetic variation
89
New cards
In general, selection can only act when ______ .
Nes > 1
90
New cards
Even ______ can change ________ given long time scales.
VERY weak selection, allele frequencies
91
New cards
The predator cannot _______ so the _____ .
“see” the genotype, phenotype is the target of selection
92
New cards
Selection on alleles is a result of ______ .
selection on phenotypes
93
New cards
Most of the time, selection is quite _____ , but can be _____ .
weak (s<
94
New cards
Some lineages evolved to have _______ x higher fitness than their ancestors
in the presence of ___ !
in the presence of ___ !
~10,000, antibiotics
95
New cards
We can directly mathematically model changes in
_______ due to _____ .
_______ due to _____ .
allele frequency, selection
96
New cards
We can use mathematical models to _____ .
predict the outcome of evolution
97
New cards
We can visualize ______ using the metaphor of a ______ .
adaptative evolution, “fitness landscape”
98
New cards
Why do we use basic mathematical equations to model selection?
make predictions about evolution, build intuition for how selection works in real populations, much faster than performing simulations
99
New cards
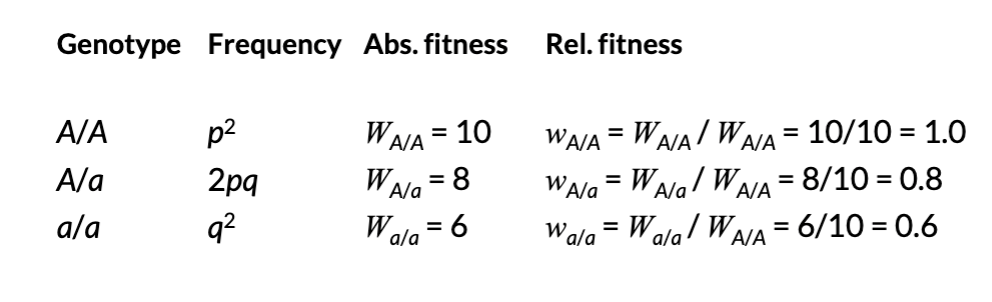
model of natural selection
defines absolute and relative fitness for each genotype, using A/A as the standard
100
New cards
(model of natural selection) How will allele frequencies change due to selection?
w is the probability of survival from zygote to adult (viability)