math s1
1/51
There's no tags or description
Looks like no tags are added yet.
Name | Mastery | Learn | Test | Matching | Spaced | Call with Kai |
|---|
No analytics yet
Send a link to your students to track their progress
52 Terms
P(A)
P(B)
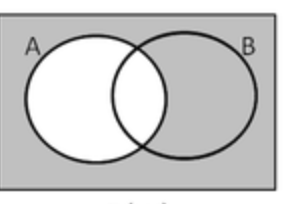
P(A’)
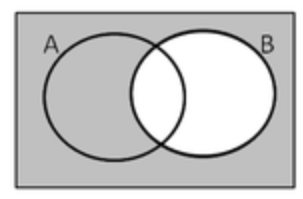
P(B’)
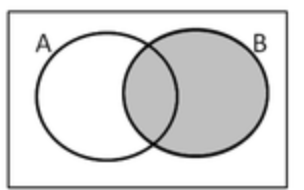
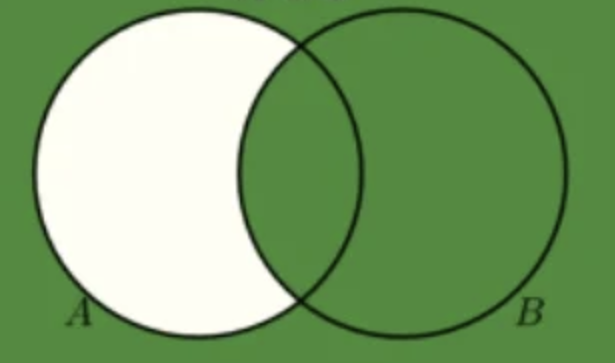
P(A’ intercept B)
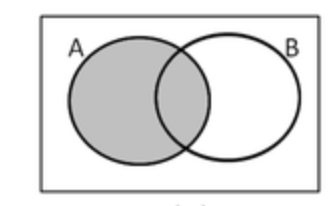
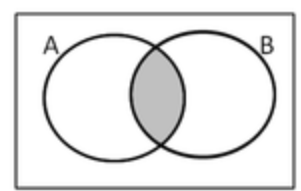
P(A intercept B)
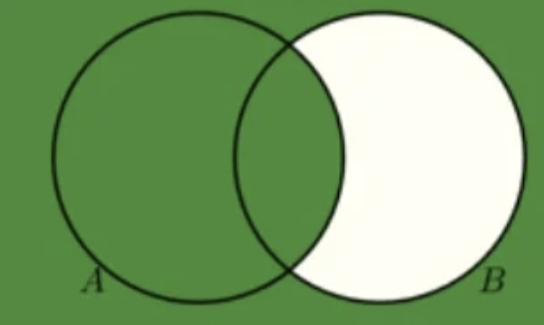
P(AUB’)
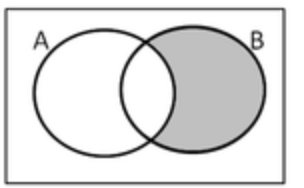
P(A’UB)
mutually exclusive events
events with no outcomes in common
mutually exclusive event set notations
P(A or B)
P(A or B) = P(AUB)
P(A) + P(B)
independent events set notations
P(A and B)
P(A and B) = P(A intercept B)
= P(A) x P(B)
P(W and X) / P(W intercept B)
is equa'l to
P(W) - P(W and not X)
P(WUX) formula with 1
= 1- P(neither W nor X)
P(WUX) formula with P(W intercept X)
= P(W) + P(X) - P(W intercept X)
P(A given B) formula
P(A intercept B) / P(B)
measures of spread
range
interquartile range
variance formula

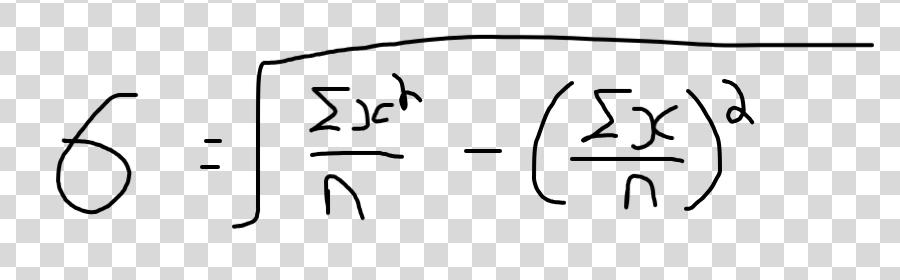
standard deviation formula
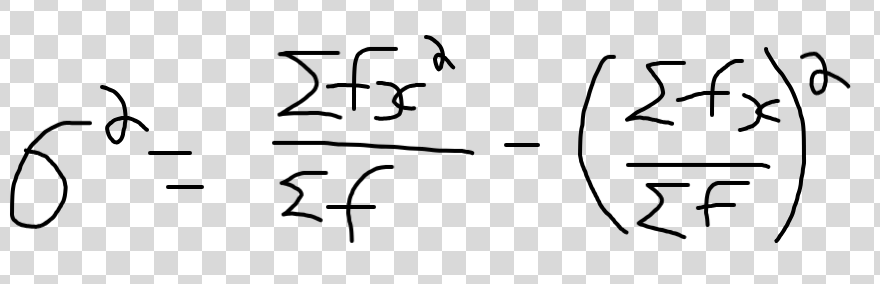
variance grouped data formula
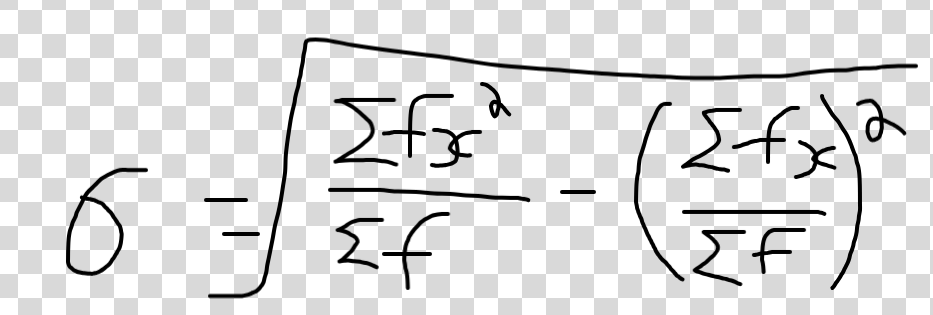
standard deviation grouped data formula
f.d =
frequency/class width
what is frequency represented by
area of histogram
what is a histogram used to store
continuous data
outlier
extreme value outside of overall pattern
outlier formula
any value greater than Q3 + k(Q3-Q1)
Q3 + k(IQR)
or less than Q1 - k(Q3-Q1)
Q1 - k(IQR)
how are data sets compared
measure of location (mean, mode, median)
measure of spread (IQR, standard deviation)
can compare mean and standard deviation
or median and iqr if extreme value
key thing to remember for stem and leaf diagrams
draw a key
always round up for positions
histogram area formula
area = k x frequency
area = wxh
how to know if something is positive skew
data mostly at lower values
mode<median<mean
Q2-Q1<Q3-Q2
how to know if something is negative skew
data mostly at higher values
mode>median>mean
Q2-Q1>Q3-Q2
how to know if something is symmetrical skew
data spread evenly
mode = median=mean
Q2-Q1=Q3-Q2
formula showing how skewed daa is
3(mean-median)/standard deviation
0 is symmetrical
+ is positive
- is negative
mean formula
sum of x/n
combined mean formula
n1(mean of x1) + n2(mean of x2)/n1 + n2
given data revelas that 18 of the 25 in the frequency of a group were not in fact accurate, given that the values are below the median how owuld this effect the median
no change as values are all below median
given data revelas that 18 of the 25 in the frequency of a group were not in fact accurate, given that the values are below the median how would this effect the mean
decrease as f(x) will be lower
given data revelas that 18 of the 25 in the frequency of a group were not in fact accurate, given that the values are below the median how would this effect the standard deviation
increase as data becomes more spread out
data mostly at lower values
positive skew
mode<median<mean
positive skew
Q2-Q1<Q3-Q2
positive skew
data mostly at higher values
negative skew
mode>median>mean
negative skew
Q2-Q1>Q3-Q2
negative skew
linear regression equation
y = a + bx
b =
Sxy/Sxx
a =
mean of y - b(mean of x)
Sxy =
sum of xy - [(sum of x)(sum of y)]/n
Sxx
sum of x² - (sum of x)²/n
Syy
sum of y² - (sum of y)²/n
how to interpret pmc
value of r always falls between -1 and 1
Positive Correlation (r>0): As one variable increases, the other variable tends to increase.
Negative Correlation (r<0): As one variable increases, the other variable tends to decrease