Marine Ecology: Exam I
1/143
There's no tags or description
Looks like no tags are added yet.
Name | Mastery | Learn | Test | Matching | Spaced | Call with Kai |
|---|
No analytics yet
Send a link to your students to track their progress
144 Terms
Who coined the term “ecology” and what is the etymological origin of the term
The term “ecology” was first coined in 1866 by German zoologist Ernst Haeckel, derived from the Greek "oikos" meaning "house" or "place to live”.
Structure
The distribution and abundance patterns of organisms.
Function
Species interactions and the transfer of nutrients and energy
How did the traditional study of natural history differ from modern ecology?
The traditional study of natural history was focused on describing naturally occurring phenomena with little explanation and no experimentation.
Who was Thomas Malthus and how did he contribute to ecological thinking?
Thomas Malthus wrote “An Essay on the Principle of Population” and suggested that human populations are limited by natural checks. He provided Darwin and Alfred Russel Wallace with “a theory by which to work” as they developed their respective theories of evolution through natural selection.
Be familiar with the contributions of pioneering ecologists like Forbes, Semper
and Clements. What familiar ecological analogy did all three of these people
elaborate on in their writings?
Forbes sought quantitative evidence concerning his ideas, unlike others. He was aware of the existence of generalist and specialist feeders, and also of the forces of predation and competition. Stephen A. Forbes wrote “The Lake as a Mesocosm” where he came up with the idea of “The community as an organism” and applied it alongside Carl Semper and Frederic E. Clements.
How much of earth’s biosphere is encompassed by its oceans?
98%
Sir John Ross, Sir James Clark Ross and Christian Ehrenberg - who the heck were these dead guys and what did they do?
Sir John Ross led one of the first major attempts to investigate the distribution of life in the ocean. He created a device called the “deep seas clam” to recover sea stars and worms from nearly 2 km deep in Canada's Baffin Bay.
Sir James Clark Ross undertook similar investigations in the Antarctic, recovering specimens from as deep as 7 km, and noted these organisms survived only in very cold water, leading him to conclude the deep sea must be of uniformly low temperature.
Christian Ehrenberg discovered many terrestrial rocks were composed of the remains of microscopic marine organisms originally deposited as ocean sediments and was the first to attribute ocean surface bioluminescence to a biological agent.
Describe the history of the “rise and fall of the Azoic Theory.” Be sure to include the significant players and details of the landmark ecological voyage that laid this theory to rest.
British naturalist Sir Edward Forbes in 1839 persuaded the British Association for the Advancement of Science to establish a Dredging Committee and to provide funds for dredging studies. It developed systematic sea floor survey methods, including recording the location and depth of collections and numbers of organisms collected. Forbes' studies along the British coasts and in the Aegean Sea led him to define distinct biological zones of characteristic fauna of the sea bottom. He noted that species consistently occurred in the same faunal assemblages and depth ranges. Forbes' History of British Star-fishes detailed the first in-depth study of life beyond the intertidal zone.
Forbes' studies between 1835 and 1854 led to his formulation of the idea that the deep ocean was an azoic zone, where in the ‘abyss’ of the ocean (> 300 fathoms/1,800 feet/0.54 km), “Life is either extinguished or exhibits but a few sparks to mark its lingering presence.”
The “azoic theory” posited that the ocean depths lacked oxygen and hence were sterile. It persisted for many years, even in the face of living organisms dredged up from deep water (e.g., J.C. Ross). In 1860, the surveying ship Bulldog retrieved a sounding line from a depth of > 2 km; it had 13 sea stars on it when it was brought to the surface.
To settle the dispute as to the existence of life in the “abyss”, the Royal Society of London recommended the government provide funds to investigate:
1) Physical conditions of the deep sea in the great ocean basins
2) Chemical composition of seawater at all depths in the ocean
3) Physical and chemical characteristics of the deposits of the sea floor and the nature of their origin
4) Distribution of life at all depths in the sea and on the sea floor
Charles Wyville Thompson, John Murray, and a small staff of scientists conducted studies aboard the HMS Challenger from December 1872 to May 1876.
• Challenger was the first major voyage conducted exclusively for the purpose of
investigating the nature of the oceans. It conducted 151 open-water trawls and 360 soundings and dredgings at deep-water stations. It collected nearly 5,000 new species from as deep as 9 km (~ 5.6 miles) and demonstrated the seas were inhabited by life throughout their depth and breadth.
How did early marine ecologists get data?
They collected and compared samples to recognize similarities and differences from place to place.
Who was F.E. Clemonts?
He was the first to use quadrats in terrestrial studies.
Describe the practical limitations of sample-based methods of surveying the marine environment such as the use of benthic dredges and grab samplers.
A major limitation of the early dredge was that it scooped up organisms from an indeterminate area of the bottom. It could not be used to quantitatively examine local or small-scale distributions. Dredging is basically a blind grabbing of a portion of the unseen ocean bottom, and it yields little information on community structure other than simply what organisms.
are there.
Who is credited with refining the concept of benthic communities as “statistical” units? What other contributions did this person make to the young field of marine ecology?
Danish biologist C.G.J. Petersen is credited with refining the concept of benthic communities as “statistical” units. He developed the bottom-sampling Petersen grab, with jaws like a clam shovel designed to retrieve a measured sample volume of the sea floor and associated organisms. It covered a surface area of 0.1 m2 and ideally enclosed a consistent unit volume of bottom sediments. It allowed the first actual count of the number of organisms in a limited, defined area of ocean bottom. Petersen's sampler had technical faults, particularly in hard or stony sediments.
Petersen's benthic surveys of the Skagerrak-Kattegat and the Baltic seas suggested to him a regular recurrence of groups of a few species. He described eight community types based on the presence of a few large, conspicuous animals. Petersen and Jensen proposed that measuring benthic biomass would allow better estimates of fishery resources than studies focused on the plankton.
Who conducted the first systematic quantitative studies of the water column plankton community? What assumption about the pelagic environment did this individual make and how has this assumption held up to scientific scrutiny over time?
The first systematic quantitative plankton studies were those of German zoologist Victor Hensen. He developed gear and sampling methods for quantitative plankton studies and compared plankton communities regionally and locally. He made the then counterintuitive finding that Arctic seas exhibited higher seasonal peak plankton productivity than ocean tropics. He assumed that if the environment was uniform, the plankton would also be uniformly distributed. He allowed the data collected from a limited number of samples to be extrapolated to much larger areas.
This assumption was vigorously attacked by others, including Haeckel, who deplored Hensen's technique of counting individual organisms. Haeckel argued that the only useful method was to determine the weight and chemical constituents of the plankton samples.
What is “Heuvelman’s thesis”?
Coelacanths were thought to be extinct until discovered alive off of South Africa in 1938. The previously unknown 5m long megamouth shark remained undiscovered until 1976. This supports Heuvelman's thesis that several large and yet unknown fish and mammals still live within the oceans.
List and describe the major habitat subdivisions of the ocean along a coastal to offshore gradient.
1) The immediate coastal or littoral zone, extending from the upper limit of sea water cover (i.e., high intertidal) out to roughly to the starting edge of the continental shelf. Shallowness is a defining feature; affected by tidal and longshore currents and breaking waves and characterized by abundant dissolved oxygen, sunlight, and nutrients. It constitutes less than 1% of the world's oceans, but disproportionately important from a productivity and ecological standpoint. The entire water column down to the sea bed is contained in the photic zone, allowing the existence of photosynthetic intertidal and subtidal benthic vegetation.
2) The continental shelf and overlying neritic waters. Shelf waters are particularly productive. Although shelf seas comprise only ~3% of the ocean's area, they contribute much to total ocean productivity.
• High shelf productivity is typically due to the following reasons.
a) Wind-driven vertical mixing extends down to ~200 m such that neritic waters are well mixed.
b) Shelf waters receive significant nutrient enrichment in the form of terrestrial runoff.
c) Coastal upwelling greatly enhances the productivity of shelf waters in many parts of the world.
* Neritic waters are less likely to be nutrient impoverished compared to oceanic upper water layers.
3) The steep continental slope and deeper, less steep continental rise, and overlying oceanic waters
4) The flat oceanic floor, usually termed the abyssal plain (typically 3,000-6,000 m)
5) The mid-ocean ridges – vast mountain chains rising from the abyssal plain to usually within 2,000 m of the sea surface; also sometimes emergent as mid-oceanic islands
In addition to the coastal to offshore/open water gradient, what two other large-scale environmental gradients do marine organisms appear particularly responsive to?
1) The latitudinal gradient (pole to equator) in intensity and seasonality of solar
radiation
2) The depth gradient from the sea surface down to the abyssal sea bed
Understand both the utility and the dangers of using mathematical models in the study of ecology.
Models are simplified approximations of natural systems, allowing us to determine what we should be measuring in nature. Models generate testable predictions that we can verify or refute through research.
A “modeling the system” approach can produce models that are too complex to be useful. The most useful ecological models are often the simplest ones.
Models are abstract representations of nature as it does not have to follow the rules set forth by them. By paying attention to model assumptions, we can pinpoint where nature and the models diverge and help direct ecological investigations
What is a population?
A population is a group of organisms, all of the same species, that live together and reproduce.
List the four basic factors by which populations change size over time
1) Birth (B) causes an increase in population size.
2) Death (D) causes a decrease in population size.
3) Immigration (I) causes an increase in population size.
4) Emigration (E) causes a decrease in population size.
What is the Exponential Growth Model?
Nt+1 = Nt + B - D + I - E
In the exponential population growth model, what two terms are integrated into the term r, the instantaneous rate of increase?
We can let (b – d ) = the constant r, the instantaneous rate of increase. Substituting r into the model yields the differential equation for exponential population growth: dN_dt = rN
When the exponential population growth model is applied to a model population, how does the population respond when r is positive? What about when r is negative? What about when r is 0?
r > 0 when birth rate exceeds death rate; population increases exponentially.
• r < 0 when death rate is greater than birth rate; population declines toward extinction.
• r = 0 when death rate = birth rate.
What is the Projecting Population Size Model?
Nt = N0e^(rt)
What is the Population Doubling Time Model?
tdouble = ln(2)_r
What are the basic assumptions of the population growth model?
1) No I or E — The population is “closed”
2) Constant b and d — an unlimited supply of food, space, and other resources is available to populations.
3) No genetic structure — all individuals have the same r, so there is no genetic variation or variation is constant through time.
4) No age or size structure — There are no differences in b and d among individuals due to their age or body size.
5) Continuous population growth with no time lags.
Why is the exponential growth model referred to as deterministic?
If we know N0 , r, and t, we can project the population size at Nt .
What causes variability such as good and bad years for reproduction within natural populations?
Environmental stochasticity
Demographic
Numerical characteristics of a population
Deme
Local population or interbreeding group within a larger population
Even if r is constant, what causes a population to fluctuate?
Demographic stochasticity
What is K? What types of limiting resources are encompassed in the carrying capacity term K in the logistic growth model?
The logistic growth model is based on the differential exponential growth equation, but we will now include the concept of environmental carrying capacity (K). K represents the maximum population size the environment can support, and encompasses potentially limiting resources such as:
- food availability
- living space
- shelter from the environment/predators
What is the Logistic Growth Model?
dN_dt=rN (1-N_K )
Name the ecologist who first introduced the logistic growth model.
Belgian mathematician P.F. Verhulst.
Under what three model states will a population stop growing under the logistic growth model?
a) r = 0, (births = deaths), or
b) N = 0 (the population has gone to extinction), or
c) N = K (carrying capacity reached)
Under what model state is population growth greatest under the logistic growth model?
N=K_2 (50% of carrying capacity)
Name and describe two types of intraspecific competition discussed. What is intraspecific competition?
1. Exploitation (Scramble) Competition: Individuals in a population are each exploiting a limited resource at a given rate; those most successful at resource uptake grow faster and leave more progeny than competitors.
2. Interference (Contest) Competition: Individuals actively prevent others from utilizing the same resources.
What are the basic assumptions of the logistic model?
Like the exponential model, the logistic model assumes no time lags, migration, genetic variation, or age structure in the population.
• Additional assumptions of basic logistic growth:
1) K must be constant — If carrying capacity is constant logistic growth will take on the characteristic sigmoidal shape.
2) Linear density dependence — Each individual added to the population causes an incremental decrease in the per capita rate of population growth.
Why is there no such thing as a “perfect” life history schedule, i.e., one that simultaneously maximizes both survivorship and fertility/fecundity in all age classes?
1) There are necessary tradeoffs in life history strategies.
- e.g., heavy investment in reproduction means less energy to devote toward maintenance, growth, and resource acquisition (tradeoff between reproduction and survivorship).
- e.g., can produce either many small (poor-surviving) or few large (high survival) offspring (tradeoff between fecundity and offspring survivorship).
2) Life history strategies are constrained by physiological and evolutionary limitations.
- e.g., Large organisms take longer to grow and reach maturity – age of first reproduction may be constrained by body size.
- e.g., The number of eggs/offspring produced may also be constrained by size.
What is “Dollo’s Law”?
General principle stating that evolution is largely irreversible.
Describe the basic features of the adaptive landscape model visualizing the relationship between genotype and fitness. How can the landscape depicted by the model change? Who first proposed this model?
The life history traits of an organism reflect a long evolutionary heritage that may or may not maximize fitness in the current environment.
Sewall Wright's adaptive landscape model: The fitness of a given trait can be thought of as existing within a topographical landscape complete with adaptive peaks and valleys, where valleys show trait values of low fitness and peaks show trait values of high fitness
The landscape changes over time because the environment changes. Formerly adaptive traits may become maladaptive in the new landscape.
Movement between fitness peaks would require crossing valleys.
List the typical traits possessed by classic “r-adapted” and K-adapted” organisms found at opposing ends of the r-K model continuum.
r-selection strategy
In a population maintained at a density such that resources for growth and survival are not limited (in the short term at least), the best reproductive strategy would be to maximize reproductive output.
Traits common to r-selected species include:
1) early, possibly semelparous (aka “spawn and die”) reproduction
2) large r
3) many small offspring with poor survivorship
4) “Type III” survivorship curve
5) small adult body size
K-selection strategy
Best suited for organisms that exist in an environment that is chronically crowded, i.e., resource-limited.
• Traits common to K-selected species include:
1) delayed, iteroparous (“spawn and spawn again”) reproduction
2) small r
3) fewer large offspring with enhanced survivorship
4) “Type I” survivorship curve
5) large adult body size
Semelparity
A life history strategy in which all reproduction is concentrated in a single age.
Iteroparity
Reproduction at more than one age during an organism’s life.
What types of organisms typically exhibit Type I, Type II and Type III survivorship curves?
Type I - Large mammals and humans
Type II - Small mammals and birds
Type III - Marine invertebrates and insects
Life Table
A table summarizing statistics of a population, such as survival and reproduction, broken down by age class.
Why is it difficult to use life tables to effectively predict population change in marine populations in nature?
It is particularly difficult to estimate larval mortality or percent fertilization between pelagic eggs and sperm to get an idea of initial cohort size.
It is also difficult to measure age-specific fecundity in natural or laboratory populations.
What is a metapopulation? What factors link local populations within a metapopulation landscape?
A metapopulation is a group of local populations that are linked by immigration and emigration.
Metapopulation models do not predict population size, but rather population persistence. The only two possibilities for a given population will be either local extinction or local persistence over a defined time frame.
- The metapopulation perspective recognizes that local populations frequently go extinct.
- The appropriate scale for recognizing an equilibrium is the regional or landscape level, which encompasses many connected sites.
- We must sacrifice some details relative to the local populations.
- The metapopulation model describes the fraction of all population sites in a landscape that are occupied.
Comment generally about the level of extinction risk local populations face versus the risk of regional extinction.
Local Extinction: Extinction event in which a single population disappears.
Common at the landscape level of resolution.
Regional Extinction: Extinction event in which all populations in the regional system die out.
The risk of regional extinction is usually much lower than the risk of local extinction.
What is the General Metapopulation Model?
Pn = (1 - pe )^n
What is the Regional Persistence Metapopulation Model?
Px = 1 - (pe)^x
What are the basic assumptions of the metapopulation model?
Homogeneous patches: Population sites do not differ in size, isolation, habitat quality, resource levels, etc.
No spatial structure: How near two patches are to each other does not affect the ability of one patch to foster colonization of another.
No time lags: The continuous differential equation assumes that metapopulation growth rate responds instantly to changes in ƒ, pi, or pe.
Constant pe and pi: These don’t change from one time period to the next.
Regional occurrence (ƒ) affects local colonization (pi) and extinction (pe): Except for basic island-mainland models, metapopulation models assume that the number of occupied sites influences colonization/extinction probabilities.
There is no demographic stochasticity of the metapopulation due to small patch numbers
Describe the basics of the island-mainland and internal colonization model variants of the metapopulation model. Who is credited as the author of the island-mainland model?
A large, stable mainland population would generate a “propagule rain” for a set of islands in the metapopulation. This is a model describing aspects of McArthur and Wilson's (1967) classic theory of island biogeography, in which the fraction of metapopulation sites (“islands”) occupied at equilibrium is a balance between local extinction rates and the probability of immigration from a large “mainland” population.
What is the rescue effect?
The reduction in the probability of extinction that occurs when more population sites are occupied, and hence more individuals are available to boost local population sizes.
What is a “closed population”? Why are closed population models generally ill-suited for describing most marine populations. What life history aspect exhibited by a great many marine organisms ensures the populations do not function as closed populations?
A population with no immigration nor emigration. The assumption of a closed population is mathematically convenient, but usually not ecologically realistic
Briefly describe the research of Roughgarden) and Sanford supporting the contention that recruitment variation can affect local population processes in rocky shore communities. In each study, what were the key factors driving observed population patterns?
On the central CA coast, heavy annual barnacle recruitment elicits heavy starfish predation pressure in response, leading to a rapid decline in barnacle numbers and highly unstable, oscillating local populations that never reach a stable age distribution. When barnacle recruitment is low, starfish predation is low, leading to stable, low-density populations. In habitats with predictably low recruitment, stable age distributions and stable population densities occur. Here, recruitment intensity and post-settlement predation drive observed patterns.
A relationship between barnacle recruitment intensity and local population stability occurs in the absence of predators in Narragansett Bay. At sites with low barnacle recruitment, low settlement rates lead to mixed age classes, small annual population oscillations, and usually less than 100% of available space colonized by barnacles. In contrast, at sites with predictable heavy annual recruitment, crowding usually results in intense competition for space, heavy mortality, and dramatic annual population oscillations. Here, recruitment intensity, post-settlement competition, and environmental variability drive observed patterns.
What roles do settlement density and interspecific competition play in the research described by Gaines and Roughgarden?
In southern New England, the star barnacle (Chthamalus sp.) lives at high-intertidal levels because it is competitively displaced by the northern acorn barnacle (Semibalanus sp.) in the mid-intertidal.
The blue mussel (Mytilus edulis) competitively displaces Semibalanus in the low-intertidal. These patterns result from intense competition for space.
Where recruitment is low and space is not limiting, competition is generally reduced and the above zonation pattern is expected to be less distinct.
What primary factor determines the survival of organisms in the high intertidal in the southern New England rocky shore environment according to the work of Bertness and Leonard?
Solitary organisms do not enjoy group benefit and must live lower in the intertidal.
What primary factor determines the rate of colonization and patch recovery after disturbance opens up habitat space in the saltmarsh according to the work of Bertness and Shumway?
Plants colonizing these bare spaces may need to recruit in high densities in order to buffer each other from heat and osmotic stress. At low recruit densities, bare patches may close slowly, or not at all
Define the terms pelagic and benthic and give two examples of organisms inhabiting these environments.
Pelagic: Occupy the water mass. Includes sea turtles and sharks.
Benthic: Occupy the bottom sediments or rocky substrates. Includes mangroves and catfish
Pleuston
Organisms straddle the air-water interface.
Give an example of a marine animal that occupies the pleuston.
Water striders
What is the key difference between organisms classified as plankton and those classified as nekton?
Plankton are those water column species which are weak swimmers, and distributed largely at the mercy of the currents. Nektons are those usually larger species which can swim more powerfully.
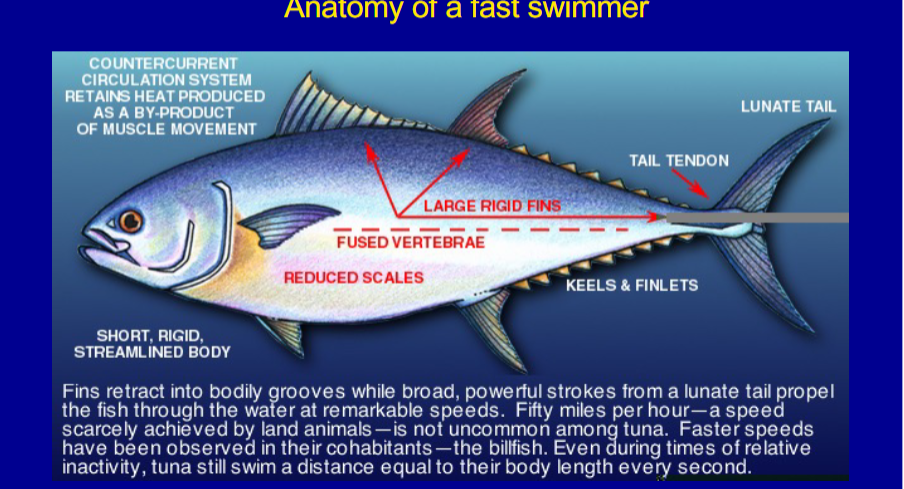
Be familiar with the various adaptions that make a fast-swimming animal like a tuna well-suited to its environment.
Know the various size designations of planktonic organisms, the size ranges encompassed by each class, and the types of organisms principally comprising each.
(size range) (designation) (principal components)
< 0.2 μm femtoplankton bacteria
0.2–2 μm picoplankton bacteria/protists
2–20 μm nanoplankton protists
20–200 μm microplankton protists
200–2,000 μm macroplankton animals
> 2,000 μm megaplankton animal
True or False? The smallest planktonic organisms classed as ultraplankton make up only a small fraction of the total planktonic biomass of most marine water column communities.
False
What key differences distinguish phytoplankton and zooplankton?
Phytoplankton: Photosynthetic plankton and are usually of the nano- and microplankton (also some smaller).
2. Zooplankton: Heterotrophic plankton and are micro-, macro-, and megaplankton.
If we opt to classify plankton based on the duration of their planktonic stage, what are the two general categories we use and how do they differ from each other?
Holoplankton species are permanently planktonic organisms.
Meroplankton species occur as larval stages in the plankton but leave the water column at a later stage in their life history.
Give three reasons why phytoplankton are essentially confined to the smallest plankton size ranges.
1. There is a fundamental need to remain in the photic zone, i.e., the sunlit upper portion of the water column.
2. The intrinsic rate of population growth (r ) is inversely related to weight.
3. Phytoplankton have a requirement for efficiency in nutrient uptake.
List the types of body plan elaborations exhibited by zooplankton to reduce sinking rates or vulnerability to predators.
Zooplankton have similarly evolved body plan elaborations in response to the same environmental challenges:
Gelatinous (low density) tissue.
Presence of (low density) oil droplets.
Replacement of heavy bivalent cations by light monovalent ones in various physiological processes.
Possessing long spines or setae to increase frictional resistance and effective body size.
Describe the common mechanism by which zooplankton with limited powers of locomotion can maintain (more or less) their relative position in the water column, e.g., within a patch of quality food resources.
Describe the ecology of the deep scattering layer. By what mechanism is the timing of vertical migration of the deep scattering layer believed to be synchronized?
What is positive phototaxis? What is negative phototaxis? How might these behaviors affect zooplankton location within the water column?
How do polar plankton vertical migration patterns differ from the general pattern seen in lower latitudes? What is the ecological basis for this alternate migration pattern?
Water Column Primary Production
The photosynthetic fixation of carbon by phytoplankton using water as the hydrogen donor.
CO2 + 2H2O + Light —> CH2O + 02 + H2O
List the direct and indirect factors limiting phytoplankton primary productivity.
Direct limiting factors:
Light, nutrient availability, and grazing
Indirect limiting factors:
Turbulent mixing and seasonal temperature
Leibig's Law of the Minimum
If any single factor exceeds the tolerance level or if any single necessary substance is reduced below the minimum required by a species, that species will become locally eliminated.
Diapause
Resting stages
By what strategy do some herbivorous zooplankton like the copepod Calanus finmarchicus survive seasonal poor feeding conditions in regions characterized by seasonal phytoplankton blooms?
Herbivorous zooplankton of markedly seasonal areas often overwinter in resting stages, and do not begin their annual breeding cycle until they have fed on algae available once the bloom has started.
Do herbivores actually limit phytoplankton production as well as biomass? Explain.
There is no scientific consensus as to the answer. Herbivores often graze down a bloom which had already been curtailed by depletion of nutrients or seasonal decrease in sunlight.
In some situations, grazer numbers track phytoplankton numbers in typical fashion, but at other times, herbivore decline actually precedes phytoplankton decline.
In some areas, herbivores might conceivably overexploit phytoplankton were they not themselves being controlled by predators.
Herbivory is just one of the factors influencing marine photosynthetic populations.
What is the key positive benefit bestowed by grazing zooplankton on the phytoplankton populations upon which they subsist?
In nutrient-poor areas, zooplankton may stimulate as much productivity as they consume; primary productivity would likely cease there if grazers did not regenerate nutrients.
Fronts
Zones of convergence of two water bodies with differing characteristics.
Describe physical and biological/ecological mechanisms by which phytoplankton patchiness (spatial heterogeneity) is set up and maintained.
On a large scale, phytoplankton patchiness is set up by physical processes such as Langmuir circulation and the occurrence of fronts.
On smaller scales, biological mechanisms can lead to similar patchiness:
Phytoplankton reproductive output will tend to remain localized and so magnify any original random unevenness in horizontal distribution.
In patches of high herbivore density, phytoplankton will be grazed down, while in areas of low grazing pressure, phytoplankton biomass is allowed to increase (spatio-temporal mosaic).
True or False? Levels of secondary production in the zooplankton in different oceanic regions in general reflect productivity trends seen in the phytoplankton.
True
Describe two examples of detrital food chains. What is “enriched detritus” and why is it important?
1. Most food webs are extremely complex.
2. In many ecosystems, as much as 90% of the energy flow does not derive directly from living photosynthetic organisms but passes along the detrital food chain.
• e.g., heterotrophic bacteria are consumed by heterotrophic protists and then consumed by small zooplanktonic animals.
• e,g., fecal pellets, dead algal cells, discarded appendicularian houses etc., are colonized by bacteria, protists, and small metazoans, and this enriched detritus is eaten by larger animals.
Give two reasons why the efficiency of trophic transfer in the sea is often higher than the textbook 10% efficiency estimate often cited in terrestrial ecology.
At the phytoplankton-herbivore interface, efficiency may be ~20%. This is partly as a consequence of the greater digestibility of marine photosynthesizers.
Efficiency decreases to between 10-15% further up the food web. Relatively higher transfer/assimilation efficiency also partly due to the predominance of poikilotherms/lack of homeotherms in the ocean.
True or False? Water column bacteria are believed to be the primary living agents responsible for nutrient regeneration in the pelagic environment.
False