MICRO, Theme 1: Introduction to markets and market failure
1/111
There's no tags or description
Looks like no tags are added yet.
Name | Mastery | Learn | Test | Matching | Spaced | Call with Kai |
|---|
No study sessions yet.
112 Terms
what is ceteris paribus
economists need to make assumptions- one key assumption is that events occur with ceteris paribus (all other things equal).
ie. nothing else changes so we can see the effect of one economic variable
economists can’t make scientific experiments so they….
use real life senarios (to act as models of situations)
what is a positive statement
they are objective.
Can be tested as true or false. They can be tested with factual evidence, and can consequently be rejected or accepted. Use’s words such as ‘will’, ‘is’.
eg. higher temperatures will lead to an increase in the demand for sun cream
what is a normative statement
they are subjective/ based on value judgment.
cannot be tested as true or false. they are based on an opinion rather than factual evidence. Use’s words such as ‘should’.
eg. the gov should increase taxes on government.
the role of value judgments
they influence economic decision-making policy; different economists make different judgments from the same data.
economic scarcity problem
there is unlimited wants + finite resources- so resources have to be used optimally.
what is opportunity cost + examples + why it is important
the value of the next best alternative that must be given up when making a decision.
(the value of what you lose when choosing between two things)
eg. might have to choose between hiring new workers or investing in new machine. Cannot do both because of finite resources, so a choice has to be made for where resources are best spent.
used to ensure most efficiant allocation of resources
renewable resource
natural resources whose stock level can be maintained over a period of time.
as long as the rate of consumption is lower than the rate of replenishment (otherwise the stock of the resource will decline over-time).
Renewable resources are sustainable.
eg. water, wind, solar energy, fish
non-renewable resource
resources whose stock level decreases over time as they are consumed.
eg. fossil fuels, coal, oil, gas
Methods such as recycling and finding substitutes, such as wind farms, can reduce the rate of decline of the resource.
what 5 things do PPF’s (production possibility frontiers) show
the maximum productive potential of a economy
opportunity cost
economic growth/decline
efficiant/ inefficiant allocation of resources
possible and unobtainable production
shift of PPF + what is assumed when drawing one
Economic growth- an outward shift, decline in the economy- an inward shift.
origninal curve is drawn assuming;
A fixed amount of resources are used
There is a constant state of technology
what is a PPF when showing the maximum prodcitive potential of a economy
depict the maximum productive potential of a economy, when it is most efficient/ resourceful. when all resource’s (including labour) are fully employed.
what is a PPF when showing opportunity cost
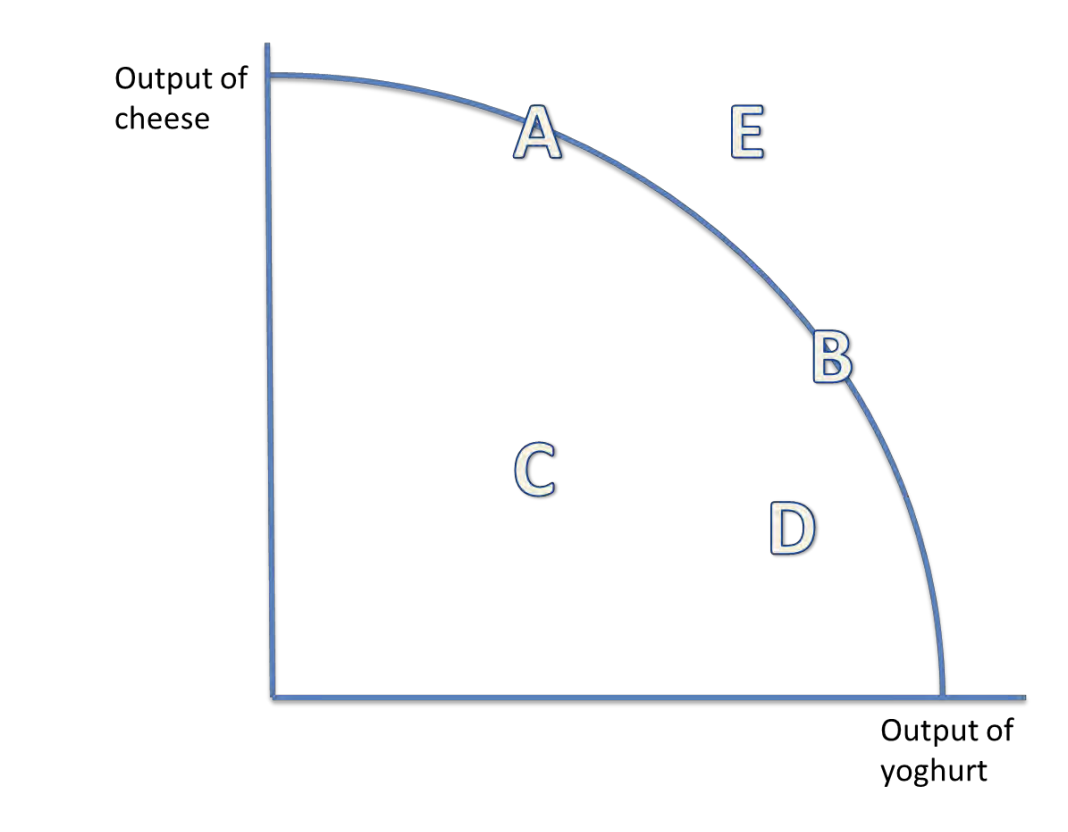
PPF curves can show the opportunity cost of using scarce resources. For example, if the scarce resource is milk, there is a trade-off between producing more cheese or more yoghurt from the milk.
what is a PPF when showing economic growth/decline
Production on the PPF uses resources efficiently (A and B). It is inefficient to produce below the PPF (point C).
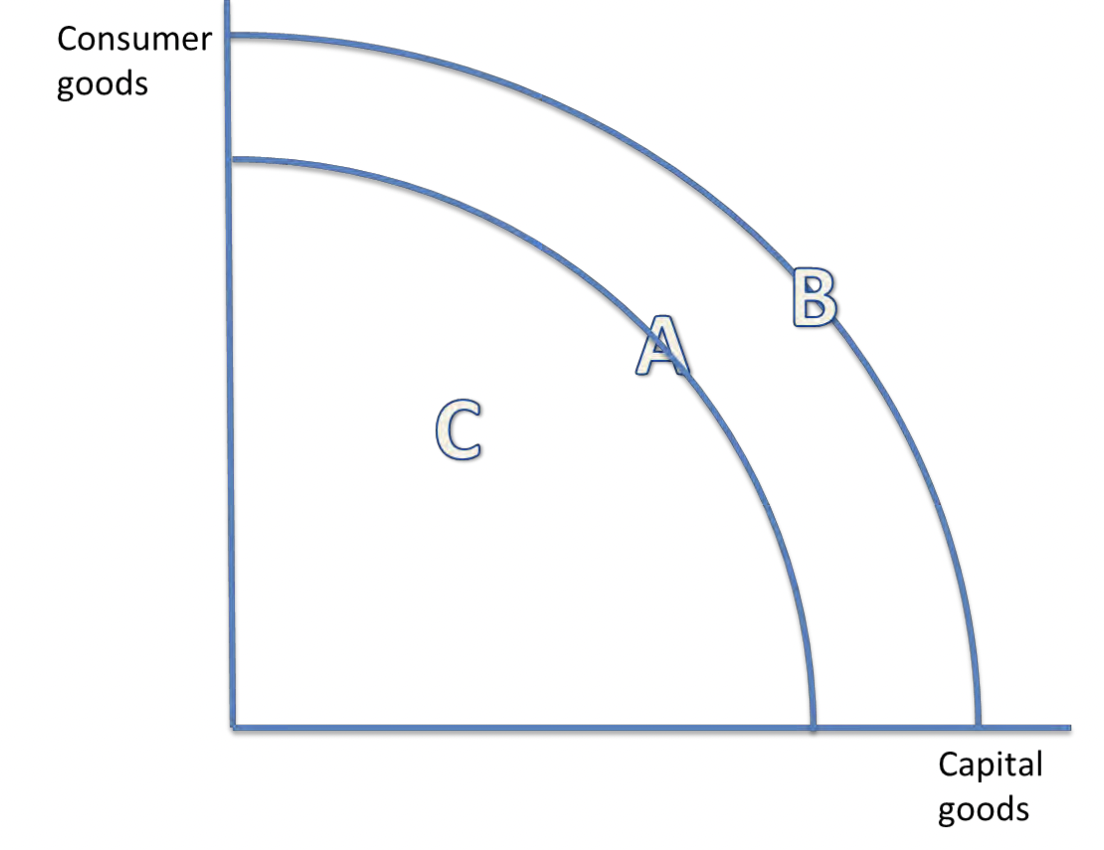
what does a shift outwards (right) on the PPF mean
An increase in the quantity or quality of resources shifts the PPF curve outwards, so the productive potential of the economy increases, and there is economic growth. This can be achieved with the use of supply side policies.
what does a shift inwards (left) mean
a decrease in the quality or quantity of resources in an economy shifts the PPF curve inwards, so the productive potential of the economy decreases.
natural disasters can cause an inward shift.
what does moving along the PFF mean
it uses the same number and state of resources, and shifts production from fewer consumer goods to more capital goods
captial goods definition
goods which can be used to produce other goods, such as machinery
consumer goods definition
goods which cannot be used to produce other goods, such as clothing
what is specialisaiton and who ‘created’ the idea
the process of focusing on a specific task or area of production, while the division of labour breaks larger task into smaller, specialised tasks that can be performed by different workers.
Adam Smith, who showed how, through the division of labour, worker productivity can increase. Firms can then take advantage of increased efficiency and lower average costs of production.
it can be achieved by individuals, businesses or countries.
advantages of specialisation
Higher output and potentially higher quality, since production focuses on what people and businesses are best at.
There could be a greater variety of goods and services produced.
There are more opportunities for economies of scale, so the size of the market increases.
There is more competition and this gives an incentive for firms to lower their costs, which helps to keep prices down.
disadvantages of specialisation
Work becomes repetitive, which could lower the motivation of workers, potentially affecting quality and productivity. Workers could become dissatisfied.
There could be more structural unemployment, since skills might not be transferable, especially because workers have focussed on one task for so long.
By producing a lot of one type of good through specialisation, variety could decrease for consumers.
There could be higher worker turnover (getting new employies all the time) for firms, which means employees become dissatisfied with their jobs and leave regularly because there is low moral as they are constantly training new people + they might feel anxious that their job is easily replaced.
the 4 main functions of money
a medium of exchange
a measure of value
a store of value
a method of deferred payment
explain the function of money as a medium of exchange
before money, transanctions were made with batering. goods and services were traded for other goods and services however they were often not the same value and it only worked if there was a coincidence of wants ie. both parties wanted the good that the other party was offering.
money eliminates this issue
explain the function of money as a measure of value
Money provides a means to measure the relative values of different goods and services.
eg. a piece of jewellery is more valuable than a table because of the relative price, measured by money.
Money also puts a value on labour (higher and lower wages due to what you do)
explain the function of money as a store of value
Money has to hold its value to be used for payment and can be kept for a long time without expiring.
BUT the quantity of goods and services that it can buy fluctuates slightly with the forces of supply and demand.
explain the function of money as a method of deferred payment
Money can allow for DEBTS to be created. People can therefore pay for things without having money in the present and can pay for it later.
(This relies on money storing its value.)
what is a free market economy (describe)
+ examples of famous free market economists
no government intervention
gov’s leave markets to their own devices, so the market forces of supply and demand allocate scarce resources
Economic decisions are taken by private individuals and firms, and private individuals own everything
also known as laissez-faire economies (leaving things to take their course)
In reality, governments usually intervene by implementing laws and public services, such as property rights and national defence
examples
Adam Smith- ‘invisible hand’ of the market which says that through individual self-interest and freedom of production and consumption, the best interest of society are fulfilled. BUT Smith recognised some of the issues with monopoly power that could arise from a free market.
Friedrich Hayek- government intervention makes the market worse. eg. he said that the gov caused the 1930’s crash by keeping interest rates low and encouraging investments
free market economies- who determines what to produce, what drives people to produce, who is it produced for?
What to produce: determined by what the consumer prefers
what drives people to produce: Producers seek profits so produce more
For whom to produce it: whoever has the greatest purchasing power in the economy, and is therefore able to buy the good
advantages of a free economy
Firms are likely to be efficient because they have to provide goods and services demanded by consumers. They are also likely to lower their average costs and make better use of scarce resources. Therefore, overall output of the economy increases.
The bureaucracy from government intervention is avoided.
Some economists might argue the freedom gained from having a free economy leads to more personal freedom.
disadvantages of a free economy
Public goods are not provided in a free market, such as national defence. Merit goods, such as education, are underprovided.
The free market ignores inequality, and tends to benefit those who hold most of the wealth. There are no social security payments for those on low incomes.
There could be monopolies, which could exploit the market by charging higher prices.
There could be the overconsumption of demerit (a good or service whose consumption is considered harmful to the consumer) goods, which have large negative externalities, such as tobacco.
what is a command economy (describe)
+ examples of famous command economists
where the government allocates all of the scarce resources in an economy to where they think there is a greater need. It is also referred to as central planning.
examples
Karl Marx saw the free market as unstable. He saw profits created in the free market as coming from the exploitation of labour, and by not paying workers to cover the value of their work. He argued for the “common ownership of the means of production”. ????
command economies- who determines what to produce, how to produce it, who is it produced for?
What to produce: determined by what the government prefers
How to produce it: governments and their employees
For whom to produce it: who the government prefers
advantages of a command economy
It might be easier to coordinate resources in times of crises, such as wars.
The government can compensate for market failure, by reallocating resources. They might ensure everyone can access basic necessities.
Inequality in society could be reduced, and society might maximise welfare rather than profit.
The abuse of monopoly power could be prevented
disadvantages of a command economy
Governments fail, as do markets, and they may not be fully informed for what to produce.
They may not necessarily meet consumer preferences.
It limits democracy and personal freedom.
what is a mixed economy (describe)
has features of both command and free economies and is the most common economic system today. (The UK is generally considered quite central, whilst the US is slightly more free).
An economy where both the free market mechanism and the government planning process allocate a significant amount of the total resources in the country.
Governments often provide public goods such as street lights, roads and the police, and merit goods, such as healthcare and education.
Each country will have a different amount of control by the government, but it is usually between 40-60%.
mixed economies- who determines what to produce, how to produce it, who is it produced for?
What to produce: determined by both consumer and government preferences
How to produce it: determined by producers making profits and the government
For whom to produce it: both who the government prefers and the purchasing power of private individuals.
government/state role in a mixed economy
create rules: prevent monopolies, pass consumer protection laws to protect consumers from poor quality products/services, protect property rights, ensure safety standards to protect employers and employees.
produce public and merit goods: eg. emergency services + transport
redistribute income: (eg. income from rich→poor) do this through tax + then providing benefits
stabalise economy: prevent extremes of too much or too little demand through fiscal and monetary policy
what are the 3 underlying assumptions of rational economic decision making
consumers aim to maximise utility (making economic decisions that guarantee the highest level of satisfaction for themselves- the consumer)
firms aim to maximise profit (firms are run for owners and shareholders so aim to maximise profit to keep their shareholders happy)
governments aim to maximise social welfare (gov is voted in by the public to work for the public so should make decisions that maximise their happiness).
basis of economic thinking.
BUT *** This is questioned by behavioural economists. also, economics agents don’t always have the knowledge and data to act rationally and in the consumer’s best interest.
demand shifts left + right
rightward shift = increase in demand
leftward shift = decrease in demand
a shift in the demand curve is caused by a change in any of the factors that effect demand
movement along the demand curve (on the same line just up + down)
up = contraction in demand; quantity demanded falls because of a increase in price
down = extension in demand; quantity demanded rises due to a price decrease.
movement along the demand curve is caused by a change in price of the good
factors that cause a shift right in the demand curve
factors that increase demand: PIRATES (G)
population- population rises, more people in the country want the good so demand rises + shifts right.
income- for normal goods; when income increases so does demand because people have a more disposable income so can spend more.
BUT for inferior'/inelastic goods; an increase in income leads to a fall in demand because people switch to more luxurious goods.
related goods price- substitutes; increaase in price of one good leads to increase in demand of the other. eg. an increase in the price of a good leads to an increase in demand for the substitute as people switch to the cheaper option. eg. butter + margerine.
complements; decrease of the price of one good leads to increase in demand of other. eg. if the price of one good decreases (becomes cheaper), demand for the complement will increase. eg. conditioner + shampoo.
advertising- successful advertising = demand increase. if competitor has successful advertising = demand for other firms will fall.
tastes- if something is more fashionable demand will increase. if something is less fashionable demand will decrease.
expectations- if people expect that the price of a good will rise or a shortage of that good then demand will rise. if people expect that the price of a good will fall in the future then demand will fall.
seasons- demand affected by weather. eg. in summer demand for suncream increases.
government legislation- can increase or decrease demand.
***** what is diminishing marginal unity and how does it affect demand
Diminishing marginal utility is the decrease in satisfaction gained from consuming additional units of a good. It causes demand to decrease as consumers are willing to pay less for each additional unit.
eg. three bites of candy are better than two bites, but the twentieth bite does not add much to the experience beyond the nineteenth
what is price elasticity of demand and what is the formula to work it out
measures the responsiveness of quantity demanded given a change in price
% change in quantity demanded/ % change in price
(% change = difference/original x 100)
interpret the numerical values of price elasticity of demand (PED)
unitary elastic: PED=1. quantity demanded changes by exactly the same percentage of price. (reciprocal curve)
relatively elastic: PED>1. quantity demanded changes by a larger percentage than price so demand is relatively responsive. (sloping curve)
relatively inelastic: PED<1. quantity demanded changes by a smaller percentage than price so demand is relatively unresponsive to price. (steep)
perfectly elastic: PED=infinity. change in price means quantity falls to 0 and demand is very responsive to price. (horizontal line)
perfectly inelastic: PED=0. a change in price has no effect on output so demand is completely unresponsive to price. (vertical line).
WHEN CALCULATING IGNORE THE SIGN. -0.4 is relatively inelastic and -4.5 is relatively elastic
factors influencing price elasticity of demand (PED)
SPLAT
Substitutes. people will switch to the substitute when the price of the good increases therefore PED is elastic. if there are no substitutes then PED is inelastic.
Percentage of total expenditure. if a good is a small % of someones expenditure then a price increase wont effect them much so the good is inelastic. vica versa.
Luxury/ necessity. necessities are inelastic because even if the price goes up you still need to buy it
Addictive. inelastic because people will buy it no matter the price.
Time. the longer the time the easier it is to find a alternative product so the PED is more elastic. in short-term goods are inelastic as you might not notice the price change.
what is the significance of price elasticities of demand (PED) in terms of the imposition of indirect taxes and subsidies
PED + PES determine the effects of the imposition of indirect taxes and subsidies.
the more elastic the demand curve, the lower the incidence of tax on the consumer (tax will only lead to a small increase in price and the supplier will cover most the cost of the tax).
when demand is inelastic, the tax will mainly be passed onto the consumer. bc consumers are relatively unresponsive to the price of the good, the quantity demanded will not fall so the tax will be ineffective at reducing output. also means higher tax revenue for government.
THE MORE INELASTIC THE DEMAND CURVE, THE HIGHER THE TAX REVENUE FOR THE GOV.
what is price elasticity of income (YED) and what is the formula to work it out
measures the responsiveness of the quantity demanded to changes in consumer income
% change in quantity demanded/ % change in income
(% change = difference/original x 100)
interpret the numerical values of price elasticity of income (YED) + graphs
if positive number → normal good (meaning if income increases, demand increases)
if >1, elastic, so normal luxury good (as incomes increase, demand for the good increases, proportionally more than the increase in incomes).
if <1, inelastic, so normal necessity (as incomes increase, demand for the good increases, but proportionally less than the increase in incomes).
on graph, D lines sloping upwards (elastic more horizontal, inelastic more vertical).
if negative number → inferior good (meaning if income increases, demand decreases)
if >1, elastic, (as incomes increase, demand decreases proportionally more than the increase in income).
if <1, inelastic (as incomes increase, demand decreases but proportionally less than the increase in incomes).
on graph, D lines sloping downwards (elastic more horizontal, inelastic more vertical).
0 = perfectly income inelastic, there is no relationship.
graph axis: Y= income. X= qty demanded.
what is cross elasticity of demand (XED) and what is the formula to work it out
measures the responsiveness of the quantity demanded of one good/service given a change in the price of another
% change in quantity demanded of good A/ % change in price of good B
(% change = difference/original x 100)
interpret the numerical values of cross elasticity of demand (XED) + graphs
if positive number → substitutes
if >1, price elastic, strongly related goods (as price of one increases, demand for other increases, proportionally more than the increase in price).
if <1, price inelastic, weakly related (as price of one good increases, demand for other increases, but proportionally less than the increase in price).
on graph, D lines sloping upwards bc positive (elastic more horizontal, inelastic more vertical).
if negative number → complements
if >1, price elastic, (as price of one good increases, demand for other decreases proportionally more than the increase in price).
if <1, price inelastic (as price for one good increases, demand for other decreases but proportionally less than the increase in price).
on graph, D lines sloping downwards bc negative (elastic more horizontal, inelastic more vertical).
0 = perfectly income inelastic, there is no relationship, unrelated goods.
axis of graphs: Y = price of good A. X = qty demanded of good B
supply shifts left + right
rightward shift = increase in supply
leftward shift = decrease in supply
a shift of the supply curve is caused by a change in any factors which affect supply
movement along the supply curve (on the same line just up + down)
up = an extension in supply. the quantity supplied rises due to to an increase in price.
down = contraction in supply. the quantity supplied falls because of a decrease in price.
movement along the supply curve is caused by a change in the price of the good.
factors that cause a shift in the supply curve
Costs Of Production. increase in COP means a decrease in supply and shift left (bc producers are less willing and able to produce). a decrease in COP means a increase in supply and shift right.
PINTS WC
Productivity. increased productivity means more supply so shift right. vice versa.
Indirect tax. increase COP, so shift supply left.
Number of firms. more firms = more supply so shift right.
Technology. increases productivity and lowers production costs so supply shifts right.
Subsidies. receiving a subsidy or a increase in the size of a subsidy will decrease COP, so supply will shift right.
Weather. good weather allows us to supply more, shifting supply right. bad weather means production is less, so supply shifts left.
Costs of production (all other things, eg if price of raw materials increase, COP increases so supply decreases- left shift.
what is joint supply and what is its benefits
where the production of one good automatically produces the other. eg. the production of beef also automatically produces leather.
what is competitive supply
where the production of one good prevents the supply of the other. eg. if a farmer kills his cows then he no longer has a supply of milk.
the alternative products a firm could make with its resources (opp cost lost). goods competing for the same resource
what is price elasticity of supply and what is the formula to work it out
the responsiveness of supply to a change in the price of the good.
% change in quantity supplied/ % change in price
(simple: can a producer respond easily, quickly and without extra cost when there is a increase in demand).
Interpret numerical values of price elasticity of supply (PES)
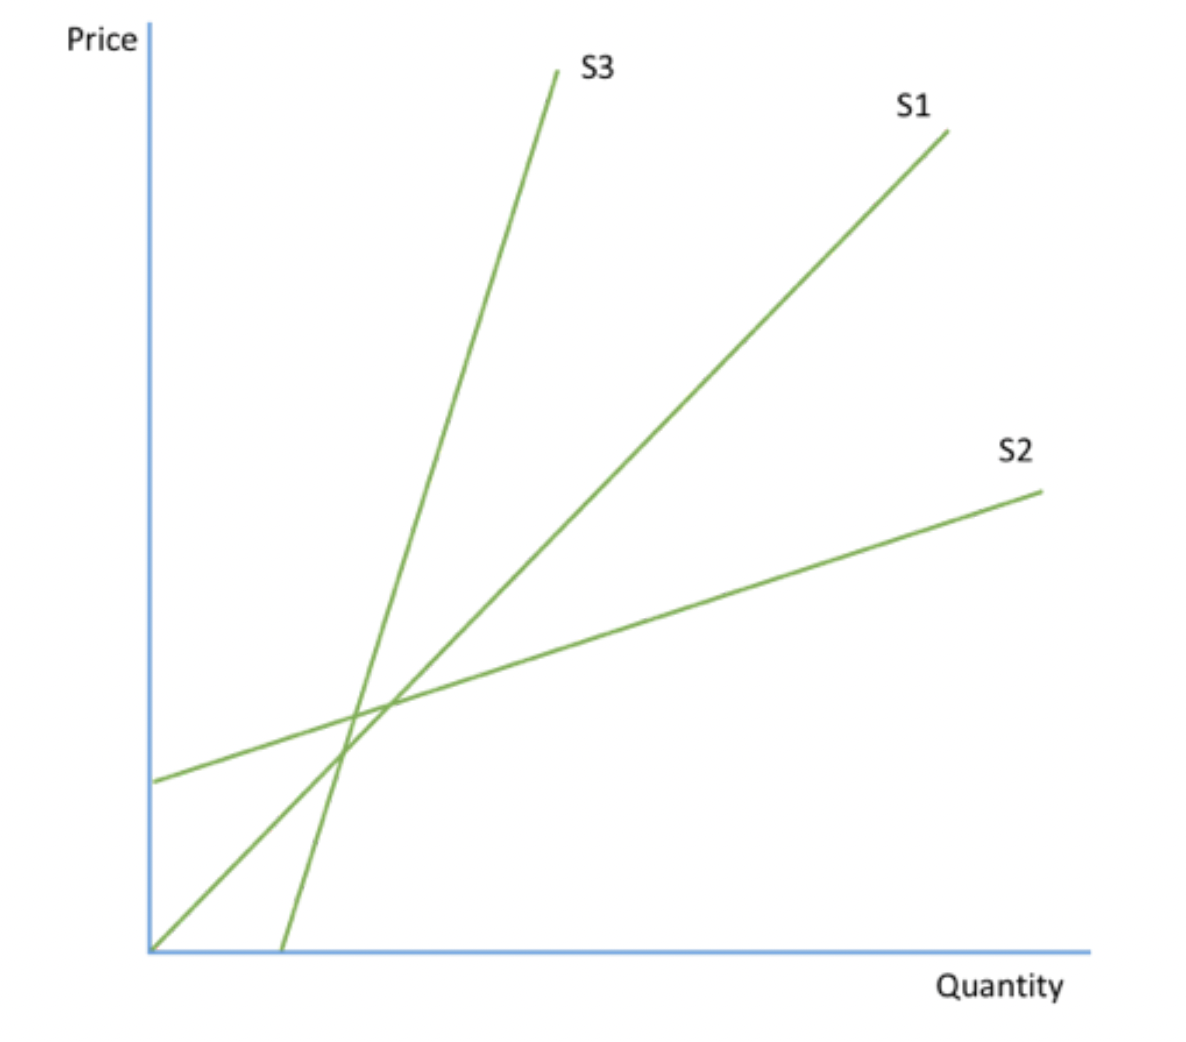
unitary elastic: PES=1. quantity supplied changes by exactly the same percentage of price. (curve that starts in origin).
relatively elastic: PES>1. quantity supplied changes by a larger percentage than price so supply is relatively responsive. (sloping curve)
relatively inelastic: PES<1. quantity supplied changes by a smaller percentage than price so supply is relatively unresponsive to price. (steep)
perfectly elastic: PES=infinity. change in price means quantity supplied falls to 0 and supply is very responsive to price. (horizontal line). eg. app downloads.
perfectly inelastic: PES=0. fixed supply. a change in price has no effect on output so supply is completely unresponsive to price. (vertical line). eg. premier league seats.
diagrams to the right- S1: unitary. S2: relativly elastic. S3: relativly inelastic.
factors influencing price elasticity of supply (PES)
SATS
stocks: if the business has a stockpile then they can use them up and supply will become elastic.
availability of substitutes: if a good has lots of producer substitutes (machines, reallocation of workers) then it is elastic.
time: IMMEDIATE TERM- supplier can only sell they amount they have so supply is perfectly inelastic. LONG TERM- firm can to increase their production levels so good is more elastic. SHORT TERM- can’t increase supply so good is inelastic.
spare production capacity: if a factory has lots of spare capacity (eg. are currently working at low capacity) then they can increase supply without a rise in costs and will quickly respond to the change in demand.
what is equilibrium price and the alternative name for it?
where supply is equal to demand (where they cross), also known as market clearing because there are no unsold goods waiting to be sold (if the price was to high) and there are no customers left wanting the good because there aren’t enough (if the price was to low).
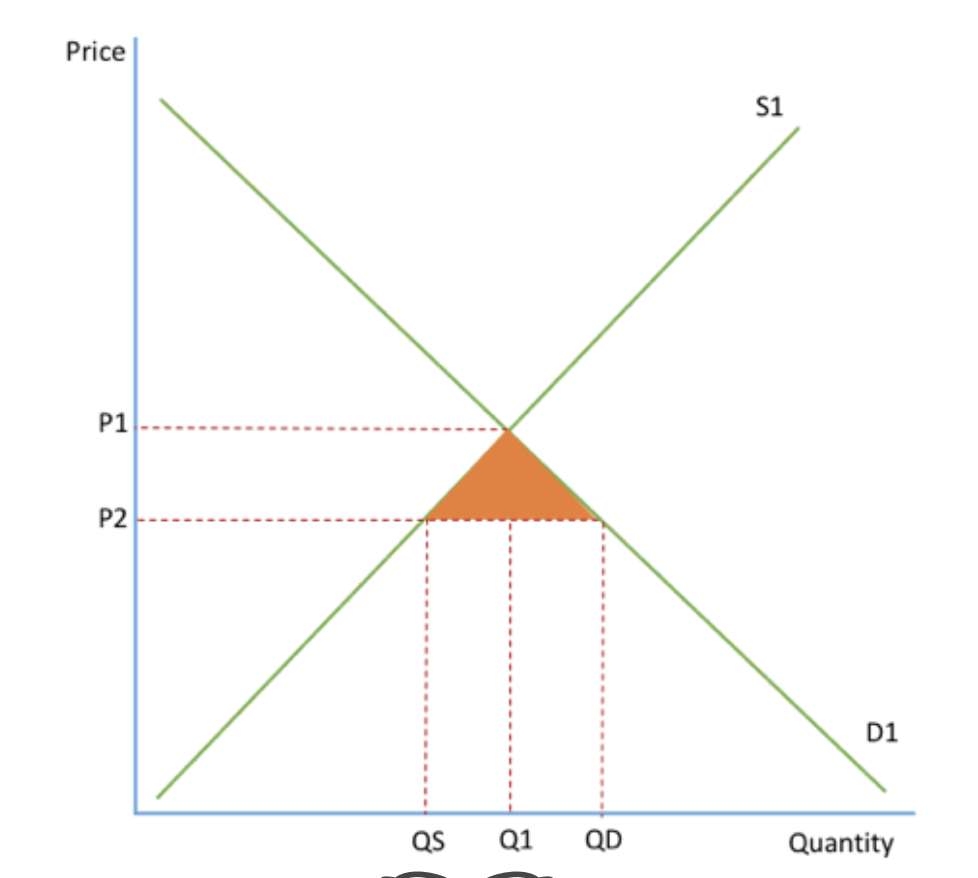
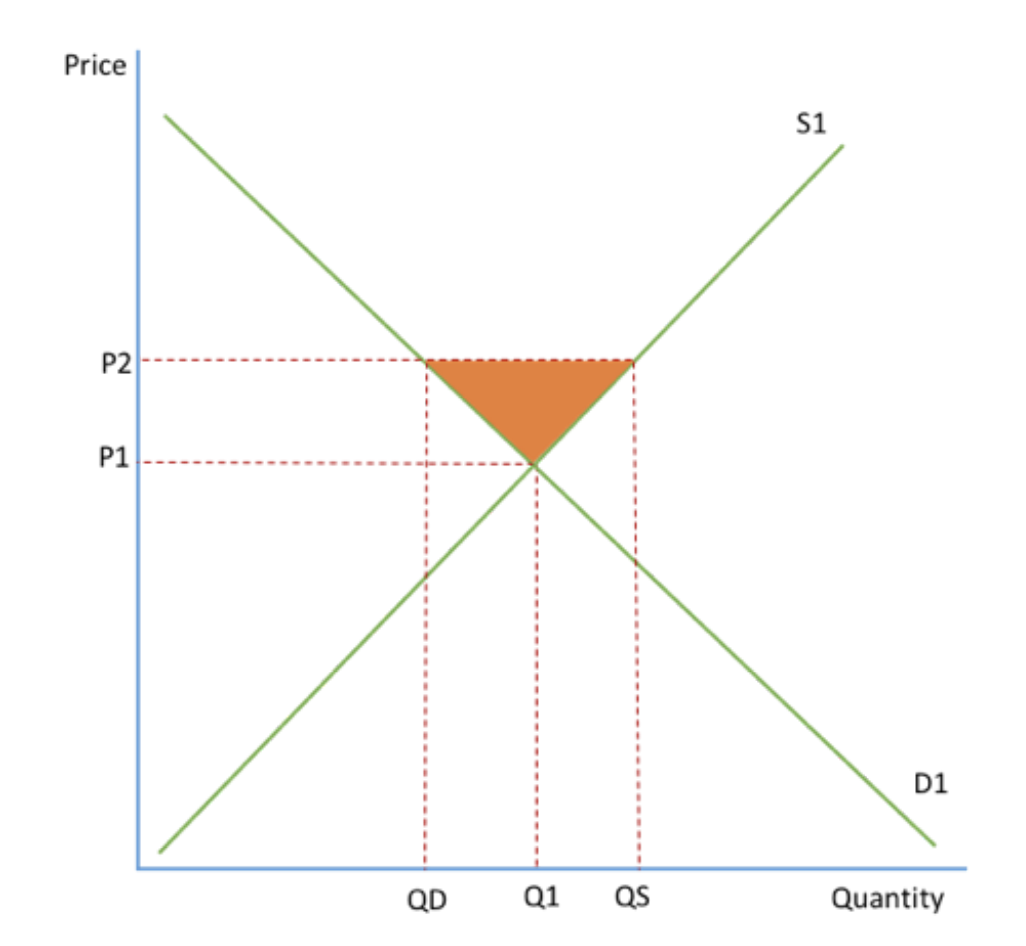
what is excess demand + the diagram and how they recover from the excess demand?
when the price is set two low, below the equilibrium so there is excess demand.
producers are willing to supply QS, but consumers demand QD because the price is low so the orange area is the excess in demand.
as a result there is a shortage in the market
HOW THEY RECOVER- firms know they can put their prices up to P1 and supply increases to Q1. the higher price leads to a contraction in demand so the prices are in equilibrum.
what is excess supply + the diagram and how they recover from the excess supply?
if a price is set above the equilibium (too high) there is excess supply.
at P2 producers are willing to supply QS but comsumers only demand QD so the orange area is the excess supply.
as a result firms have unsold goods.
HOW THEY RECOVER- they put these excess goods on a sale meaning the price falls to P1 and demand increases to Q1. the prices are now in equilibrium.
the function of price mechanism is to ….. resources.
what are the 3 different types + explain them.
the function of price mechanism is to allocate resources. Adam Smith described it as 'the invisible hand’ of the market.
THE RATIONING FUNCTION: price is a way of rationing scarce goods bc when price increases some people can’t afford it so they are rationed and allocated to people who can afford them and to those who value the good highly.
THE SIGNALLING FUNCTION: price acts as a signal where resources should be used and indicated to suppliers + consumers that market conditions have changed and they should change the quanitity bought + sold. when prices rise producers move resources to that area.
THE INCENTIVE FUNCTION: price acts as a incentive for people to work hard. buyers = the more money they have the more they can buy. suppliers = the more goods they produce, the more money they make.
price mechanism in the context of local markets
Prices are determined by supply + demand conditions within the specific area.
weather can influcence price. (hurricane might mean food is scarce so rationing function might happen)
seasons can influcence price (strawberry season means more supply)
local preferences can influcence price
price mechanism in the context of national markets
national policies and regulations such as taxes + trade policies can impact prices
eg. the housing market is influenced by gov policies on interest rates + mortgage regulations.
price mechanism in the context of global markets
involve international trade so influenced by currency exchange rates, global supply chain and geopolitical events.
prices in global markets are interconnected so can impact national + local markets
eg. price of oil affects fuel prices around the world
what is consumer surplus.
the difference between the price that the consumer is willing to pay and the price they actually pay. area between the demand curve and the price.
good for consumers because they are able to buy something for less than they were willing to pay
total satisfaction consumer recieve from buying good is ABQC. They spend PBQC to get this satisfaction, therefore their gain is ABP, the consumer surplus.
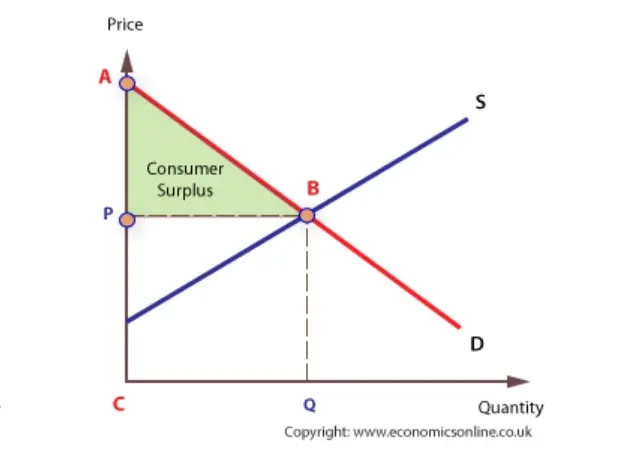
perfectly elastic demand means that consumer surplus is 0.
perfectly inelastic demand means that consumer surplus is infinite.
what is a producer surplus?
the difference between the price the supplier is willing to produce their product at and the price they actually produce it at.
perfectly elastic supply means that producer surplus is 0.
perfectly inelastic supply means that producer surplus is infinite.
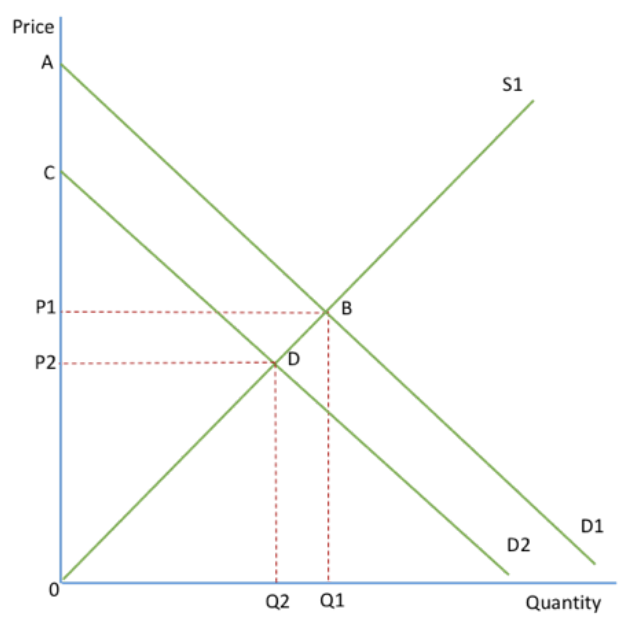
how does a decrease in demand affect consumer and producer surplus’s
A decrease in demand = fall in consumer and producer surplus (both price + output decrease)
Consumer surplus falls from ABP1 to CDP2. Producer surplus falls from P1B0 to P2D0.
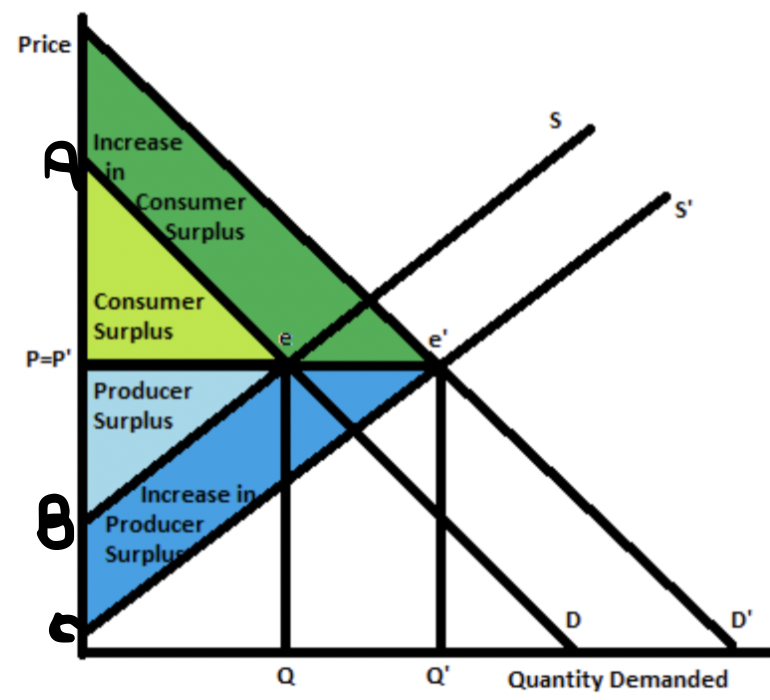
how does a increase in demand affect consumer and producer surplus
A increase in demand = increase consumer and producer surplus.
Consumer surplus goes from AeP to Pricee1P. Producer surplus goes from PeB to Pe1C.
how does a increase/decrease in supply affect consumer and producer surplus
a decrease in supply = fall in consumer + producer surplus.
a increase in supply = increase in consumer + producer surplus.
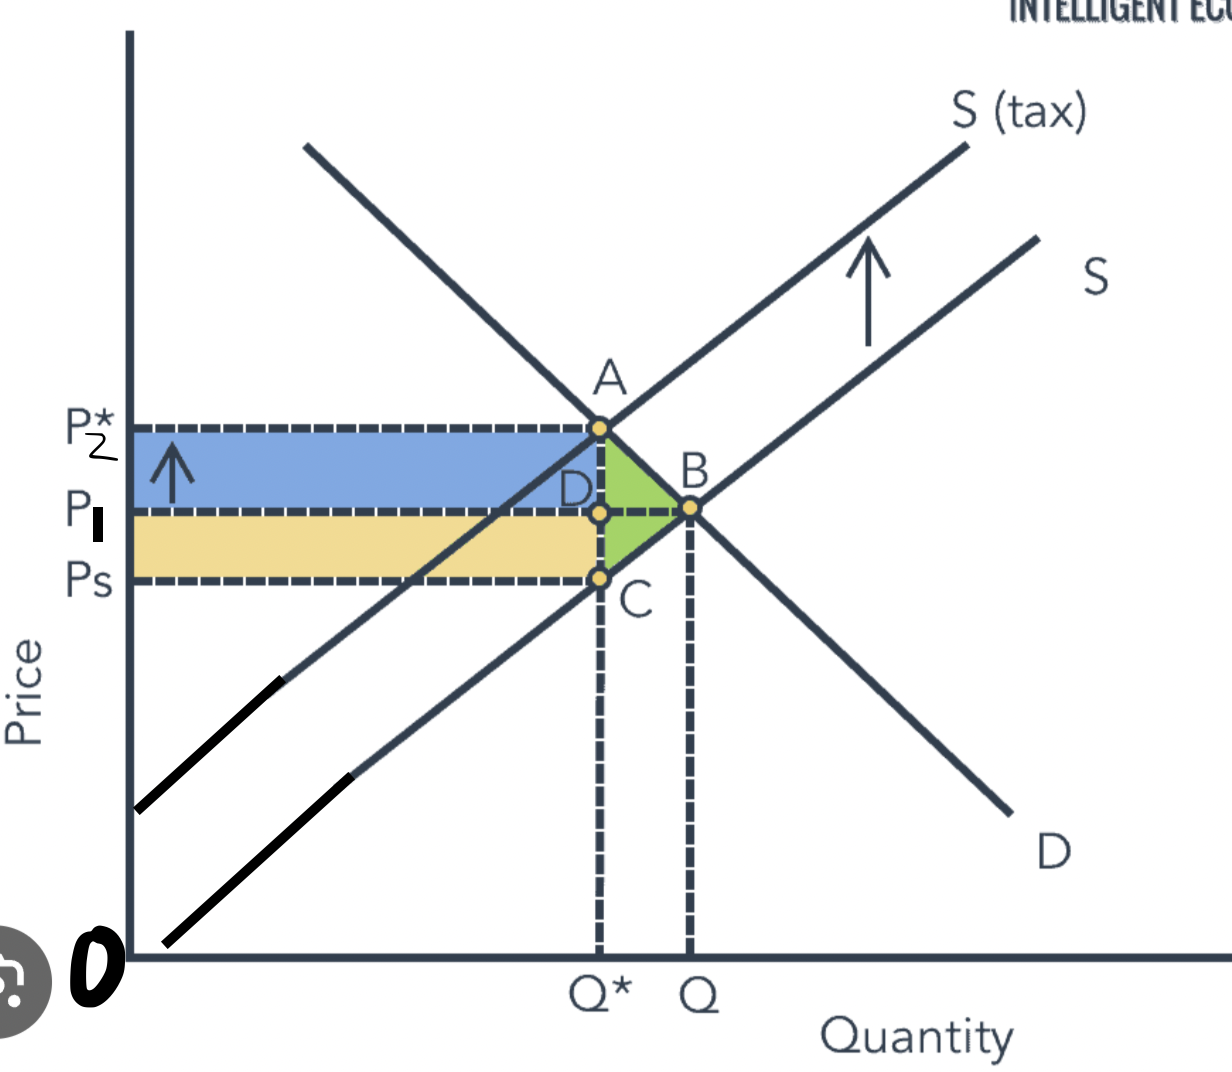
what is indirect tax, examples
what is the gov revenue, consumer burden, producer burden, producer revenue and welfare loss
it’s a tax on expenditure. two types:
ad valorem- tax as a % of price where the tax increases in proportion to the value of the good (a percentage of the good) eg. VAT 20% added on. Shown by two supply lines that get further and further away from each other bc as the price of the good/service increases, the more the Ad valorem tax increases.

specific tax- a tax per unit. eg. alcohol, tobacco, petrol. shown by two parallel supply lines, bc the distance between them shows the tax per unit which is always the same.
gov revenue: P2ACPs (tax per unit A→C, times all the units sold Ps→C)
consumer burden: P2ADP1
producer burden: P1DCPs
producer revenue: PsCQ*Ps (bc you have to minus the gov revenue)
welfare loss: ABC
The size of the tax is the vertical distance between S1+Tax and S1.
do consumers, producers and govs like indirect taxes?
consumers dont like. it gives them consumer burden (as seen in diagram previous flashcard), lowers their quantity of choice, increases price and is regressive → will harm low income families more than high income families
producers dont like. gives them a producer burden, lower revenue, lower quantity supplied so less demand for the goods and therefore might loose their jobs.
govs like. raises revenue, can solve market failiures, eg. reduces consumption of cigs. BUT they don’t like the burden it gives consumers and producers, and the possible black markets it creates.
what is the incidence of indirect tax
(how does elasticity/inelasticiy effect who takes the tax burden)
how does elasticity/ inelasticiy effect who takes the tax burden. (if you draw the diagrams they make more sense!!)
if demand is elastic:
Consumer Burden = lower incidence of tax
Producer Burden = higher ‘‘
gov revenue = lower ‘‘ (bc quantity demanded has fallen)
if perfectly elastic (completely horizontal) , then producers take whole burden.
if demand is inelastic:
consumer burden = higher
producer burden = lower
gov revenue = higher (bc qty demanded has fallen proportionatly less than increase increase in price. more money brought in).
if perfectly inelastic (vertical), consumers take whole burden
if supply is elastic:
consumer burden = higher
producer burden = lower
if perfectly elastic = all consumer burden
if supply is inelastic:
consumer burden = lower
producer burden = higher
if perfectly inelastic = all producer burden
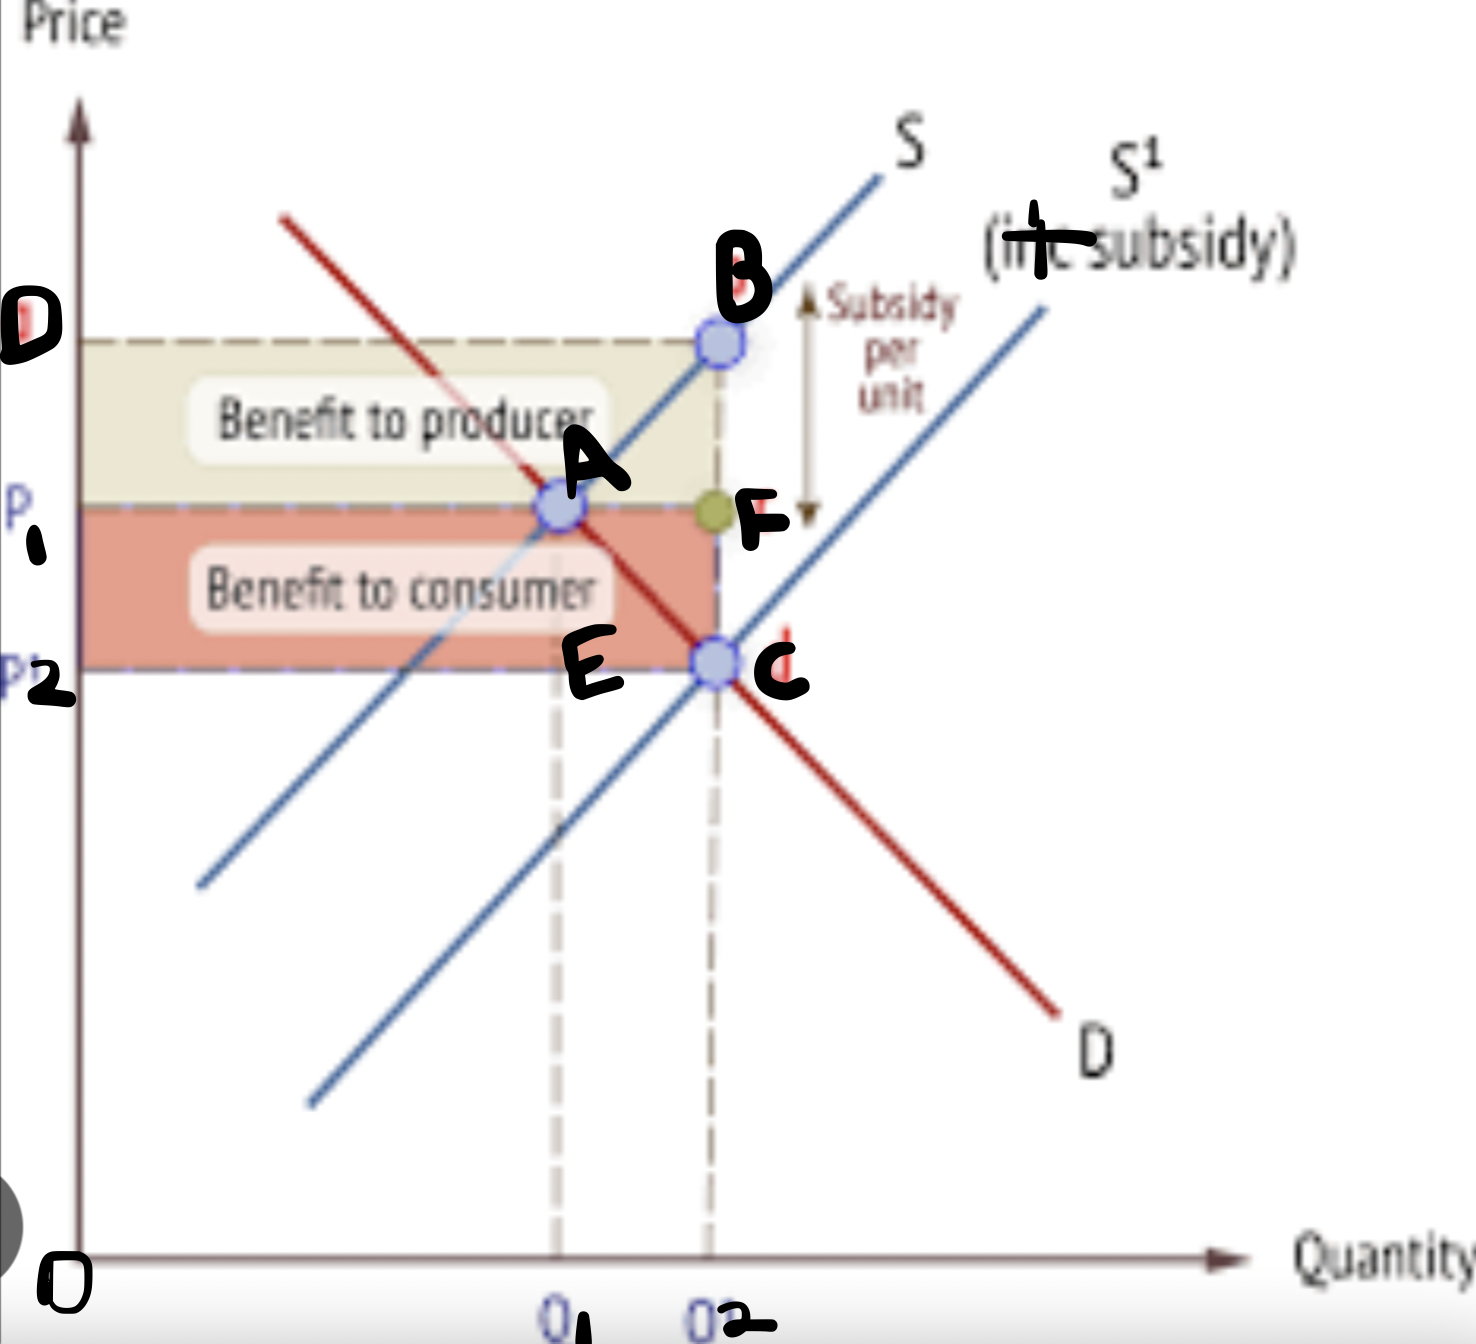
what is a subsidy?
financial assistance or a payment from the government to lower the costs of production for industries or certain businesses and encourage them to produce more.
aim → solve market failiures, to make goods more affordable for low income families
Lower costs of production, so increase supply and shift S curve right. Reduce price (P1→P2), increase quantity (Q1→Q2)
gov cost = P2CBD
producer benefit = DBFP1 (revenue = DBQ2O)
consumer benefit = P1FCP2 (savings = P1AEP2)
welfare loss = ABC
do consumers, producers and govs like subsidies?
consumers like. prices lower, consumer surplus increases BUT they have to think how is the subsidy funded, will taxes increase of spending cuts be made to public goods
producers like. huge revenue increase. can increase quantity.
govs like. they solve market faliures, help low income families afford more BUT expensive
3 reasons why consumers may not behave rationally…
influence of other peoples behaviour
influenced by social norms, people buy things to ‘fit in’ or because everyone else has it. ‘hearding behaviour’ when a indervidual copies the actions of a large group. eg. the stock market. this causes huge stock market bubbles.
influence of habitual behaviour
habits create a barrier to decision making since they limit or prevent consumers considering an alternative. eg. addicitions, people continue to buy drugs/alcohol even though they know they should stop.
consumer weakness at computation (maths)
many consumers aren’t willing to make comparisons between prices so they buy more expensive goods eg. they assume multipacks are cheaper but this is not always the case.
what is market failure and what are the three types?
Market failure occurs when the market fails to allocate scarce resources efficiently, causing a loss in social welfare.
externalities. the cost or benefit incurred by a third party not involved in the economic activity eg. cars and cigarettes have negative externalities, healthcare and education have positive externalities.
under-provision of public goods. public goods are under-provided by the private sector due to the free-rider problem eg. streetlights.
Information gaps. economic agents do not always make rational decisions bc they don’t know the full costs and benefits of every decision so resources aren’t allocated to maximise welfare.
what are private costs/benefits
the costs/benefits to the indervidual participating in the economic activity
what are social costs/benefits
the costs/benefits of the activity to society as a whole
what are external costs/benefits
the cost/benefit incurred by a third party not involved in the economic activity
what is a merit good/ demerit good
MERIT- a good with external benefits where the benefit to society is greater than the benefit to the individual.
DEMERIT- a good with external costs where the cost to society is greater than the cost to the individual.
what is a marginal cost/benefit. what is a private marginal benefit, marginal social benefit and what is a marginal private cost, marginal social cost. EXAMPLES
the extra cost/benefit of producing/consuming one extra unit of the good.
MPB (marginal private benefit) is the extra satisfaction gained by the individual from consuming one more of a good.
MSB is the extra gain to society from the consumption of one more good.
MPC is the extra cost to the indervidual from producing one more of the good.
MSC is the extra cost to society from the production of one more good.
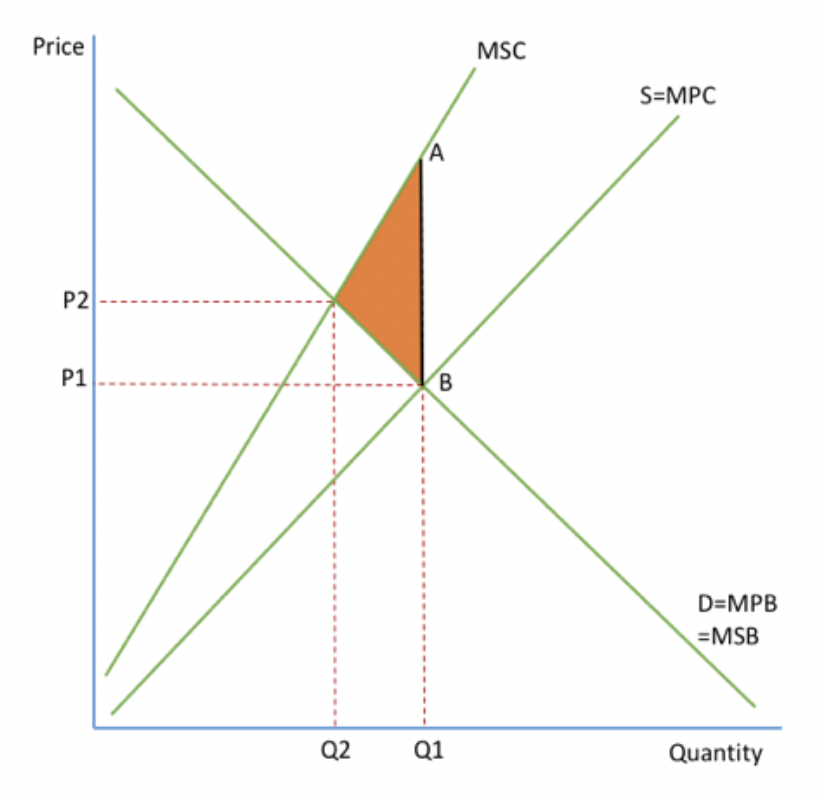
explain negative production externalities and draw the diagram. where is the loss of welfare? where should the economy produce? give examples of negative production externalilties.
costs to 3rd parties as a result of actions of producers
eg. air pollution (local residence are 3rd parties), noise pollution from airplanes (locals are 3rd parties)
production = so cost curve will change (mpb=msb=supply)
MSC > MPC
when the market is left to freely operate it will ignore the external costs involved in producing a good. it will produce where MPB=MPC, the market equilibrium (Q1,P1).
At Q1 the costs (MSC) to society are higher than the benefits (MSB) resulting in the loss of welfare (shaded area).
The economy should produce where MSB=MSC, the socially optimal position (Q2P2)
misallocation of resources, overproduction/consumption, price is too low.
explain positive production externalities and draw the diagram. where is the loss of welfare? where should the economy produce? give examples of positive production externalilties.
benefits to 3rd party as a result of actions of producers.
eg. work training schemes (young people=3rd party)
production = so cost curve will change (mpb=msb=supply)
MPC>MSC
missallocation of resources, underconsumption/production
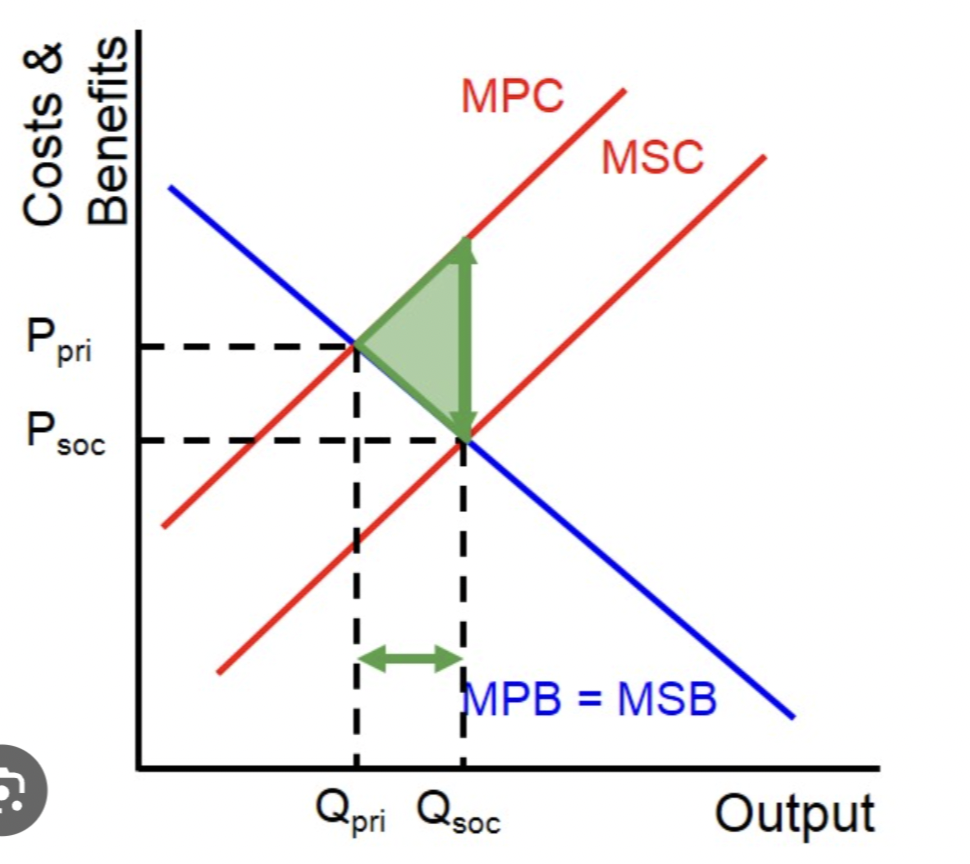
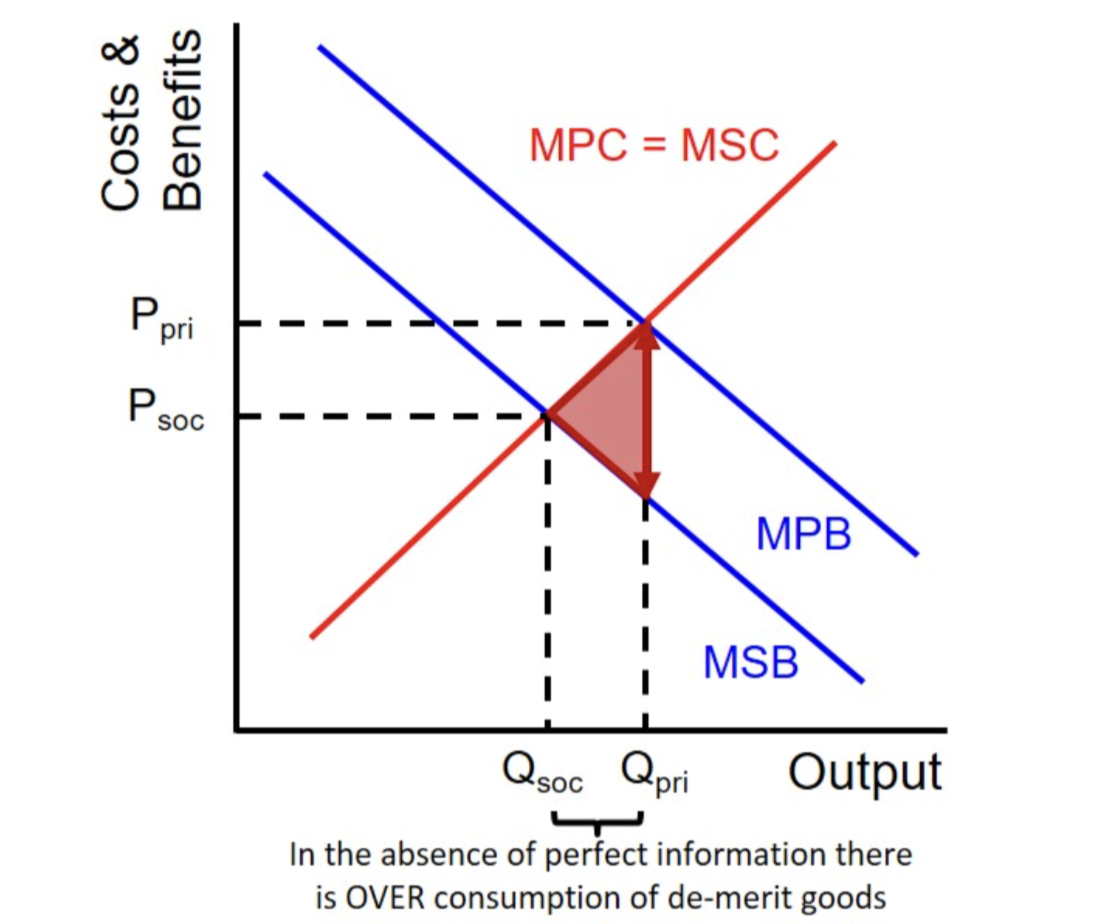
explain negative consumption externalities and draw the diagram. where is the loss of welfare? where should the economy produce? give examples of negative consumption externalilties.
costs to 3rd parties as a result of actions of consumers eg. smoking (bypasses that inhale smoke are 3rd parties), excessive alcohol drinking (healthcare system is the 3rd party)
consumption = so benefit curve will change (demand)
MPB > MSB
when market is left to freely allocate, it will consume where MPB=MSB, the market equilibrium (Q1,P1)
economy should produce where MSB=MSC
there is a misallocation of resources, leads to overconsumption/production
welfare loss triangle (points to MS)
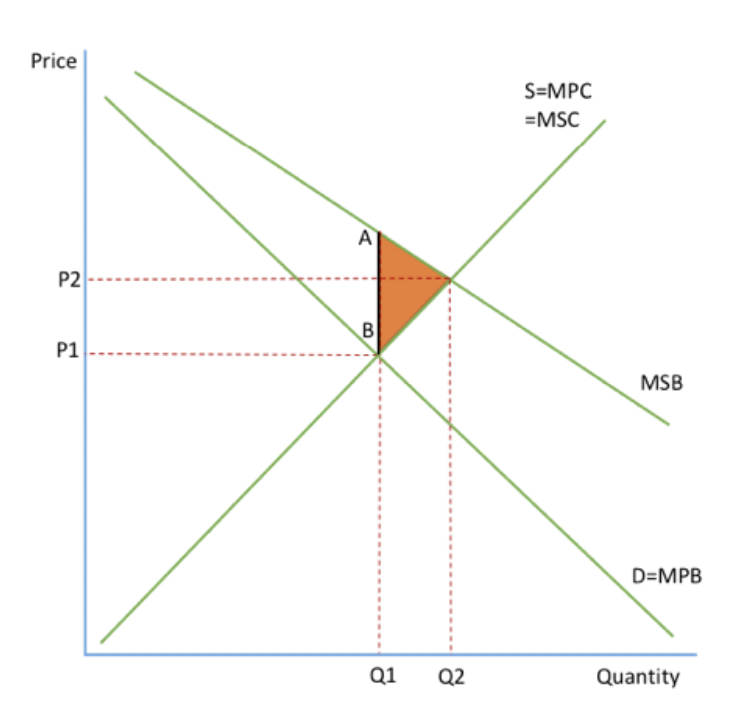
explain positive consumption externalities and draw the diagram. where is the loss of welfare? where should the economy produce? give examples of positive consumption externalilties.
benefits to 3rd party as a result of actions of consumers
eg. vaccinations, education, healthcare
consumption = so benefit curve will change (demand)
MSB>MPB
the market left to its own devices will produce where MPB=MPC and will not consider the benefits to society so will produce at QP1. if it considers benefits it will produce where MSC=MSB (Q2P2).
the failure of the market to allocate the resources has led to underproduction of Q1-Q2. this leads to welfare loss (shaded area)
misallocation of resources, underconsumption/production
5 ways can government intervene to ensure the market considers the external costs and benefits
indirect taxes and subsidies- taxes put on goods w negative externalities. subsidies on goods w positive externalities. this internalises the externalities. eg. highly tax cigarettes.
trade pollution permits: allows firms to produce up to a certain amount of pollutions, they can buy permits or sell them so it gives them the choice + reduces the total level of pollution.
state provision of public goods: free rider problem says they will be underprovided by free market so gov can provide the good through taxation. eg. they do it for education + healthcare
provision of information: gov can provide information to the externalities with information gaps to allow people to make informed decisions.
regulation: can limit consumption of goods with negative externalities. eg. banning the advertising of smoking or regulatory bodies such as OFGEN for energy.
what are public goods; the 2 key characteristics + examples of public goods.
a product or service that society can consume freely and it benefits society.
key charateristics:
non rivalry: one person’s use of the good doesn’t stop someone else from using it
non-excludable: you cannot stop someone/ a group from accessing the good
EXAMPLE: streetlights. you can’t prevent someone from using it and their use doesn’t prevent someone else from using it and seeing the light.
what is the problem with public goods- why might they not be provided by the private sector?
free rider problem. → people are benefiting from resources, goods, or services without paying for it, if there are too many free riders, the resources, goods, or services may be over provided.
private sector producers will not provide public goods because they cannot be sure of making a profit due to the non-excludability of the goods.
what is symmetric and asymmetric infomation? the difference??
symmetric → when buyers and sellers have access to the same info= perfect information. when both parties have equal knoweldege. eg. stock market.
asymmetric → when one party has superior/ more knoweldge than the other party (usually the seller) and so can take advantage of the others lack of knoweldge, eg. charging them a higher price.
what is imperfect market information? examples.
how might imperfect market information lead to a misallocation of resources?
imperfect info simply means the buyer and seller do not have all the info necessary to make an informed decision. = a information gap.
EXAMPLE- advertising leads to information gaps as it is designed to change the attitues of the buyer to get them to buy the good.
there is a misallocation of resources bc people don’t buy things to maximise their welfare. consumer demand for a good or producer supply for a good might be too high or low. therefore economic agents cannot make rational decision due to the information gap.
examples of information gaps
drugs: users do not see the long term problems
pensions: young people do not see the long term benefits of paying in their pension schemes
financial services: where the suppliers have more information than the consumers so abuse their customers for their own benefit (MORAL ISSUE)
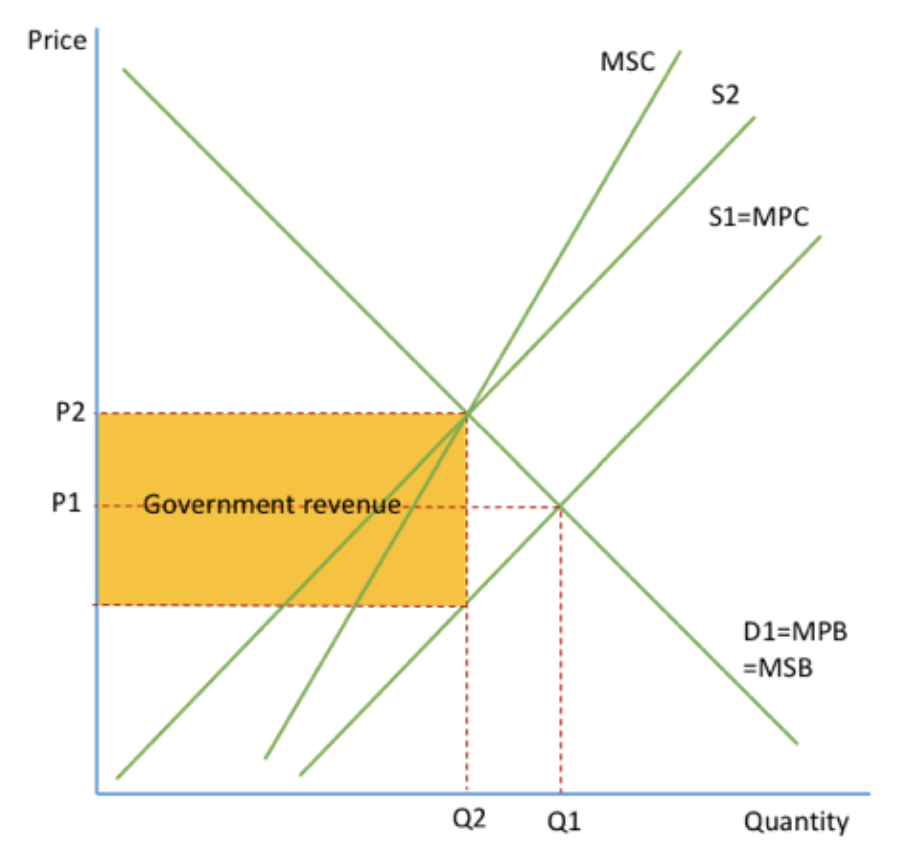
what is the purpose of indirect taxation with reference to market failure + a diagram
CONSUMPTION graph
if the good has a negative externality, the government can introduce indirect taxation to prevent market failure. It will cause a fall in supply and increase the costs so the supply curve will shift left (S1-S2).
the market would produce at P1Q1 where MPC=MPB but the social optimum position is P2Q2 where MSB=MSC.
this tax internalises the externality and social welfare is maximised. this diagram shows specific tax.
advantages + disadvantages of indirect taxation to prevent market faliure.
ADVANTAGES
It internalises the externality- the market now produces at the social equilibrium position + social welfare is MAXIMISED.
government revenue increases which could be used to solve the externality in other ways. help goods become more elastic in the long run
DISADVANTAGES
hard to know the size of the externality so hard to target the tax (the effect depends on where the tax is set + gov suffers from imperfect info when setting tax)
could lead to black market creation
if demand for good is inelastic, tax will be ineffective in reducing output
taxes are politically unpopular so govs are reluctant to use them
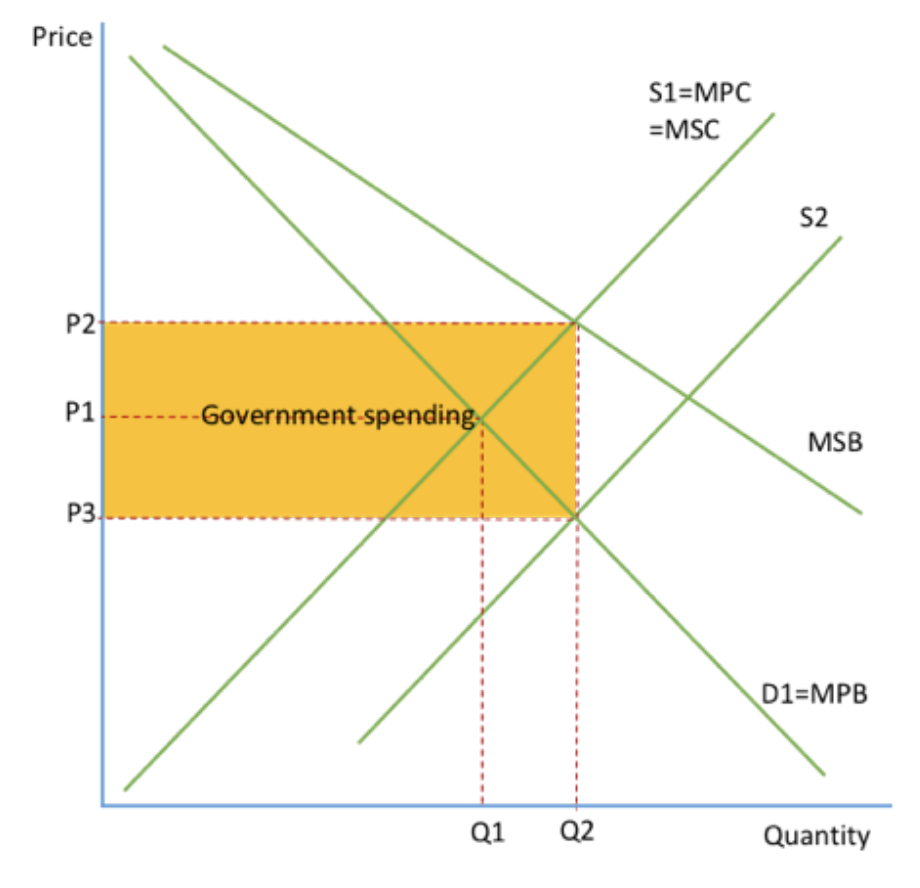
what is the purpose of subsidies with reference to market failure + a diagram
PRODUCTION graph
govs use subsidies to solve positive externalities and/or to fix information gaps.
shifts supply curve right as it will lower production costs. free market would produce at Q1P1 (where MPC=MPB), socially optimum position is P2Q2 (where MSC=MSB). the subsidy introduction means that the equilibrium point is Q2P3, social optimum output.
where social welfare is MAXIMISED as the market produces at the ouput that best allocates resources.
advantages + disadvantages of subsidies to prevent market faliure.
ADVANTAGES
social optimum output, welfare is maximised
other positive impacts such as encouraging small businesses
DISADVANTAGES
high opportunity cost as the gov has to spend A LOT of money
difficult to target since the exact size of the externality is unknown
cause producers to be inefficient, especially if they are in place for a long time
once introduced, subsidies are difficult to remove.
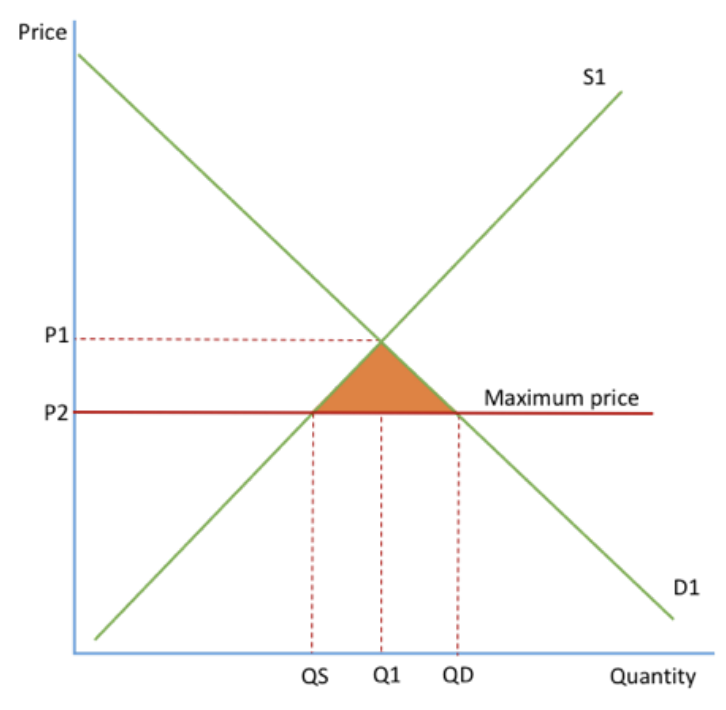
max price definition. for it to have a effect does it need to be above or below the current price equilibrium?
what is the purpose of maximum prices with reference to market failure + a diagram
A max price is a legally imposed price for a good that the suppliers cannot charge above. they’re set on goods with positive externalities. eg. rent, when accomodation prices are too high.
they prevent monopolies from exploiting customers.
for a max price to have a effect it must be set BELOW the current price equilibrium.
on diagram- with the max price, there is excess demand of QS-QD (shaded area)
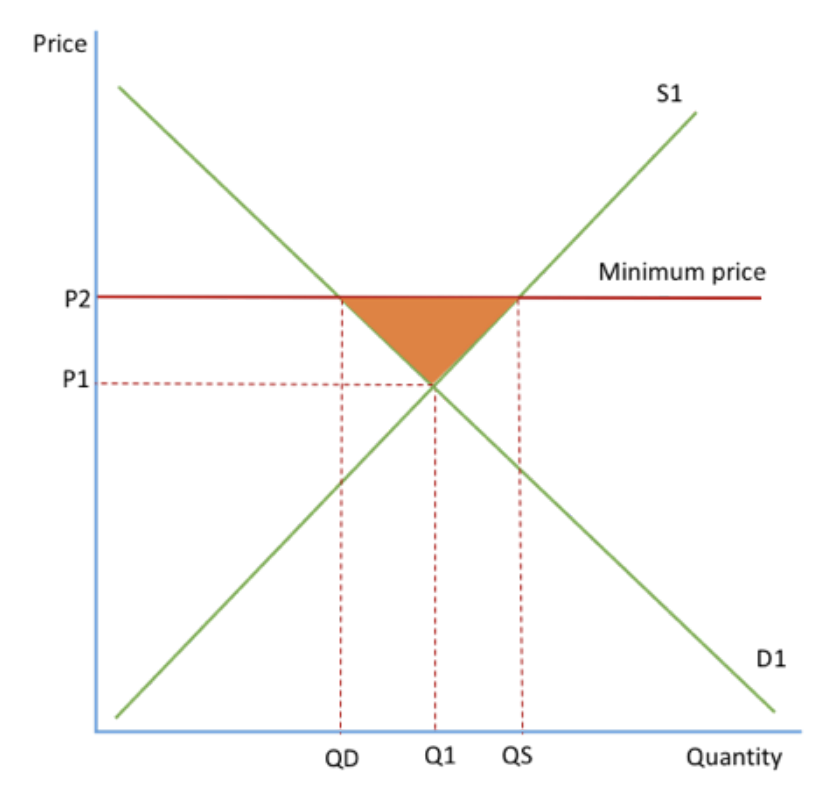
min price definition. for it to have a effect does it need to be above or below the current price equilibrium?
what is the purpose of minimum prices with reference to market failure + a diagram
a min price is a legally imposed price at which the price of the good cannot go below. set on goods w negative externalities so that the price is raised and consumption is discouraged.
for a min price to have a effect it must be set ABOVE the current price equilibrium.
on diagram- with min price set, QD is demanded but QS is supplied so there is excess supply of QS-QD (shaded area).
advantages + disadvantages of max/min prices to prevent market faliure.
ADVANTAGES
can be set where MSB=MSC so some consideration of externalities and so help to increase social welfare.
max price ensures goods are afforable, min price ensures that producers get a fair price BOTH reduce poverty + increase equality
DISADVANTAGES
distortion of price signals which causes excess supply/demand
difficult for gov to know where to set prices
can lead to creation of black markets. max prices may also lead to illegal bribes.
min price is regressive (will cause poor to suffer more)
min price → when demand contracts firms might have to shut down
min price → the goods are probably price inelastic (eg. addictive goods) so the fall of quantity will be proportionatly less than the rise in price so market faliure might not be solved
max price → shortage of goods (contraction of s), it leaves people willing and able to pay without the supply so they will go to black market which might be worse quality
max price → enforcement has to happen, this is expensive
max price → gov might have to subsidies producers bc they are making less revenue (this is expensive for gov)