271 Bus Stats - Ch6 - Lec 9-11 - Central Limit Theorem & Statistical Inference I&II (Module 2)
1/46
There's no tags or description
Looks like no tags are added yet.
Name | Mastery | Learn | Test | Matching | Spaced | Call with Kai |
|---|
No analytics yet
Send a link to your students to track their progress
47 Terms
Do ex Slides 5-7 Lec9
What is x_ in Law of large numbers ?
x_ = (X1 + X2 + … + Xn) / n
with : X1 + X2 + … + Xn independent versions of X (a random variable w expected value (= mean) mu
What is mux_ ? sigmax_ ?
mux_ = mu
sigmax_ = sigma / sqrt(n)
What does that mean in words ?
The expected value (= mean mu) of the average (x_) of n indepdt observations of a random variable is the same as the expected value (= mean mu) of a single observation
The standard deviation of the average (x_) decreases in proportion to 1/sqrt(n)
Thus : what phenomenon can we observe ?
What phenomenon can we observe as the number n of observation gets bigger ?
The Law of Large Numbers :
as n gets bigger, we are more and more likely to observe an average that is close to the expected value (= mean) mu.
Parameter def ? Statistic def ?
°a number describing a characteristic of a population
—> a fixed number, often unknown to us
°a number describing a characteristic of a sample
—> changes depending on which sample we happen to choose : it is a random variable
What is the goal of statistical inference ?
to estimate (infer) the value of an unknown parameter from the observed value of a statistic, and to understand the reliability of the estimate.
Sampling distribution def ?
Population distribution def ?
°Distribution of the values of a statistic for all possible samples of size n
°Distribution of all observations in the population
—> The value of a parameter is a property of the population distribution (expl : pop mean mu)
How do you denote the mean of the sample vs the population ?
x_
mu
x_ is ? what is its mean ? ist stdev ?
x_ is the sample mean of a random sample of size n drawn from this population.
this is a random variable with
mean (=expected value) = mu (the expected value of the sample mean is the population mean (if we tk many samples)
standard deviation = sigma / sqrt(n)
Are these previous fmlas valid with & without replacement ?
sample w replacement : always valid
sample without replacement : fmlas valid when n is much smaller than N
(expl : n < 1/100 of N)
(In pb, assume n is much smaller than N if not said)
What is the CLT ?
°Central Limit Theorem :
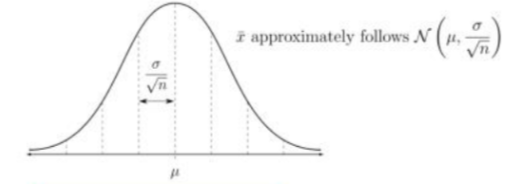
If n is large, the sampling distribution of x_ (the sample mean of a random sample of size n drawn from a large population w mean mu & stdev sigma) is approximately normal : x_ approximately follows N(mu, sigma / (sqrt(n))
When is n “large enough” to apply the Central Limit Theorem ?
It depends to the pop distribution
if the pop itself is normally distributed, CLT can be applied for any value of n
the more skewed the distribution is, the larger the value of n needed to apply the CLT
generelly, n > 25 is enough
For which type does the CLT apply ? (discrete, continuous)
For both discrete and continuous
What is discrete & continuous ?
(Ex) There are 12,000 houses for sale in Quebec City. For all 12,000 houses, the mean house price is $512k, and the standard deviation is $200k. Suppose 100 houses are randomly selected for a market research campaign.
What is the distribution of the sample mean house price for a sample of size 100 ?
approx normal : mean 512k & stdev 20k
(see Slide 23 Lec9 for explanation)
(Ex) Hypokalemia is diagnosed when mean blood potassium levels are low—less than 3.5 millimoles per liter (mmol/L). Assume that your potassium levels, on a particular day, are normally distributed with μ = 3.8 mmol/L and σ = 0.3 mmol/L.
If one measurement is taken, what is the probability that you are misdiagnosed as hypokalemic ?
z = (x-mu) / sigma/sqrt(n) = -1
P(x_<=3.5) = P(z<=-1) = 0.158 = 15.8%
(see Slide 24 Lec9 for more explanation)
(Ex) Hypokalemia is diagnosed when mean blood potassium levels are low—less than 3.5 millimoles per liter (mmol/L). Assume that your potassium levels, on a particular day, are normally distributed with μ = 3.8 mmol/L and σ = 0.3 mmol/L.
If four measurements are taken and averaged, the probability that you are
misdiagnosed as hypokalemic is approximately which of the following?
(see Slide 24 Lec9 for more explanation)
— — LEC 10 — —
What are the goals of inferential statistics ?
2 major goals :
Estimate the true value of a parameter (using a statistic calculated from a sample) and specify our confidence about the estimate (how accurate we expecte the estimate to be)
MLE : Maximum Likelihood Estimate
LSE : Least Square Estimate
Use a statistic calculated from a sample to test a theory (or hypothesis) about the full pop. (We want to determine to what extent the data provides evidence for or against the hypothesis)
If we don’t know sigma pop, what can we use ?
We can safely estimate sigma pop ~= sigma sample
When n (in a sample) is large, how is x_ approximately distributed ?
as N(mu, sigma / sqrt(n))
What are the confidence intervals ?
Expl for a 95% confidence interval ?
+ see q32 Ch6 practice
With confidence of 95%, the true pop sample mean mu is in the interval :
x_ +/- 2(sigma/sqrt(n))
= [x_ - 2(sigma/sqrt(n)) , x_ + 2(sigma/sqrt(n)]
Do expl 1 Slides 9-10 Lec 10
A level C confidence interval for a parameter has 2 parts : .. & .. ?
an interval (calcultaed from the data)
estiamte ± margin of error
a confidence level C (gives the proba that the interval will capture the true param value)
C can be any number btwn 0 & 100
Do ex Slides 12-15 Lec 10
Confidence interval for population mean ? (fmla)
x_ ± z*(sigma/sqrt(n))
What are the conditions of the sample & pop distributino for the confidence interval being correct ?
The interval is exact when
the pop distribution is normal
The interval is approximately correct when
n is large (n>25), i.e. when CLT holds
The interval is not valid if
n<=25 and
the pop is not normal
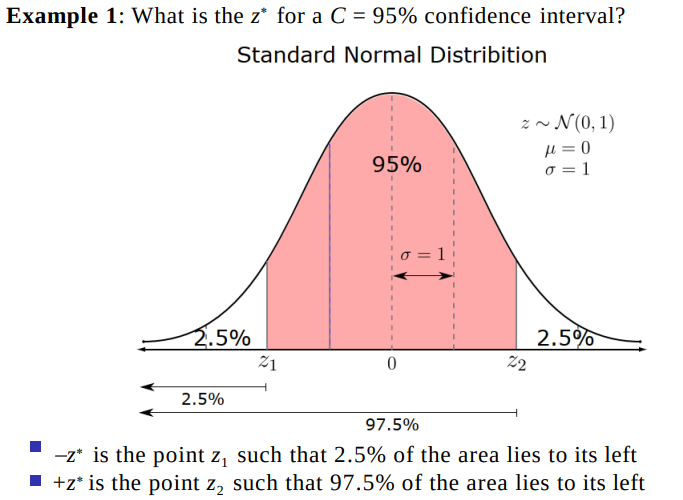
Hod do you calculate z from a z-table ?
We divide by 2 the % outside the confidence interval we want to calculate the z from
W find the corresponding % in the table for the minus & plus
expl : for a 80% CI, 20% restant : 10% on each left sides of the curve, so we look for 0.1000 in the z-tables (plus & minus)
See expl Slides 18-26 Lec 10
Do ex Slide 27 Lec 10
What does the confidence interval and z mean ?
What about small samples ?
If n<= 25, 2 pb :
We cannot assume the the CLT gives a good approximation of the sampling distribution
It is not safe to assume that the sample standard deviation s is close to the pop standard deviation sigma
Or opposite :
if we know that the pop is normally distributed
AND we know the pop stdev
==> evrything’s fine (and we use sigmapop in the flma instead of sigmasample)
— — LEC 11 — —
3 steps in a significance test ?
Choose your null and alternative hypothesis
Observe the data and evaluate the strength of the evidence against the null hypothesis
Decide if the evidence is strong enough to reject the null hypothesis, based on a predetermined standard (‘beyond a reasonable doubt’)
What can be the ccl of a significance test ?
“Fail to Reject” null hypothesis
“Reject” null hypothesis
How are denoted null & alternative hypothesis ?
H0 & Ha
Step 1 ? How to choose hypothesis to test ?
Step 1 : Choose your hypothesis
2 types of tests :
One-sided test
H0: mu=mu0 vs Ha: mu < mu0 or
H0: mu=mu0 vs Ha: mu > mu0
Two-sided test
H0: mu=mu0 vs Ha: mu ≠ mu0
(2sided test as if test that not < or >)
What does mean “significant” here ?
The word “significant” means, statistic is within acceptable range (=OK).
Step 2 ?
Expl Slide 11 Lec 11
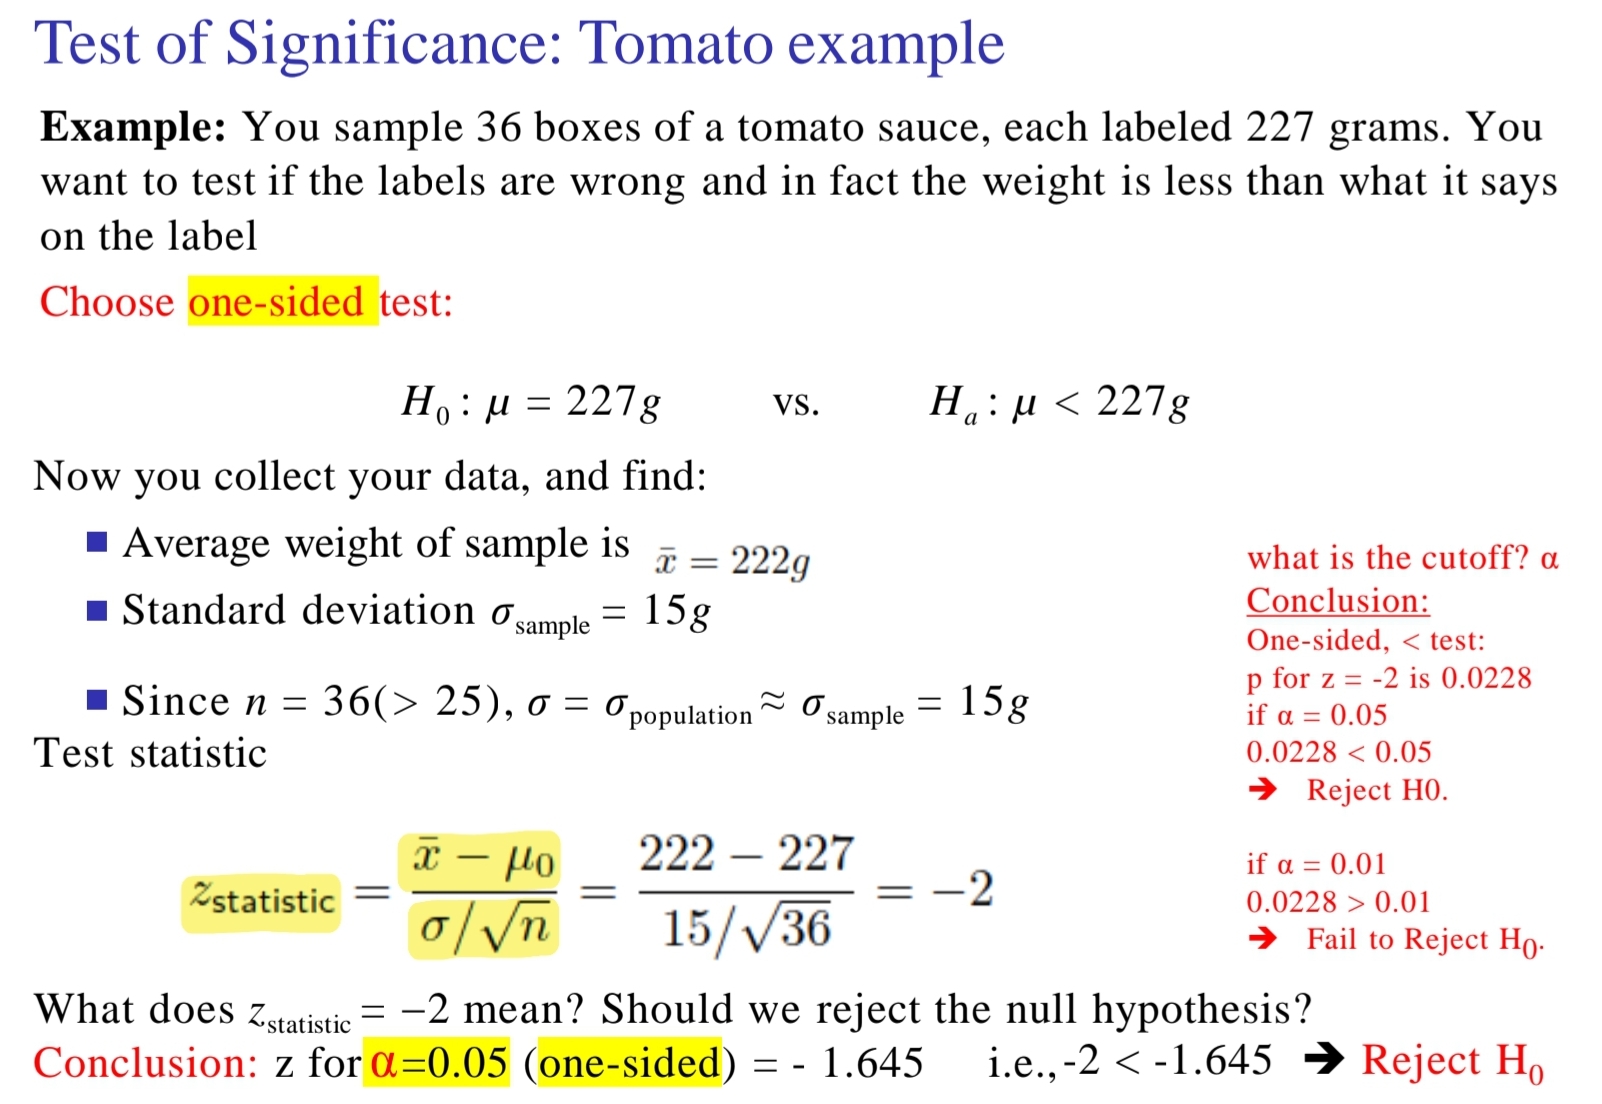
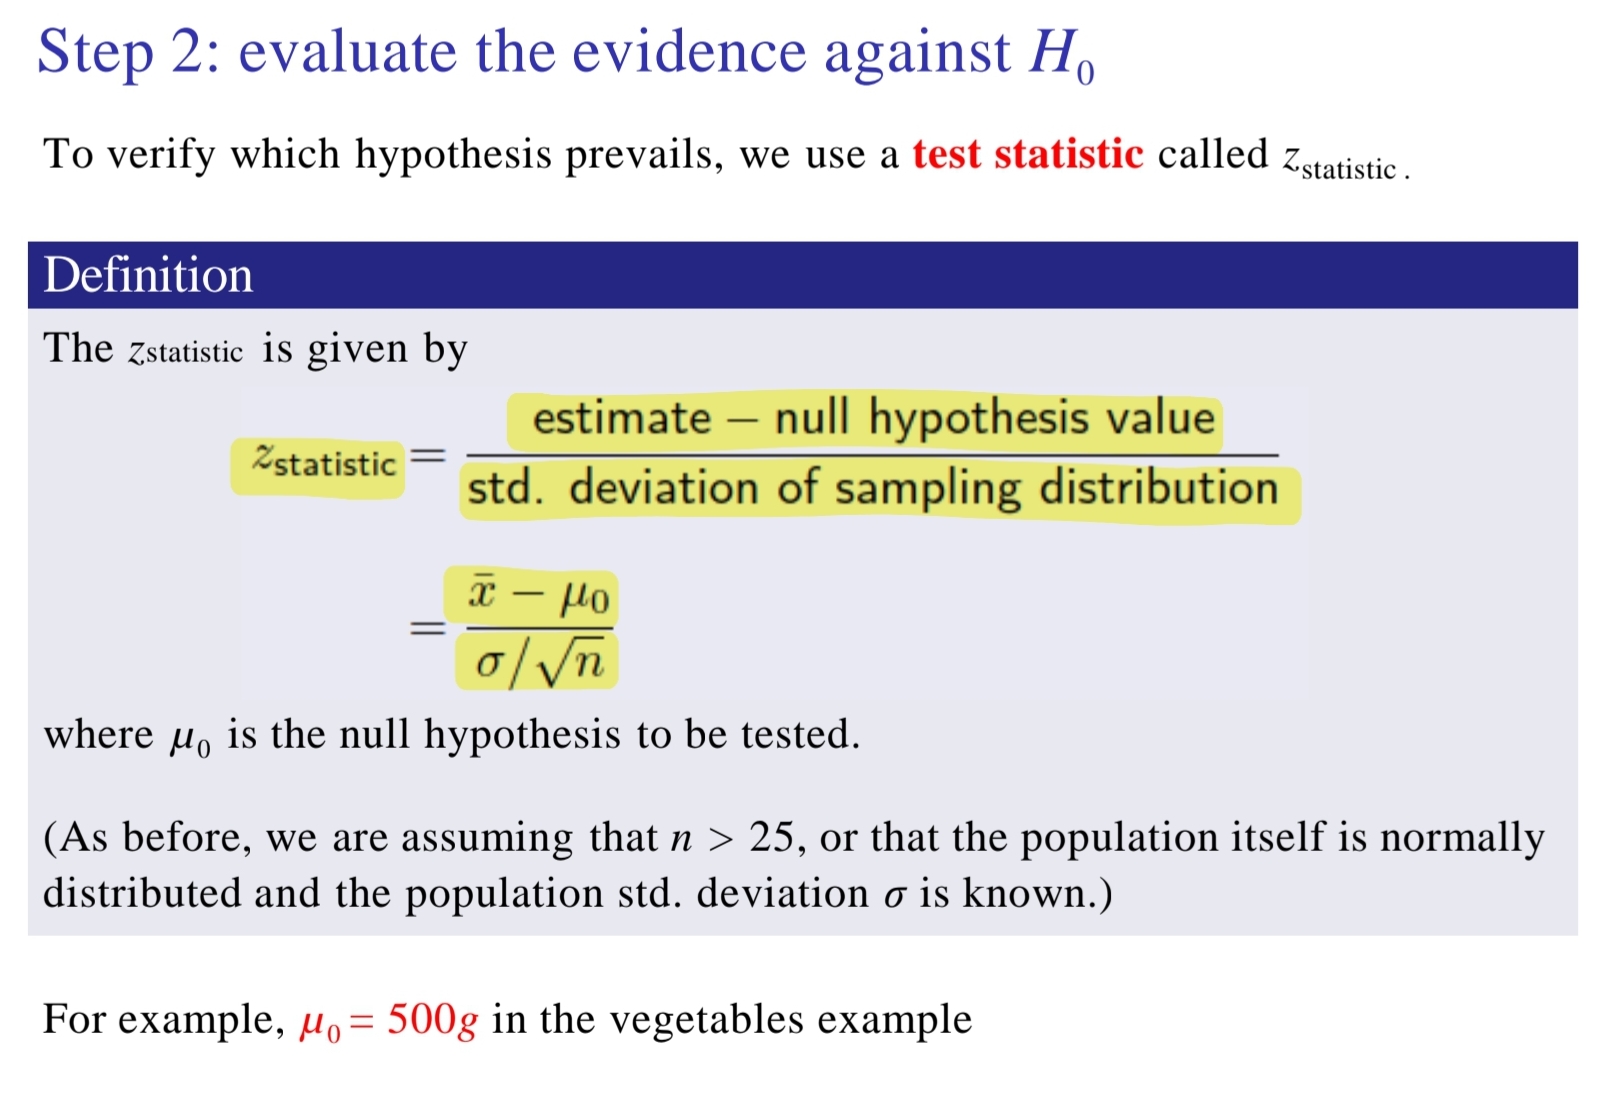
What is the P-Value ?
°the probability of seeing data as extreme or more extreme than what was observed [in the test] (in the direction specified by the alternative hypothesis Ha), assuming that the null hypothesis H0 is true.
= the “probability” that the null hypothesis H0 is correct
Step 3 ? Making ccl using the P-Value ?
Have to choose a significance level alpha
if P < alpha : fail to reject H0
if P > alpha : reject H0
When do u choose the significance level alpha ?
Before starting a test (always)
Do expl Slides 14-22 Lec 11 ?
Relation btwn confidence intervals & hypothesis testing ? Theorem :
°a level alpha two-sided hypothesis test rejects a hypothesis H0 : mu = mu0 exactly when the value mu0 falls outisde the level C = 1-alpha confidence interval for mu.
Do expl Slides 25-26 Lec 11 ?