Principles of Epi-Exam 2
1/201
There's no tags or description
Looks like no tags are added yet.
Name | Mastery | Learn | Test | Matching | Spaced | Call with Kai |
|---|
No analytics yet
Send a link to your students to track their progress
202 Terms
Observational-natural experiments
-Ecologic
-Cross-sectional
-Case-control
-Cohort
The hierarchy of experiments/evidence
Randomized Clinical Trials
Cohort
Case-control
Cross-sectional
Ecologic
Case series
Selection of study design
Dependent on:
- The research question
- Amount of information already known about the research question
- Practical considerations (feasibility)
- Ethical considerations
Ecological studies
Examine the exposure-disease association among aggregates of people – usually defined by geographic groupings
What is the unit of analysis for ecological studies
group
Groupings are defined by what
- Geographic area (e.g., county, state, country)
- Time (ecological trend study)
What are measures used in ecological studies:
- Summary measure of the frequency of exposure for each study unit (e.g., per capita cigarette consumption)
- Summary measure of the frequency of outcome for each study unit (e.g., CHD mortality)
- Joint distribution of exposure and disease within individuals residing in each study unit is unknown
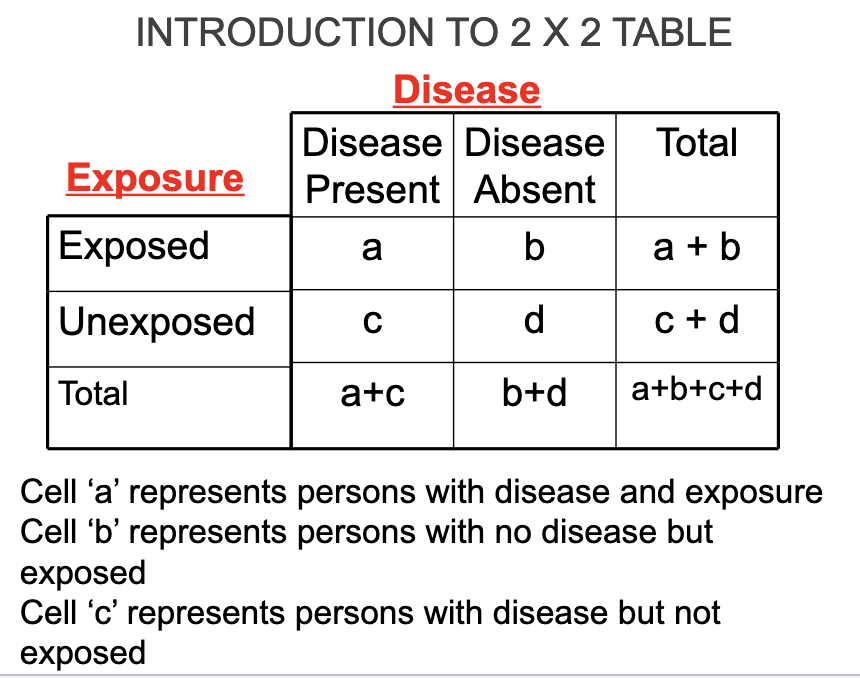
2×2 table
DATA USED IN ECOLOGIC STUDIES OF EXPOSURE-DISEASE ASSOCIATIONS
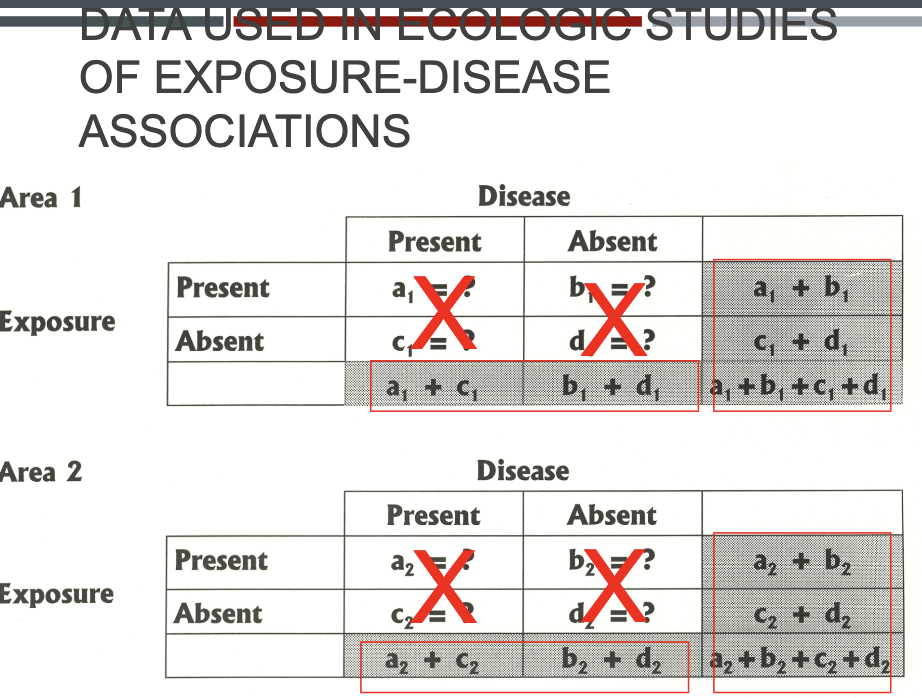
The measure for ecological studies is a…
correlation coefficient represented by r
Correlation Coefficient
A measure of association often used in ecologic studies = r, the correlation coefficient
- Quantifies extent of linear relation between exposure and disease across units of analysis
- Reflects the direction (+ or -) and the strength of the group-level association between exposure and disease
Interpreting Correlation Coefficient
-For every unit change in level of exposure, the disease frequency
increases or decreases proportionately
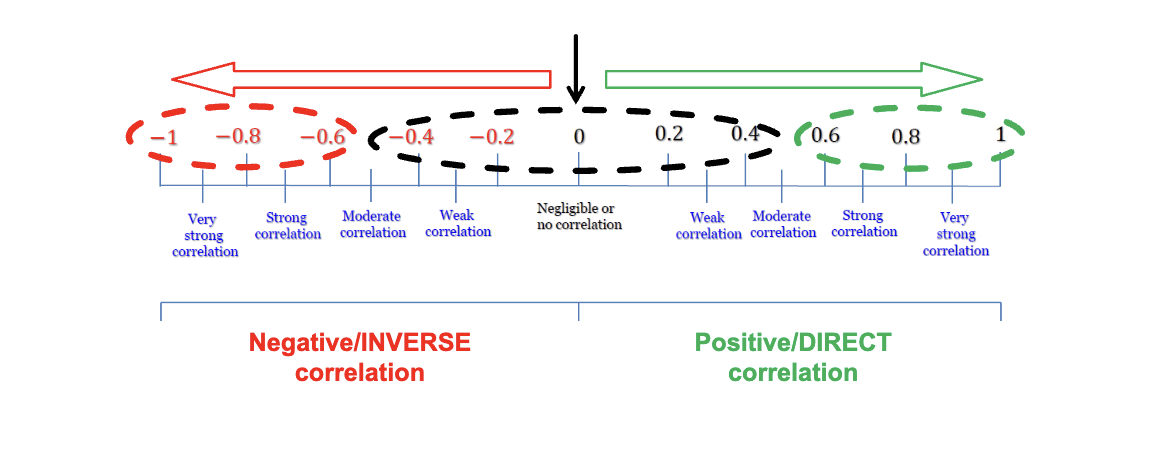
-Values range between
+1 (perfect positive correlation) and
-1 (perfect negative/inverse correlation)
Pearson Correlation Coefficient
The sign (+ or -) of the correlation coefficient provides important information.
+
high values of one variable are associated with high values of the other variable.
-
low values of one variable are associated with high values of the other variable.
Strengths of correlation coefficient
Correlations from 0 to 0.3 indicate poor or no relationship
Correlations from 0.30 to 0.50 reflects a fair degree of relationship
Correlations from 0.6 to 0.8 a moderate degree of relationship
Correlations at least 0.8 reflect a strong relationship
What are 3 useful scenarios for ecological study design?
As a first look at a possible association between exposure and disease at the group level to generate a hypothesis
Only aggregate info is available on the exposure of interest
Exposure of interest only varies at population level (no individual variation within group)
What are the 3 types of data used in ecologic studies?
Incidence
Prevalence
Mortality (used the most often)
What are some advantages to ecologic studies?
1. Makes use of existing data
e.g. vital statistics, cancer statistics, pollution level
2. Does not require direct contact with individual subjects
e.g. reduce the risk from performing test/giving treatment to study participants; expedited/exempt IRB
3. Can be conducted quickly and inexpensively
Through using existing data and no direct contact
4. Essential for studying ecologic associations/population-level relationships
e.g. large-scale comparisons, health policy
The ecologic fallacy entails the following:
Occurs when one draws inappropriate conclusions regarding relationships at the individual level based on group level (ecologic) data
Error in inference due to failure to distinguish between correlation of an exposure and disease within a population versus within individuals
May be ascribing to members of a group characteristics they in fact do not possess as individuals
What are the limitations to ecologic study?
Group data, not individual data (cannot infer results to the individual)
Information on confounders generally not available (cannot adjust for confounding variables)
Do not demonstrate causal relationships (can only be consistent with or not consistent with a causal association)
Correlation DOES NOT IMPLY causation because why?
Because there is possible a third confounding variable that explains the associations (e.g. high ice cream sales are associated with high homicidal rates b/c the heat is a confounding variable)
True or false: A cross-sectional study can be analytical or descriptive
True
What is a cross-sectional study?
a.k.a. a Prevalence Study because it provides “snapshot” of population at a specific point in time and looks for the coexistence of exposure and outcome in individuals at the same point in time
What are some features or a cross-sectional study?
Exposure and disease measures made at the individual level
Exposure and disease status determined at the same point in time for each participant
Cases identified are prevalent cases
Often used for chronic diseases (extended pre-clinical period and long duration)
Seroprevalence studies
Not useful for rare diseases or those of very short duration
Often sample general population – these are generalizable
What are the uses of a cross-sectional study?
Estimate of the magnitude and distribution of a health problem – measures the prevalence proportion
Hypothesis generation
Intervention planning
Design of a cross-sectional study invovles:
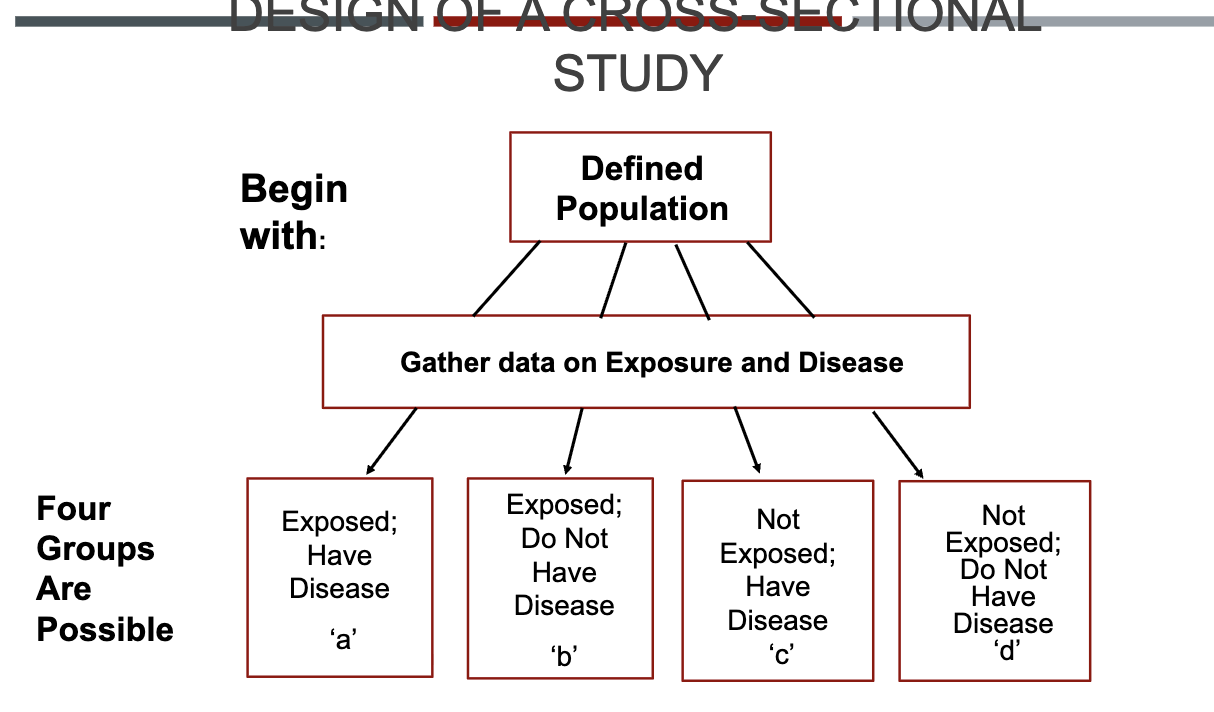
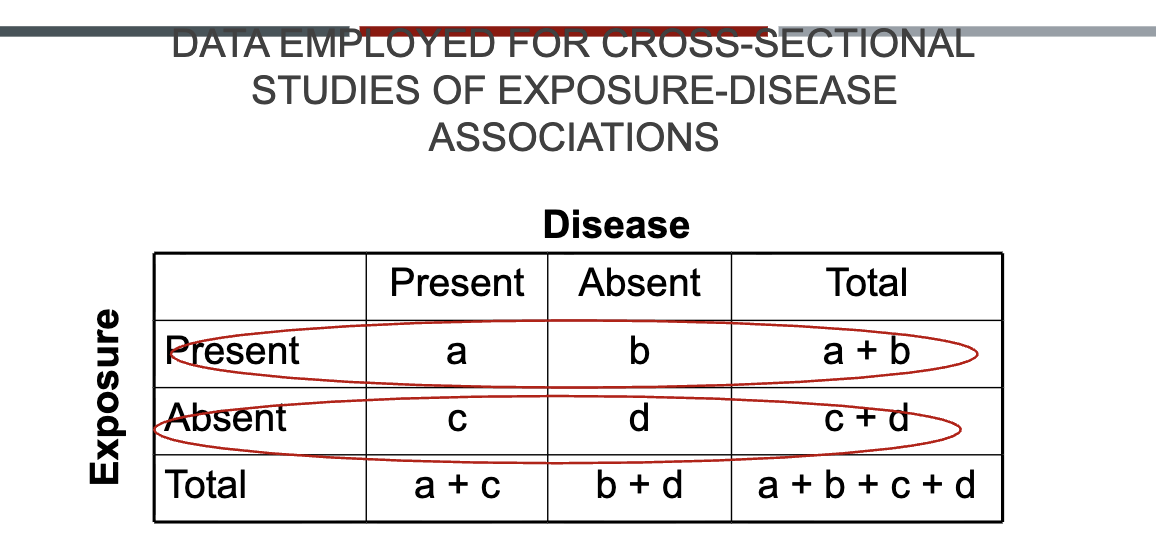
DATA EMPLOYED FOR CROSS-SECTIONAL STUDIES OF EXPOSURE-DISEASE ASSOCIATIONS
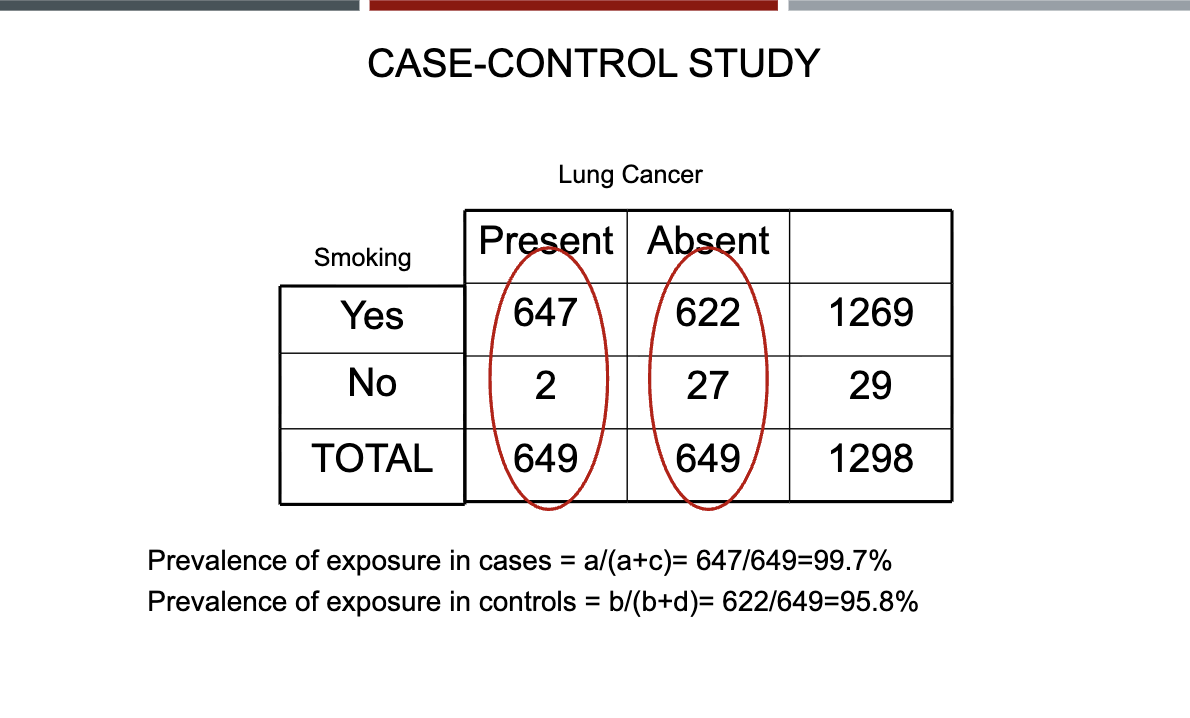
Prevalence of disease among exposed: a/a+b
Prevalence among unexposed: c/c+d
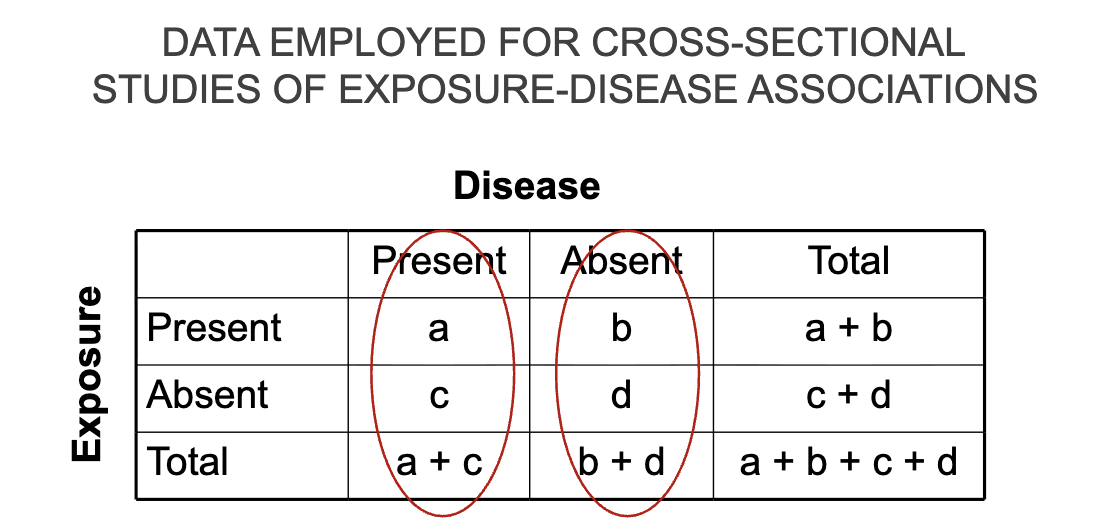
DATA EMPLOYED FOR CROSS-SECTIONAL STUDIES OF EXPOSURE-DISEASE ASSOCIATIONS
Proportion of exposed who have the disease: a/a+c
Proportion of exposed who do not the disease: b/b+d
Selection of study population
1. Selection based on a particular characteristic (e.g., ethnicity)
Example: If you wanted to compare the prevalence of coronary
heart disease (CHD) and markers of inflammation in Native
Americans, you could sample this population and then do an
ECG and blood test on each person in the sample. Prevalence
proportions of CHD would be compared in those with high and
low CRP.
2. Selection without regard to characteristic or exposure.
Example: If one wanted to examine relation between prevalence of
hypertension and body weight in Oklahoma County, a random sample
of households would be chosen and household members would have
their blood pressure, height and weight measured and be interviewed
regarding treatment for hypertension.
Prevalence proportion = number of cases of hypertension divided by
the number of persons examined. Compare by BMI category.
Ways to assess for exposure
Questionnaires – e.g., smoking status, employment, medication use
Records – e.g., current medication use
Lab tests – e.g., blood lead, serum cholesterol
Physical measurements – e.g., blood pressure, body mass index
Other special procedures – e.g., toenail clippings for selenium
Exposure issues in cross-sectional studies
Date of onset of exposure – may not be captured
Past exposure – may not be captured
Duration of exposure – may not be captured
Only exposures that do not change or those that “track” – e.g., genetic factors, serum levels of persistent pesticides - can be considered as preceding disease
Measurement of disease
Methods of measurement
Questionnaire/medical records
Physical exam
Special procedures, e.g., lab tests
Defined diagnostic criteria
Objective measures
May divide cases into definite, probable and possible disease categories
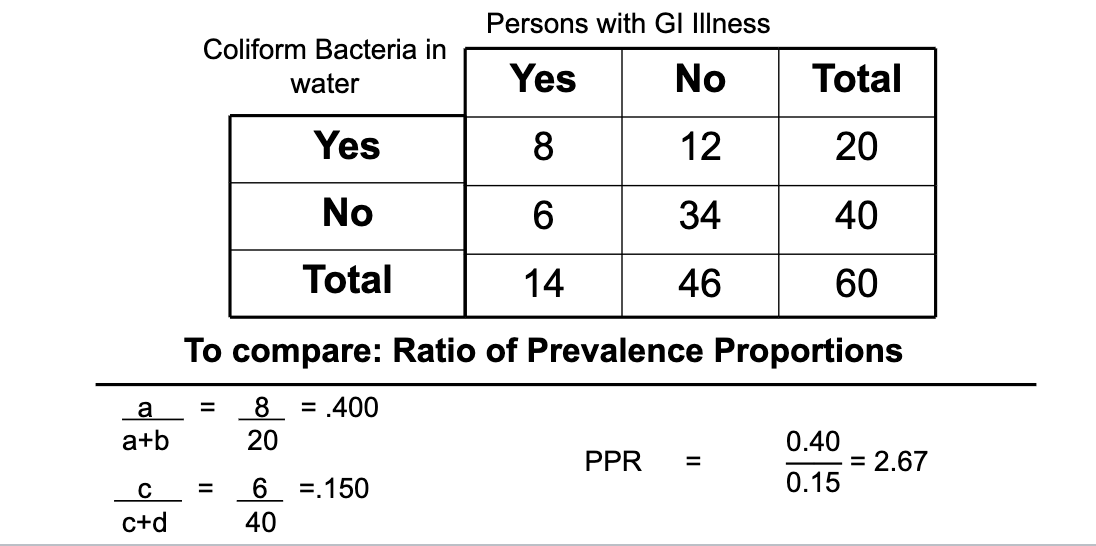
Cross-sectional study: to compare prevalence proportion
Prevalence proportion ratio (PPR)
What are the advantages to cross-sectional studies
If based on random sample of general population, results can provide prevalence estimates for the entire population
Can estimate population prevalence proportions of disease and exposure
e.g., what is the prevalence of NSAIDs use in residents of Oklahoma County?
Provides preliminary examination of disease –» exposure association
Relatively short time needed for study, lower costs
What are some limitations to cross-sectional studies?
Temporal sequence not determined (exception = if exposure is permanent factor)
Potential for biased inference in prevalent cases (are they like incident cases?; P ~ I x D) e.g., survival bias
Cases in remission or treated may be missed
Not appropriate for rare diseases or diseases with very short duration
How might bias be introduced?
In cross-sectional studies, prior exposure status is usually not determined – only current status
People may change exposure status over time, so current status may not reflect past exposures
Change in exposure status may be related to the outcome you are studying
This leads to bias in the observed association
More on cross-sectional studies:
Cross-sectional studies can suggest associations between exposure and disease (hypothesis generation)
Cross-sectional studies cannot establish causal relationships
No temporal sequence
Prevalence cases are a function of both disease incidence (etiology) and disease duration (survival)
Special circumstance when cross-sectional study data can evaluate etiologic associations
Only when current values of exposure variables are unaltered over time
factors present at birth (eye color, blood group, HLA antigens)
What is the temporal sequence problem?
If you wanted to know whether or not obesity predisposes to osteoarthritis of the hip, in a cross-sectional study a positive association may mean:
1) that obesity does predispose to osteoarthritis,
2) or it may mean that people who develop arthritis exercise less and put on more weight.
A weight history is necessary to determine weight before arthritis developed.
What is the problem with prevalence/incidence bias?
If a cross-sectional study showed a lower prevalence of dementia in users of NSAIDs compared to non-users, it could mean:
1) that NSAIDs protect against developing dementia (influenced etiology),
2) or that persons with dementia who used NSAIDs were more likely to have died than persons with dementia who did not use NSAIDs (influenced survival), thus making NSAIDs appear protective
True or False: An ecological study is higher on the "Hierarchy of Evidence" list when compared to cohort studies.
False
What is the key-characteristic of a cross-sectional study design?
Data collected at a single point in time
How do you calculate prevalence in a cross-sectional study?
Number of individuals with condition divided by total in group
True or False: Cross sectional studies tend to identify cases of long duration since people who die or recover quickly aren't found
True
What is the primary limitation of ecological studies?
They are susceptible to ecological fallacy
What would be the best way to measure exposure to secondhand smoke in children in a cross sectional study?
Measuring a nicotine biomarker in a child's saliva
What are case-control studies?
Selects the study population on the basis of disease status
A case-control study begins with people who have the disease (cases) and compares them to people who don’t have the disease (controls)
Compare the odds of past exposure to a suspected risk factor between cases and controls (retrospective/goes back in time)
An example of a case selection:
Suppose we are interested in investigating an association between childhood cataracts and exposure to rubella virus in utero.
Cases would be children with cataracts
Controls would be children without cataracts
For each child we would determine whether or not their mother was exposed to rubella during her pregnancy with that child
Issues in case selection: definition
Diagnostic criteria – Clearly defined, objective, standardized criteria
Objective: to produce a uniform, homogenous group of cases
Example: In a case-control study of preterm delivery, cases would be
identified as babies born < 37 weeks of gestational age as defined by first
trimester ultrasound measurement of crown-rump length.
Issues in case selection: definition
Criteria for eligibility – Clearly defined reasons to include/exclude cases
E.g., by age, gender, potential for exposure
Apply equally to cases and controls
Example: A study of recent oral contraceptive use and myocardial infarction would exclude males and post-menopausal and surgically sterilized women because they have no risk of recent exposure. Including them could bias the results towards the null.
Why do we study incident cases for case-control vs prevalence?
Reduce potential for Incidence/Prevalence bias (P≈ IxD etiology v. survival/duration)
Diagnoses more likely to be uniform, using same criteria
Recall of exposure may be better
Case selection
Cases are selected without reference to (without knowledge of) their exposure history
Sources of cases include:
Hospital-based
Community or population sample
Registries which are not population-based
Large pre-paid insurance plans
Retirement communities
Advantages vs disadvantages of hospital-based
Hospital-based: all cases admitted to a single hospital or
group of hospitals within a given time period who meet the eligibility criteria
Advantages:
Easier
Cheaper
Disadvantages:
Potential for biased sample of cases
Referral patterns
Only suitable for diseases that are usually hospitalized
Advantages vs disadvantages of community/population samples
Community or population sample of cases: include all (or random sample) of cases in defined geographical area within specified time period; use registry if it exists
Advantages:
Representative
Case group
Disadvantages:
Costly
Time-consuming
Difficult to do without registry
Selection of Controls
Purpose: Controls provide a comparison group for cases
Definition: Controls are intended to represent the frequency of exposure in the population from which the cases arose
Controls are selected from the same source population as the cases were chosen
Controls are free of disease under study
Controls usually similar to cases with regard to past potential for exposure, during same period of risk under study
Usually select controls in same manner as cases selected in order to select from the same source population
Eligibility criteria – any exclusion criteria applied to the cases also applied to the controls
Example for control selection
A case-control study of tonsillectomy (exposure) and lymphoma (outcome) conducted in Iowa would select cancer cases from the statewide SEER cancer registry.
Because cases are identified on a statewide basis, controls should also be chosen on statewide basis.
The “source population” for cases is the State of Iowa.
True or False: Controls are selected without reference to (without knowledge of) their exposure history
True
Sources of controls include:
Hospital-based
Community/general population samples
Neighborhood
Multiple types
What are community/general population sample controls?
Controls are selected from a random sample of the general population
Random-digit dialing commonly used
Appropriate if cases are population-based
What is hospital-based control
People seeking medical care at same institution as cases for conditions unrelated to disease under study
Exclude persons with diseases known or suspected to be related to exposure under study (ex: smoking and MI; emphysema)
The illness of the controls should have the same referral patterns to the health care facility as that of cases
May use multiple diagnoses
What are neighborhood controls?
Controls selected from same neighborhood as cases through canvassing or use of phone number
What are multiple type controls?
Used to assess potential biases (e.g., recall) or to compensate for the deficiencies of other types of controls
Advantages vs Disadvantages of Hospital-based controls sources:
Advantages: Captive population, clearly identified, economical method, less recall bias
Disadvantages: Potential for selection bias, less generalizable
Advantages vs Disadvantages to community/general population control sources:
Advantages: Highly representative; calculate population frequency of exposure; appropriate for population-based cases
Disadvantages: Costly, problems with refusal and phone coverage, increase in cell phone usage
Advantages vs Disadvantages to neighborhood control sources:
Advantages: Provides controls of similar socioeconomic status and environment as cases
Disadvantages: Overmatching possible, low response rates
Advantages vs Disadvantages of multiple type control sources:
Advantages: internal replicate of study; assess certain types of bias
Disadvantages: costly and time-consuming; if results differ, must be able to explain
An example of a case-control study:
A case-control study of brain tumors in children included two
different types of controls:
Children with other solid tumors (“sick controls”)
A random sample of healthy children from the same birth cohorts as cases (community controls)
Purpose: to assess results for potential recall bias
Validity
Validity – accuracy of the data
Internal validity - the study was done properly and the results are valid in the study population
External validity – findings of the study are generalizable (representative) from the study population to the target population
Representativeness
Relates to the generalizability of the study (external validity)
Advantages: increase generalizability, reduces potential for certain types of selection bias
Disadvantages: may be more difficult, time consuming, resource intensive
Comparability
Internal validity: cases and controls have equal probability of past
exposure if there is no association between exposure and disease.
Advantages: easier to detect smaller differences; reduces chances for unmeasured confounding
Disadvantages: may have select group of cases, potential for Berkson’s bias (hospital-based studies only)
Assessment of Exposure
Exposure is prior to disease onset (or reference date for controls)
Techniques: Information on prior exposure in cases and controls may be ascertained through personal interview, hospital or medical records, employment records, pharmacy or lab records, or direct measurement
Timing of exposure – when did it occur in relation to disease onset or index date?
Quantification of exposure for dose-response analysis
Includes amount, duration and frequency of exposure.
Example of assessment of exposure for a case-control
Weinmann et al. (1994) conducted a case control study of renal cell cancer in relation to prior use of antihypertensive medications within the membership of Kaiser-Permanente Northwest.
For cases and their matched controls, outpatient and inpatient medical records were reviewed for information regarding medication use up to a date three months prior to the case’s diagnosis
Measure of Association for case-control study
Odds Ratio (OR)
Ratio of two odds (the odds that cases were exposed ÷ the odds that controls were exposed)
Example of calculating odds:
If there are 100 smokers and 60 develop a chronic cough, the probability of smokers developing a cough is 60 / 100 = 60%
The probability of smokers not developing a cough is 100% - 60% (or 40 / 100) = 40%
The odds of developing a cough are 60:40 or 1.5
Note how the odds of developing a cough differs from the probability of developing a cough
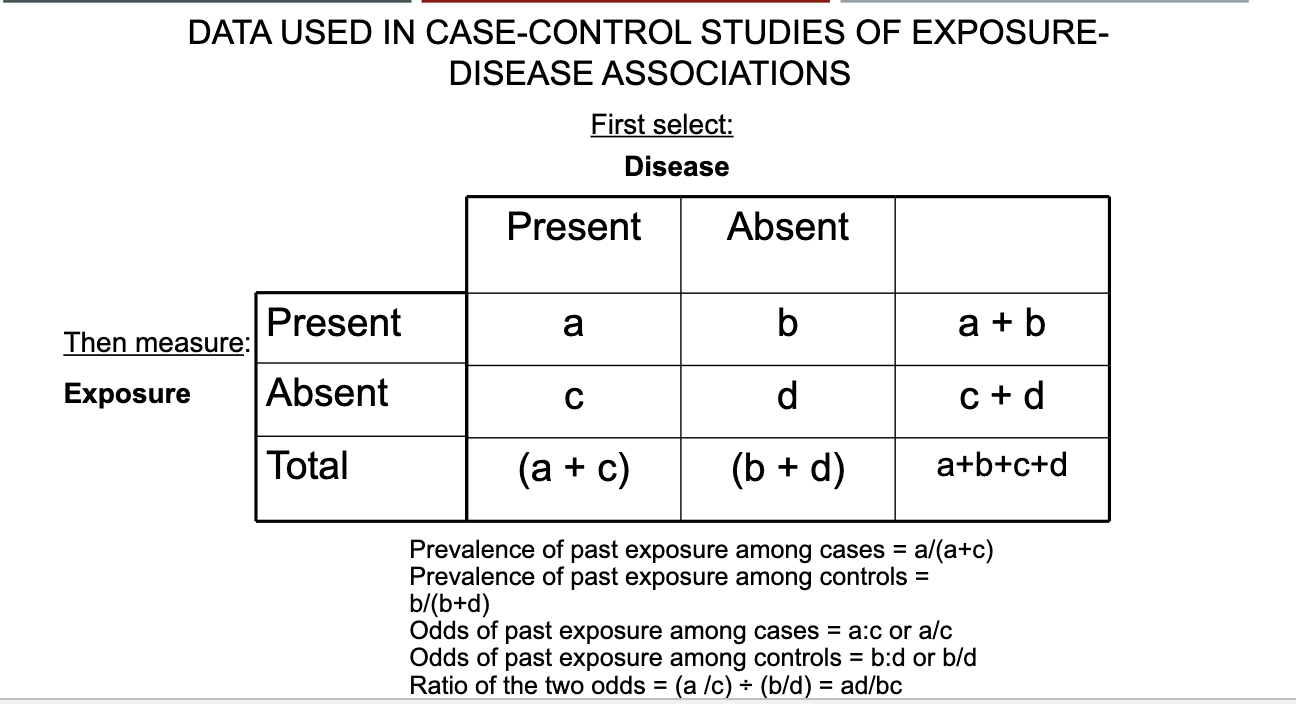
DATA USED IN CASE-CONTROL STUDIES OF EXPOSURE-DISEASE ASSOCIATIONS
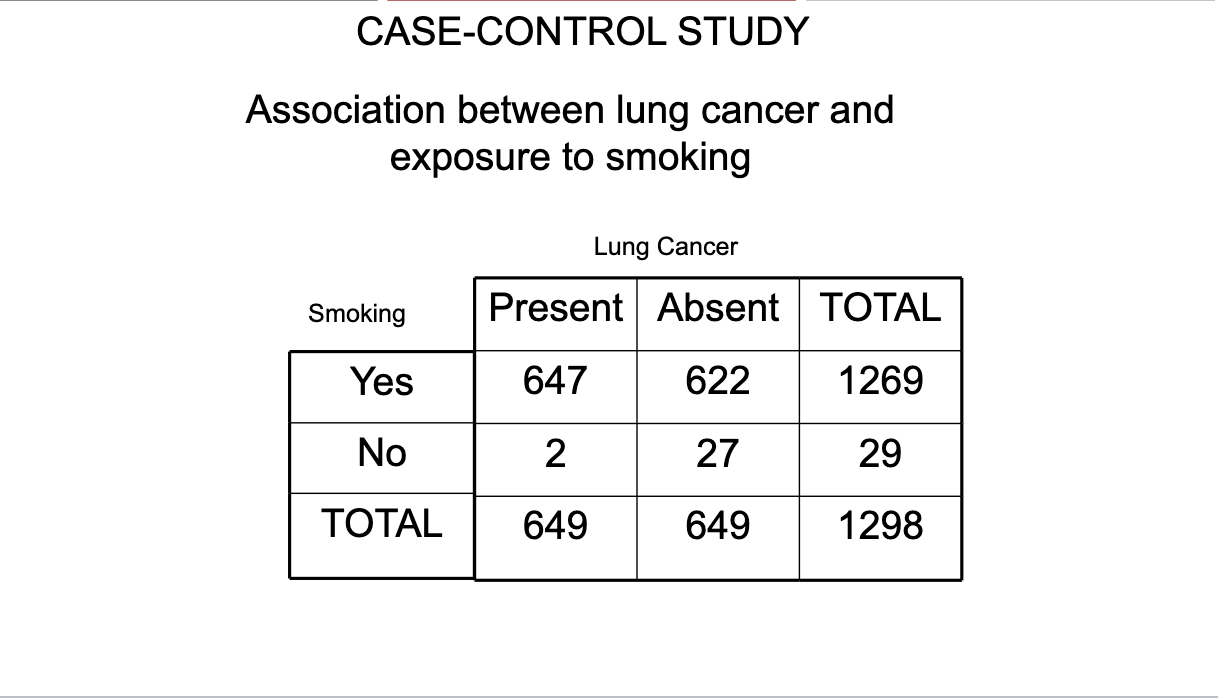
CASE-CONTROL STUDY 2×2 table
CASE-CONTROL STUDY 2×2 table OR calculations
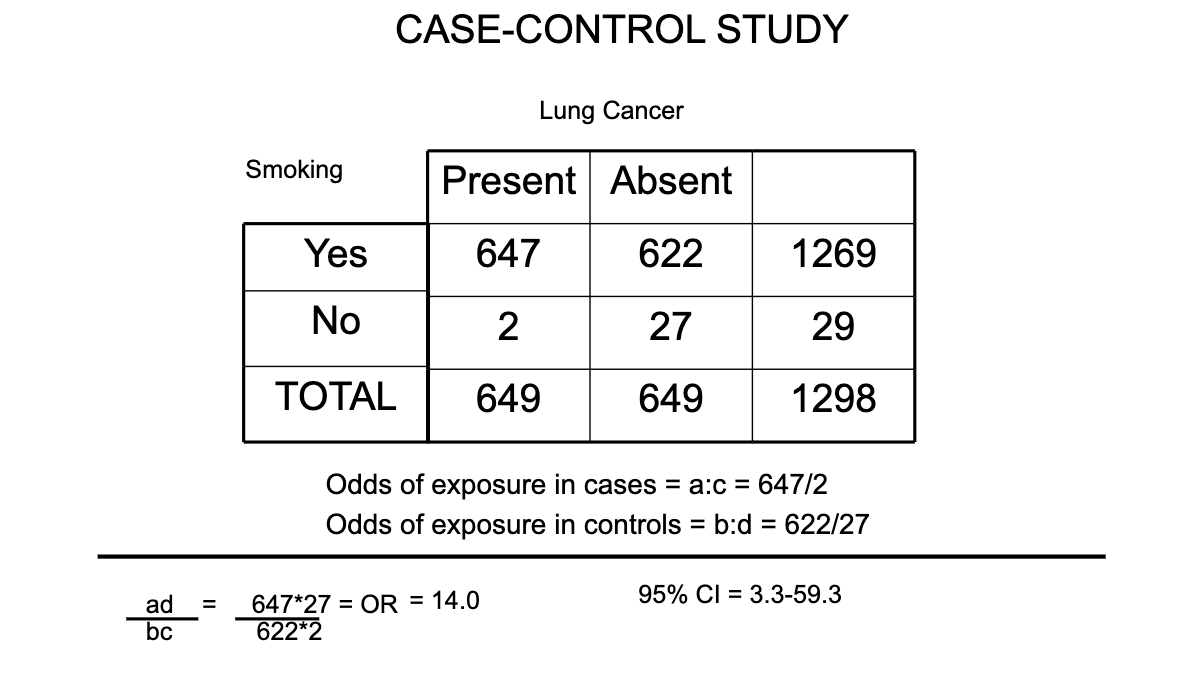
How to interpret OR in the example used (remember its odds of exposure not disease)
The odds of having smoked cigarettes among cases of lung cancer are 14.0 times greater than the odds of having smoked cigarettes among controls.
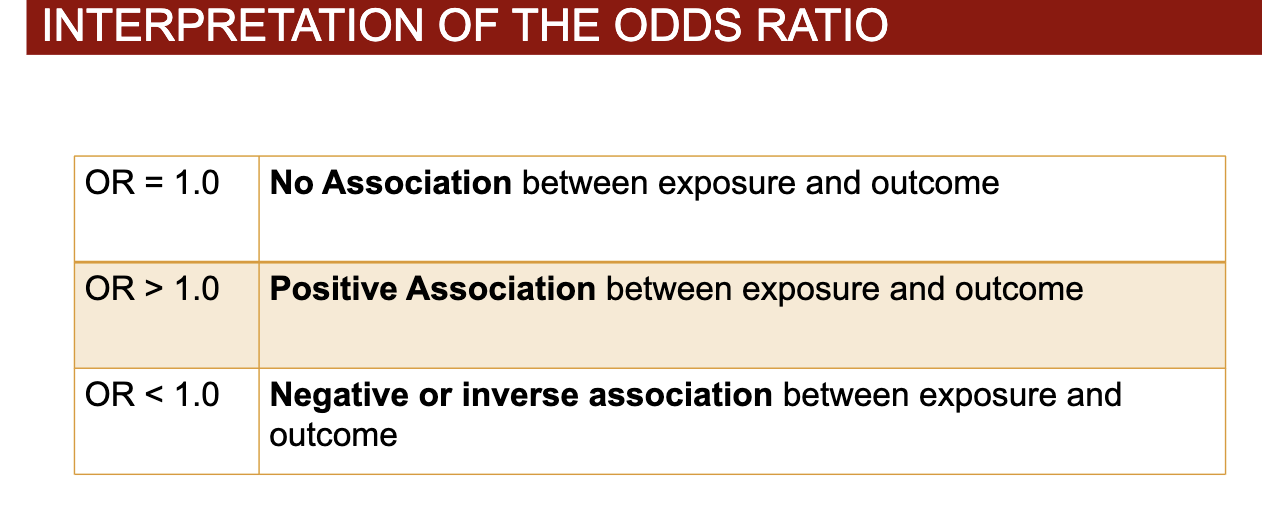
Interpretations of OR
Risk Ratio
You cannot, in most circumstances, use case-control data to calculate incidence and thus, you cannot directly calculate risk ratios from case-control data
Study groups are chosen on the basis of presence of disease, not exposure
Odds ratios are good approximations of the risk ratio if your study is properly designed
Matching of cases and controls
Definition: The process of selecting controls so that they are similar to cases for characteristics, such as age, gender, race, or socioeconomic status, that might be confounding variables.
Matching is one of the ways to deal with confounding, by making cases and controls similar across these characteristics.
Types of Matching
Individual (pair) matching – selecting one or more controls for each individual case
e.g., for a case of MI who was a white male aged 67 years, select one or more controls without MI who are white, male and 62-72 years of age –repeat for each case in the study
Frequency (group) matching – the control group is selected so that its distribution is similar to that of cases for potentially confounding variables such as age, gender and race. Requires that all of the cases be selected first or that the distribution is known.
e.g., if 68% of your MI cases are male, 68% of your controls are chosen to be male
Example of Pair Matching
Only match b/c for pair matching
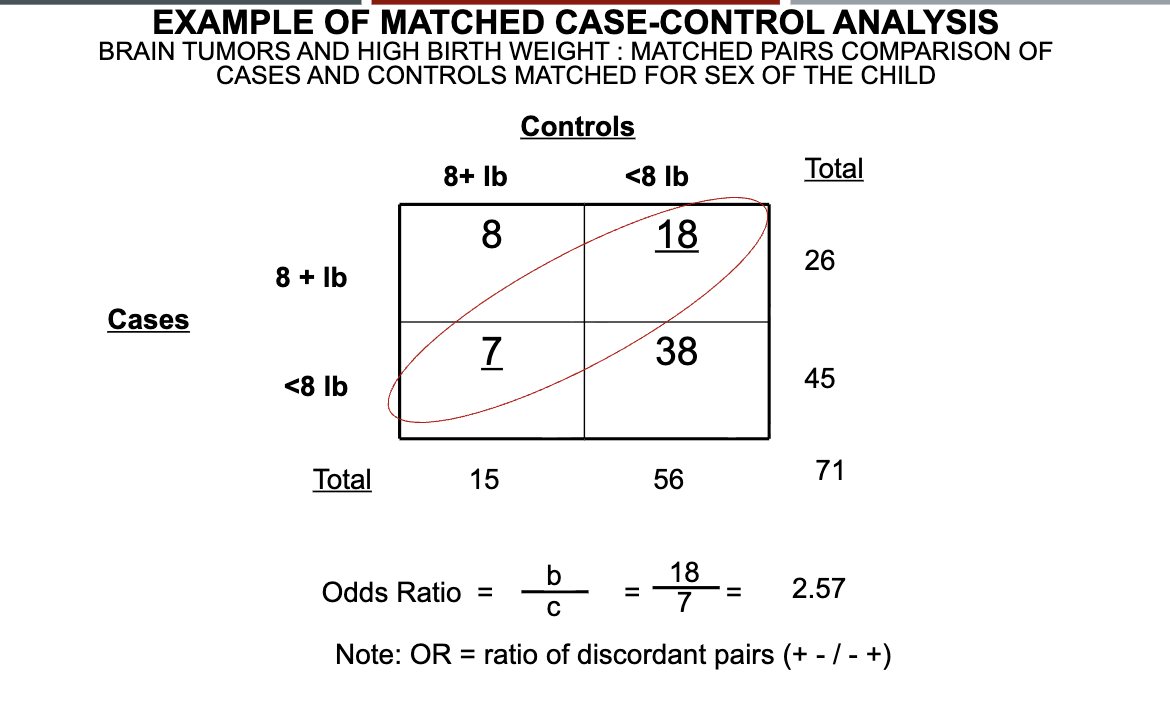
Explanation of matched pair analysis
To calculate an OR for a matched case-control study with 1 case matched to 1 control (1:1 match) on a factor (sex as in our example): OR = b/c
We divide the number of pairs in which the case, but not the matched control, is exposed (Case +, control - for exposure) by the number of pairs in which the control, but not the case, is exposed (case -, control + for exposure)
Each cell in the 2x2 table on the previous slide represents the number of pairs in that cell
A: 8 pairs where case and the matched control are both exposed
B: 18 pairs where the case is exposed (8+ lbs), but the matched control is unexposed (<8 lbs)
Supports our hypothesis that positive exposure is associated with disease (high birth weight associated with brain tumors)
C: 7 pairs where case is unexposed (<8 lbs), but matched control is exposed (+8 lbs)
Data do not support our hypothesis
D: 38 pairs where case and matched control are both unexposed
A and D are non-informative since cases and controls are alike regarding exposure
What are the advantages of case-control design?
May be quicker and less expensive compared to cohort studies.
Well suited for rare disease and diseases with long latent periods.
Fewer subjects required than for cohort studies.
Multiple etiologic factors can be evaluated.
What are the disadvantages of case-control design?
More potential sources of bias and error than cohort studies
Temporal relationship – did exposure cause disease or did disease cause exposure?
Appropriate control group may be difficult to identify.
What is a cohort?
group of people who share a common experience
Persons born in same year – birth cohort
Persons who share a common behavior – e.g., cohort of smokers; employees at a tire manufacturing plant
Persons in the same class – e.g., MPH cohort of Fall 2019
True or False: Prospective cohort studies follow exposed and unexposed individuals forward in time and relative to exposure to determine the incidence of disease in each group
True
3 Types of cohort studies:
1) Prospective (concurrent/longitudinal)
2) Retrospective (non-concurrent/historical)
3) Ambi-directional (combined concurrent/non-concurrent)
Prospective Cohort Studies
Investigator collects information on the exposure status of study subjects at the time the study begins and identifies new cases of disease that develop from that time on, until the end of the follow-up interval.
Retrospective Cohort Study
Investigator determines exposure status from information recorded at some time in the past, and disease status is determined from that point in the past up until the present (i.e., the follow-up period has already occurred).
Ambi-directional Cohort Study
Cohort and exposure status identified from past records, followed into the present, then followed into the future. Most often used when additional follow-up time is needed.
Selection of cohort study population: General population
General population sample – Representative sample from the general population
Makes results highly generalizable
Expensive, labor intensive, and may have problem with loss to follow-up. E.g., Framingham; PATH study
Selection of cohort study population: Special cohort population
Special cohort – Defined population based on membership in a particular subgroup of interest.
Follow-up may be easier
Results may not be as widely generalizable. E.g., Nurses Health Study; U.S. Veterans; Strong Heart study
Selection of cohort study population: known exposure cohort population
Presence of a Distinctive Exposure – Selected because they are known to be exposed to a certain factor
Generally used for occupational cohorts.
Cohorts may be stable and easy to follow.
Results may not be generalizable. E.g., Atomic bomb survivors; persons exposed to chemicals or other hazards on the job
What is the reference group for the exposed?
Internal Comparison – from the same population as the exposed group e.g., unexposed in the population (Framingham, low cholesterol levels)
2. External Comparison – outside of the exposed group e.g., general population data; another study’s data
3. Combined – both internal and external comparison groups can be used
Cohort Charactersitics
Population based vs. Non-population based
Open cohort (persons enter and leave over the course of follow- up) vs. Closed cohort (begin with a fixed study group; persons may leave but no new members enter)
Assessments of exposure:
1. Definition of exposure – what will constitute “exposure”?
2. Sources of exposure data which can be found through interview/survey, existing records, physical exam, and direct measurement
3. Timing of exposure - onset
4. Quantifying exposure
Frequency – how often? Continuous or intermittent?
Intensity – how much?
Duration – how long?
5. Changes in exposure status - how to deal with?
Measurement of Disease
Determine disease-free status at start of study
Outcomes must be clearly defined and measurable – who is an incident case?
How will you determine whether or not disease has occurred?
Procedures should be well-defined and the same for both exposed and unexposed groups
Best if assessment of disease incidence is done blinded to exposure status
Outcome measures in cohort studies:
Cumulative Incidence
Incidence Density
Cumulative Incidence
CI: all cases known to have occurred in the baseline cohort during the follow-up time divided by the study population at baseline, per unit of time.
Numerator is # of incident cases; Denominator is # people in study population
Closed cohort
CI is a risk measure