AP Human Geography Units 1 and 2 CONDENSED Review
1/128
There's no tags or description
Looks like no tags are added yet.
Name | Mastery | Learn | Test | Matching | Spaced | Call with Kai |
|---|
No analytics yet
Send a link to your students to track their progress
129 Terms
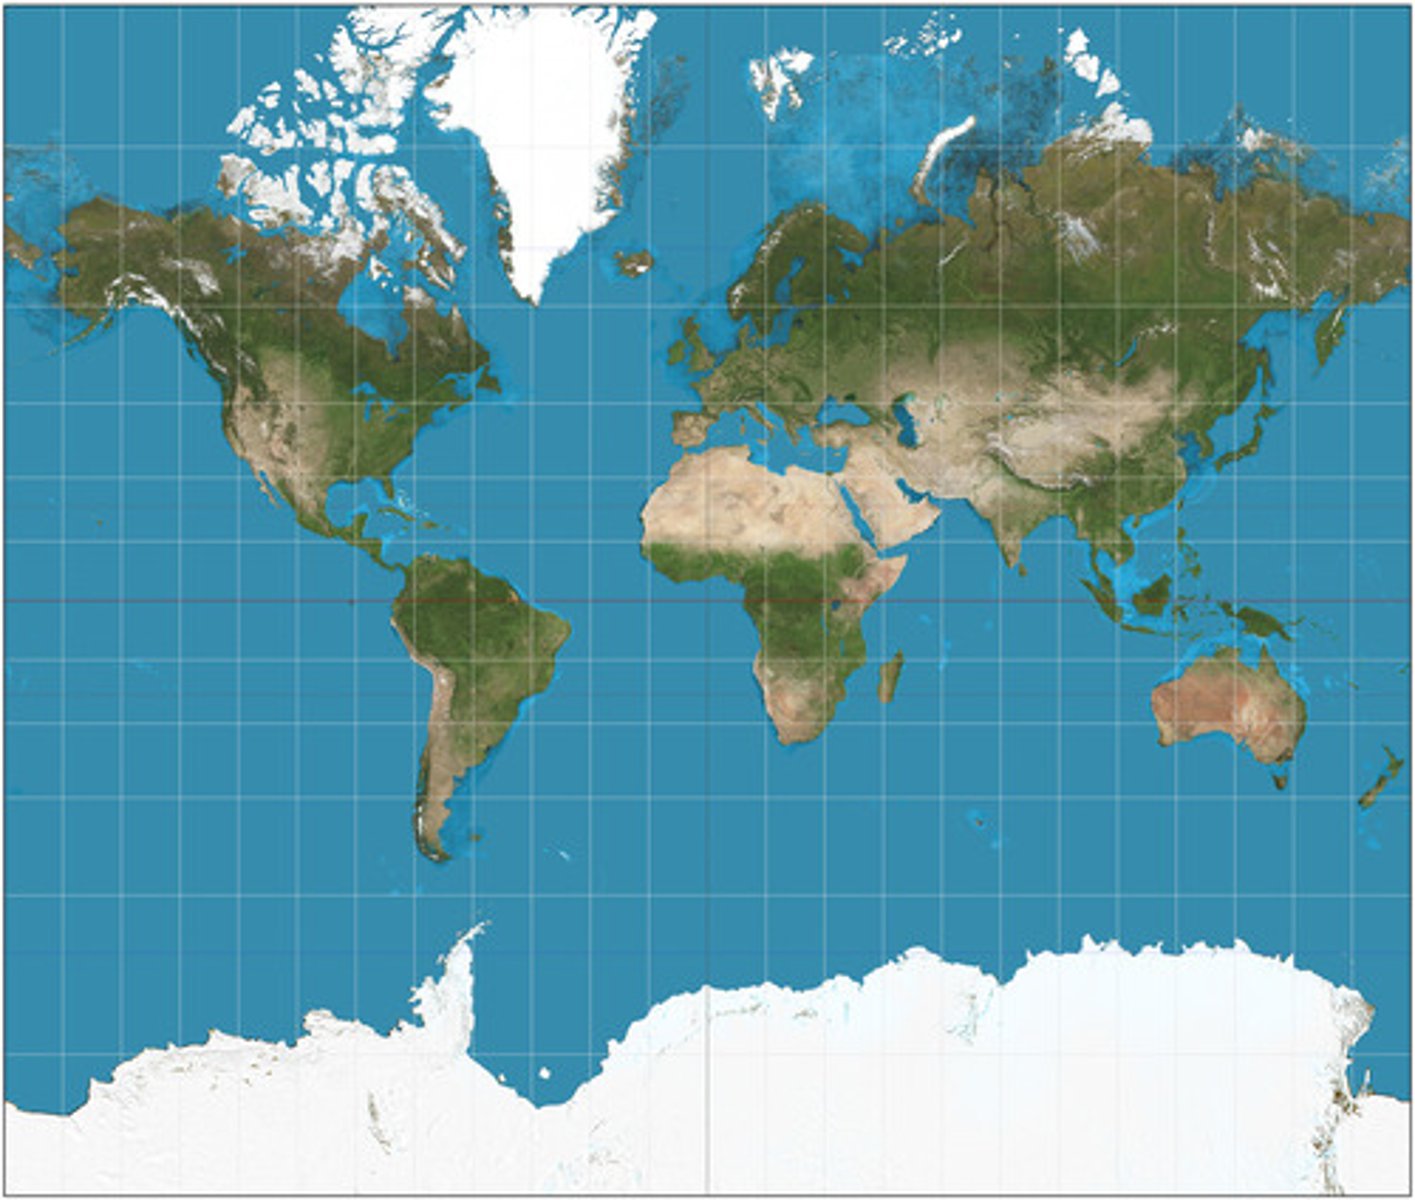
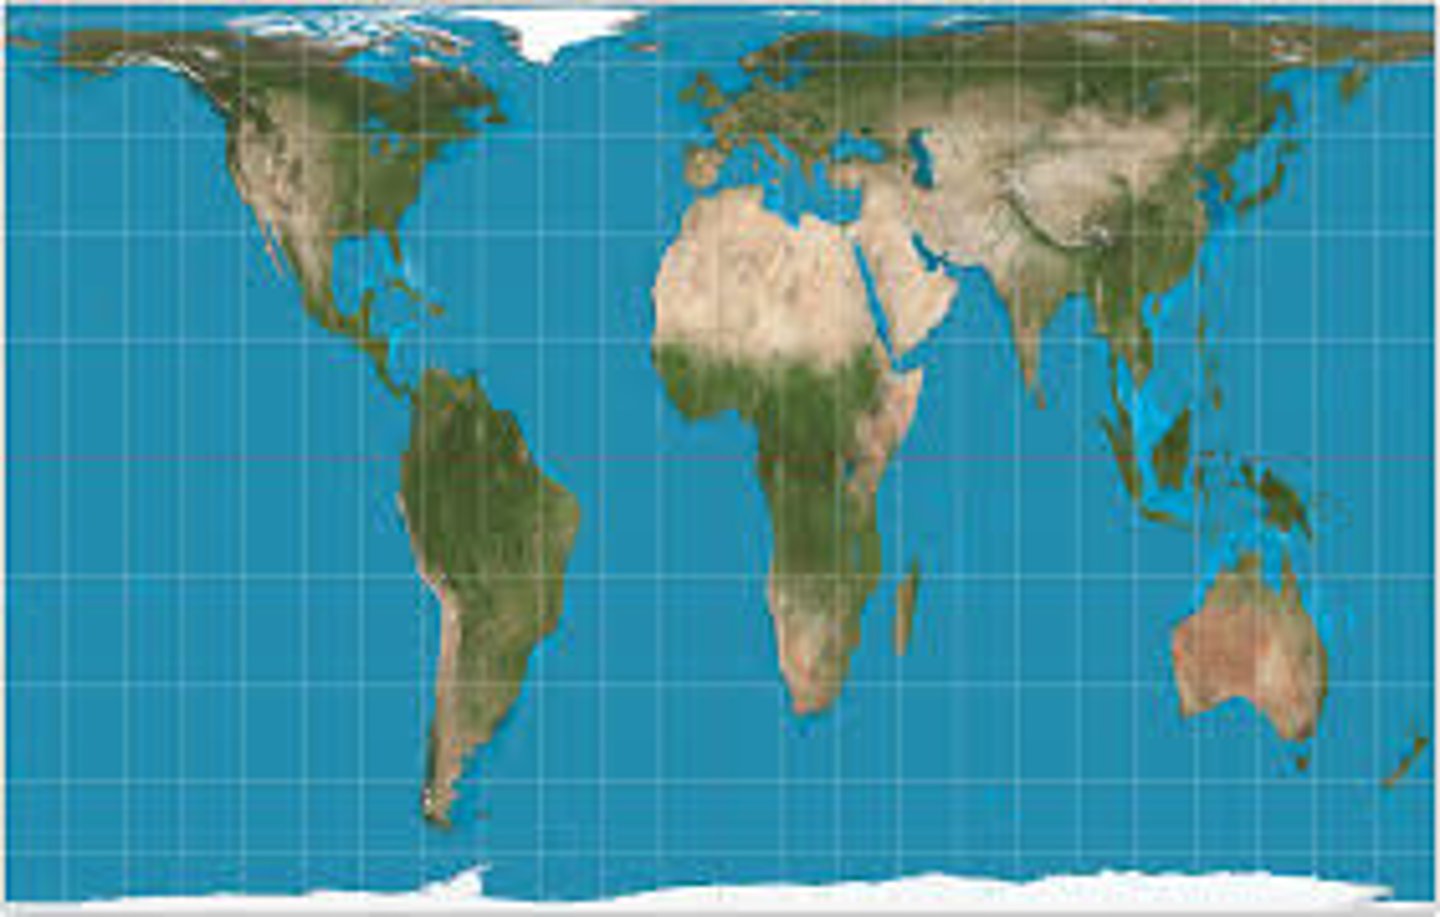
mercator
for navigation of the earth onto a cylinder Distorts the land area at the poles, but shapes are fine
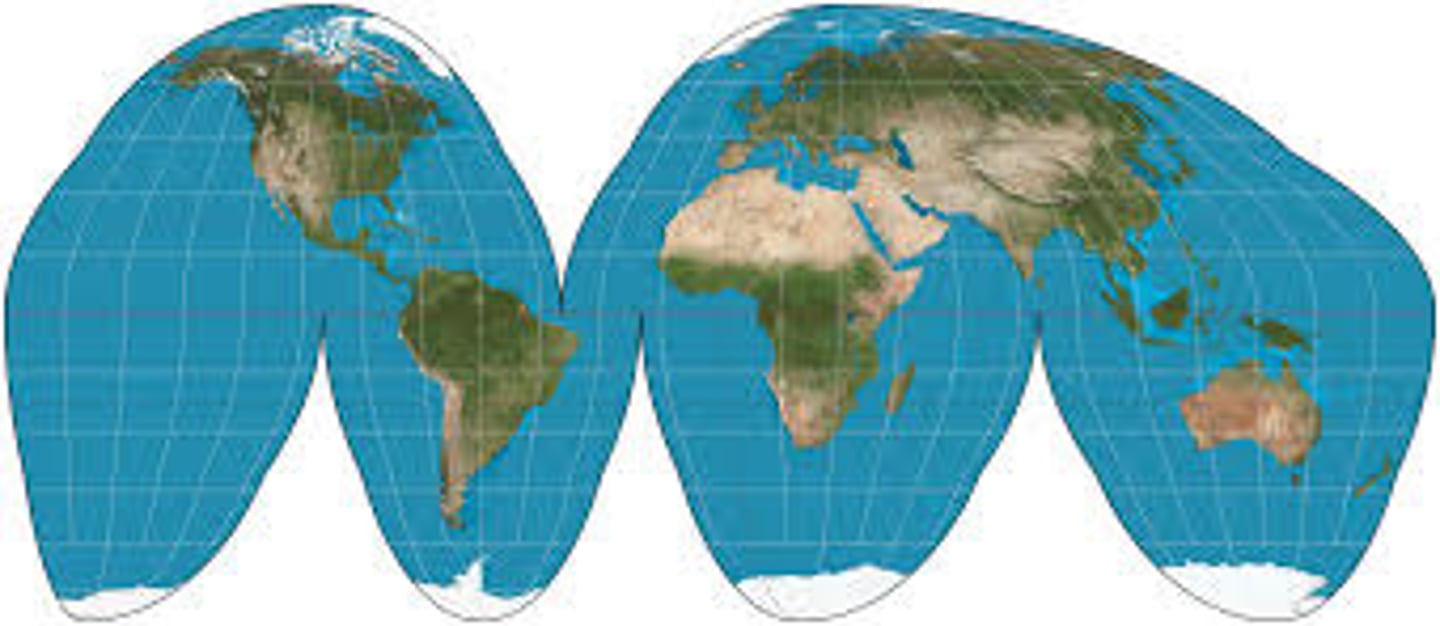
goode homolosine
interrupted map with portions of oceans cut out, preserves area/shapes of landmasses* interrupts the oceans & directions
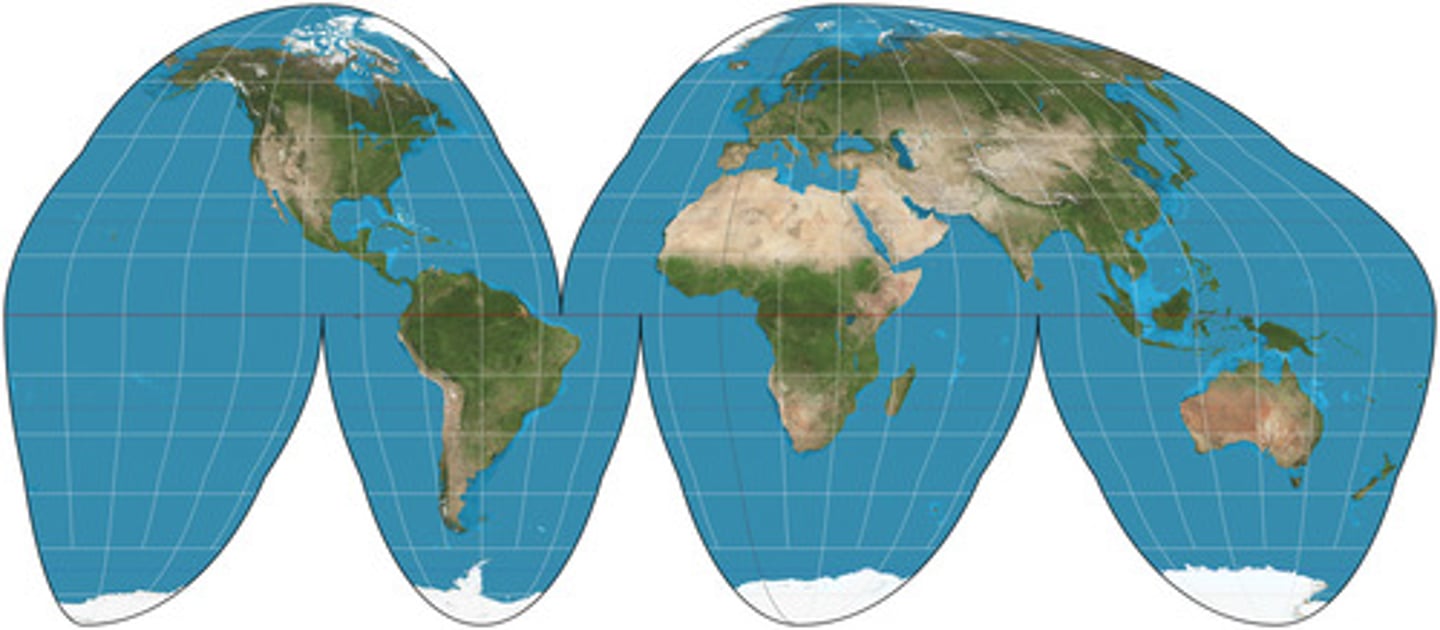
Interrupted map
Cuts out portions of the oceans
Uninterrupted map
map that's not broken up, shows entirety of earth

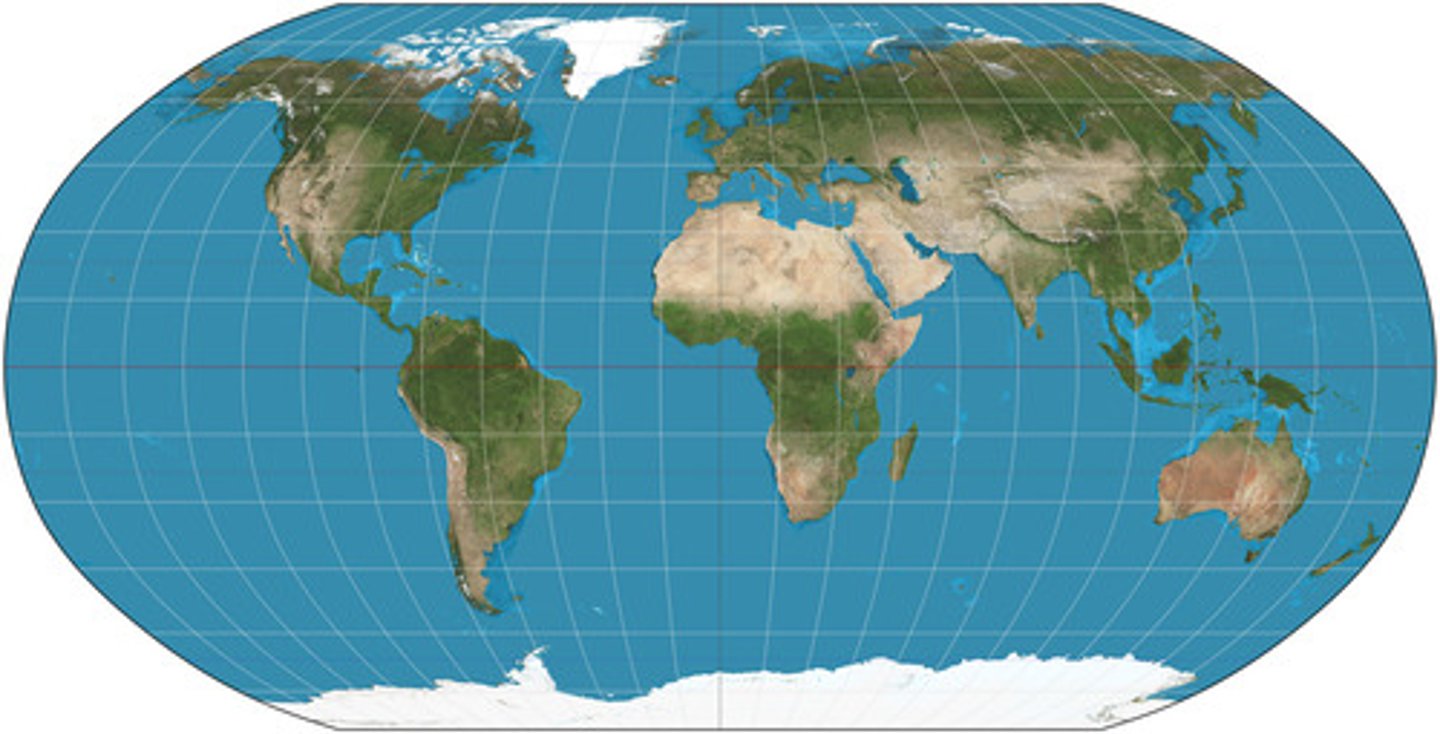
robinson projection
shows entire world, maintaining overall shape but isnt 100% accurate w/ shapes/sizes/everything
gall peters projection
looks stretched out & distorts shape of landmasses
WTR: gall sounds like TALL. think stretched out
reference map
People refer to for general info abt places
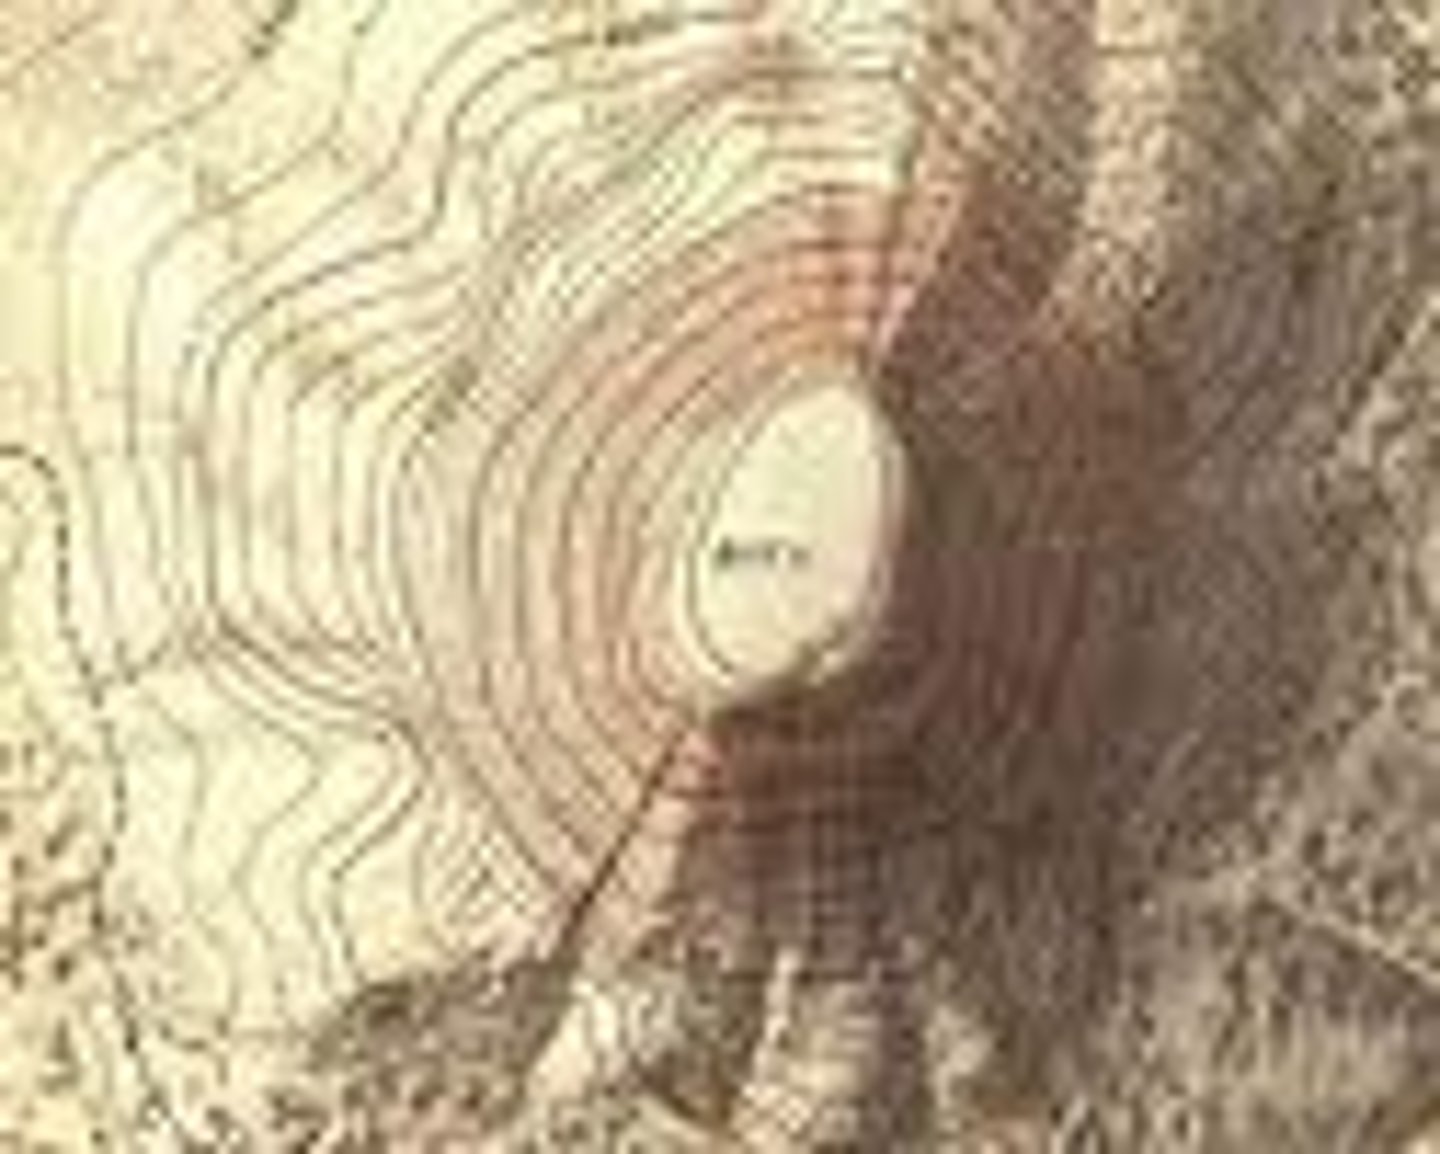
topographic map
contour lines to show terrain/elevation in area
absolute direction
exact direction someones heading
relative direction
given in relation to another object's current location (ie. im facing that door)
absolute distance
exact distance between 2 objects/places (ie. miles/km)
relative distance
approx measurement btwn 2 places
thematic map
spatial patterns of places & w/ quantitative data to display specific topic
ie. election results
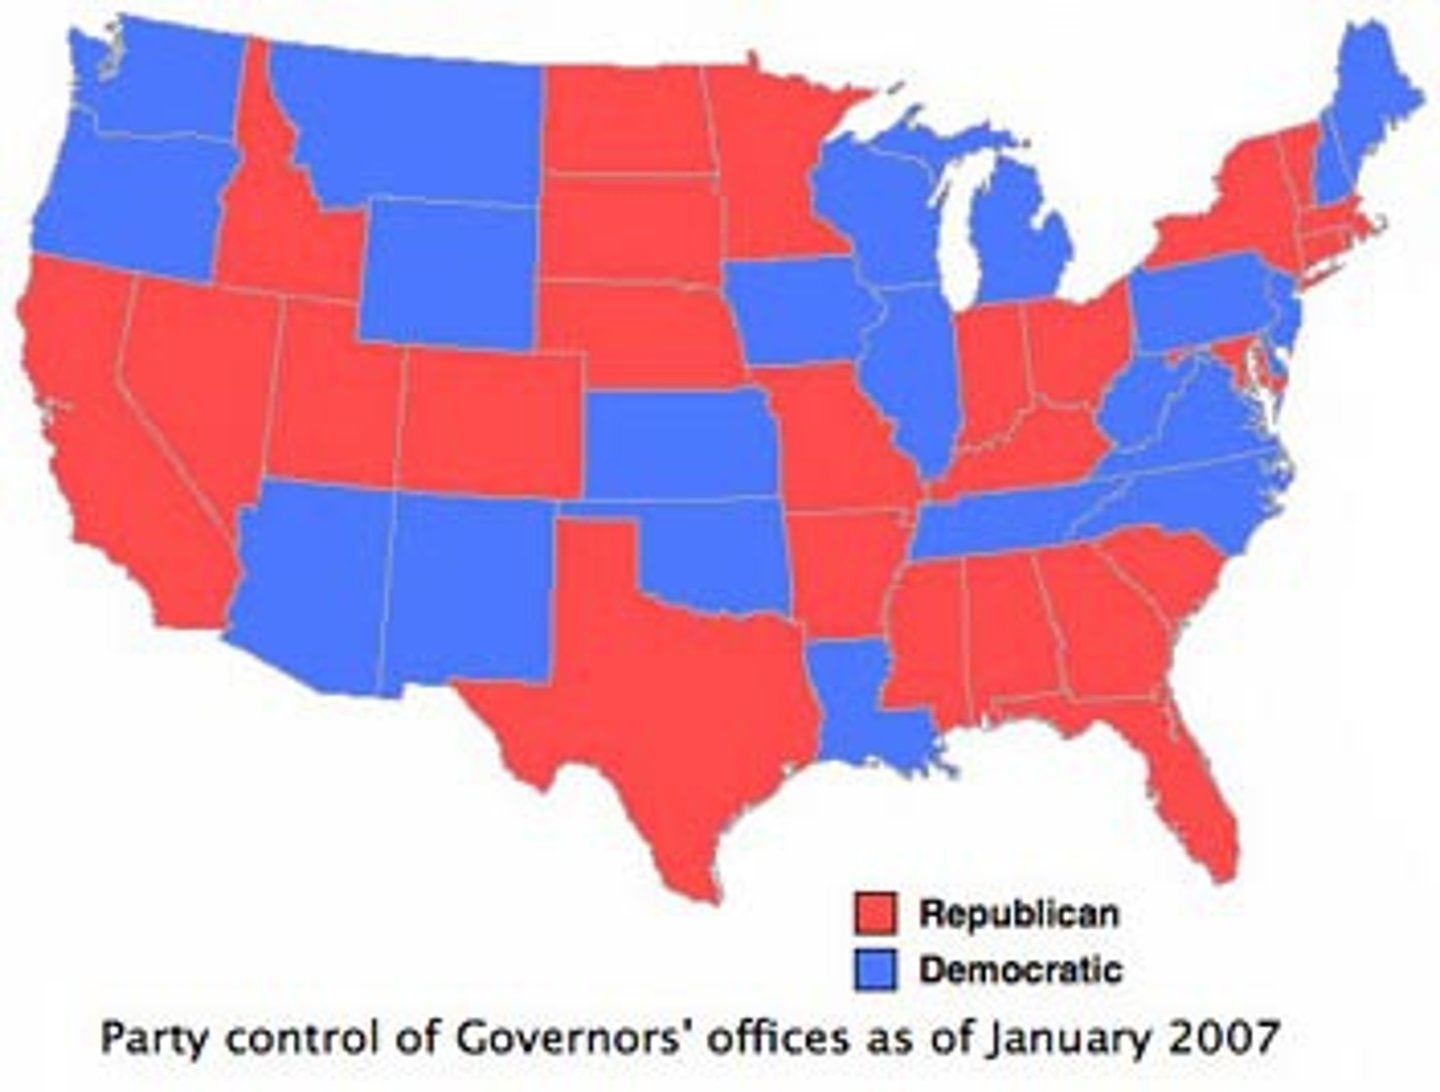
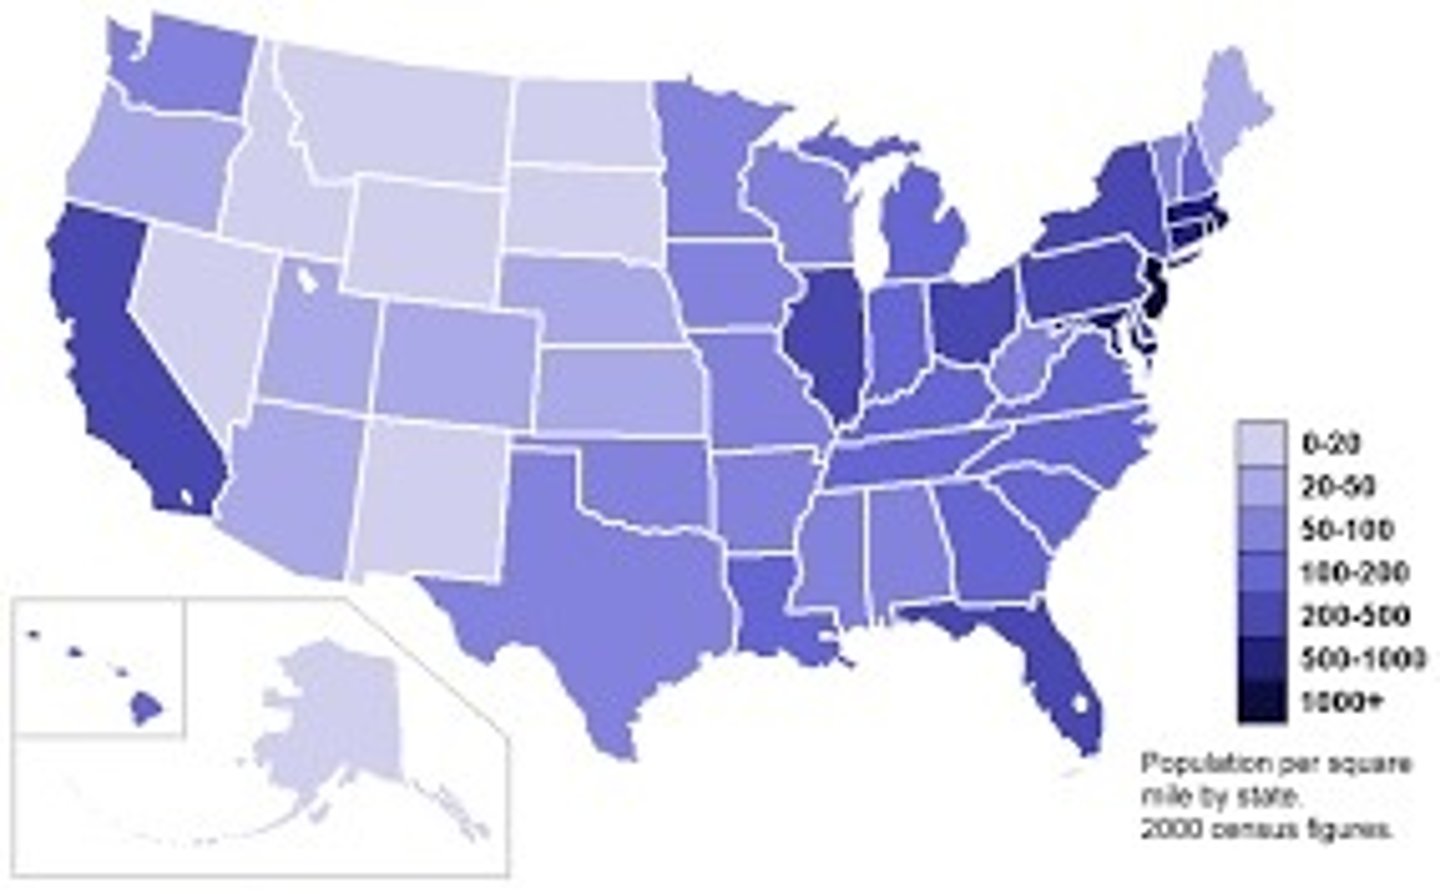
choropleth map
uses color to show data
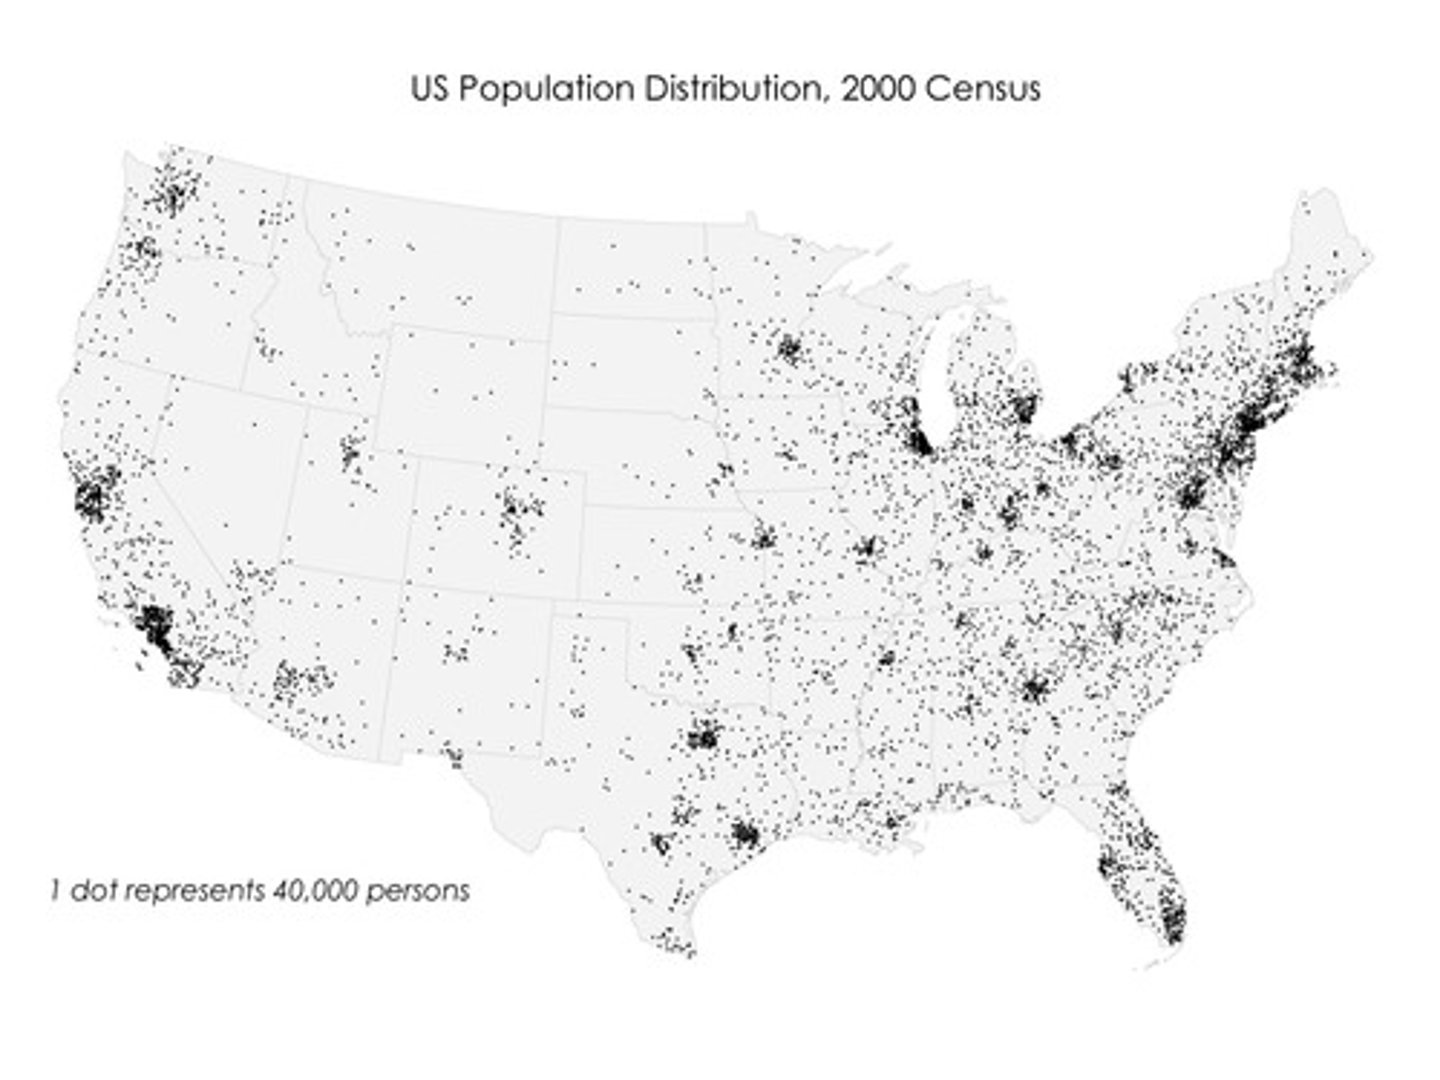
dot density map
dots to represent frequency of something in an area
spatial analysis
looking @ connection btwn places & features to explain human behaviour
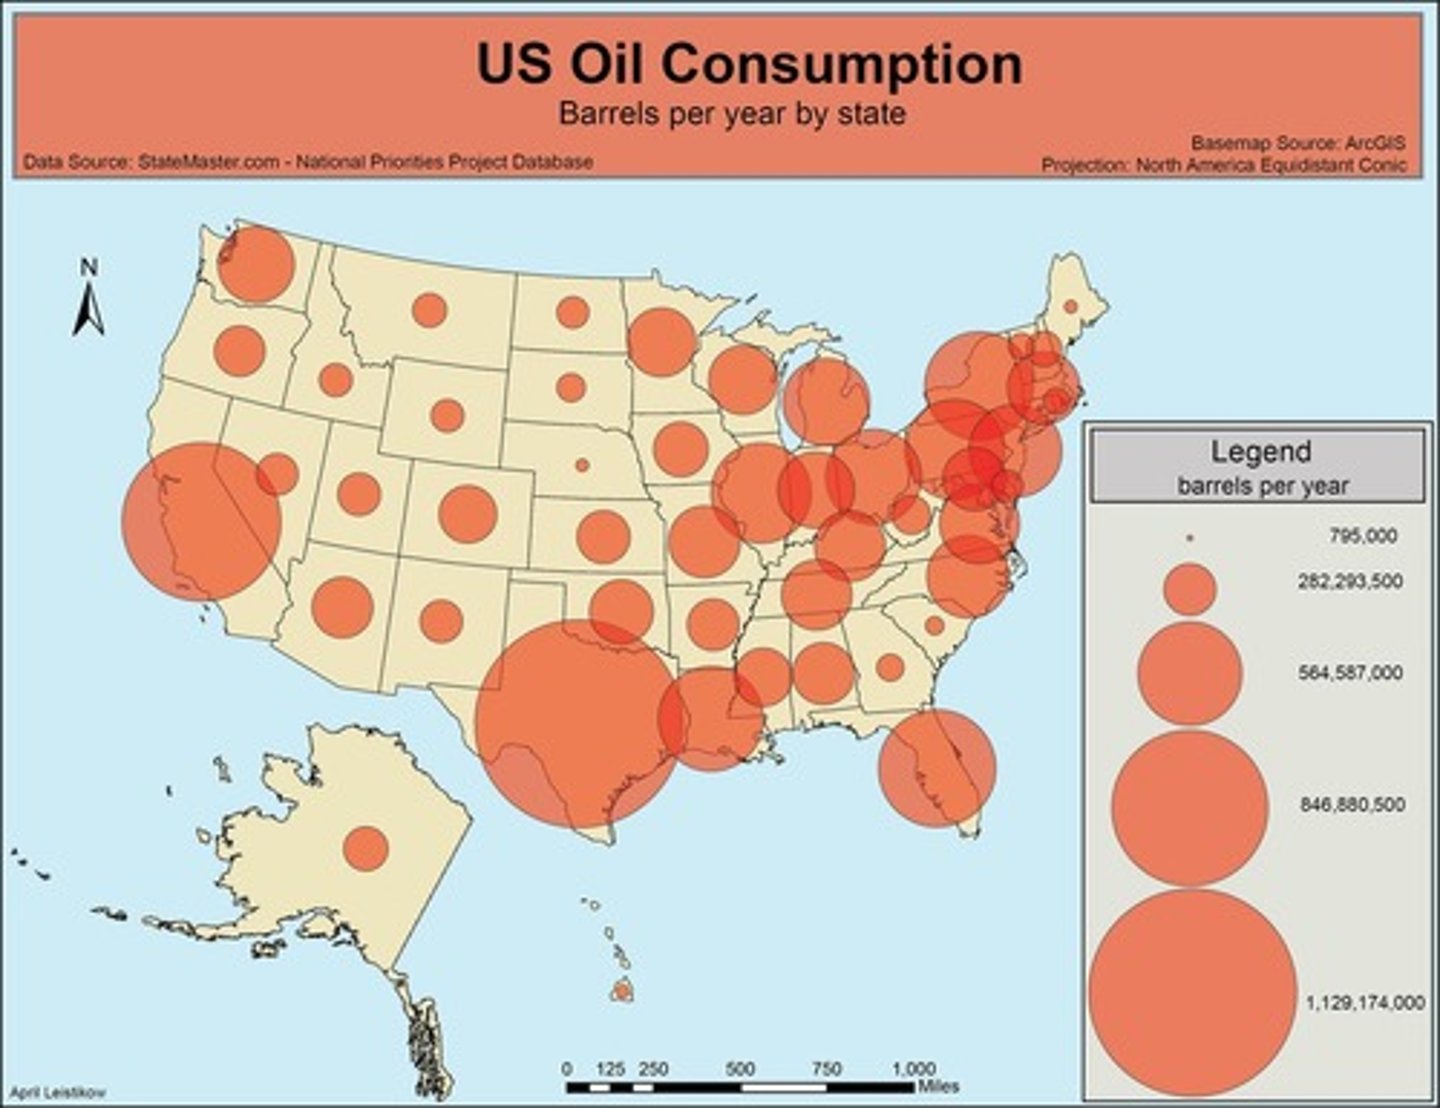
graduated symbol map
uses 1 symbol but w/ diff sizes to show frequencies
WTR: graduating = growing up = growing in size
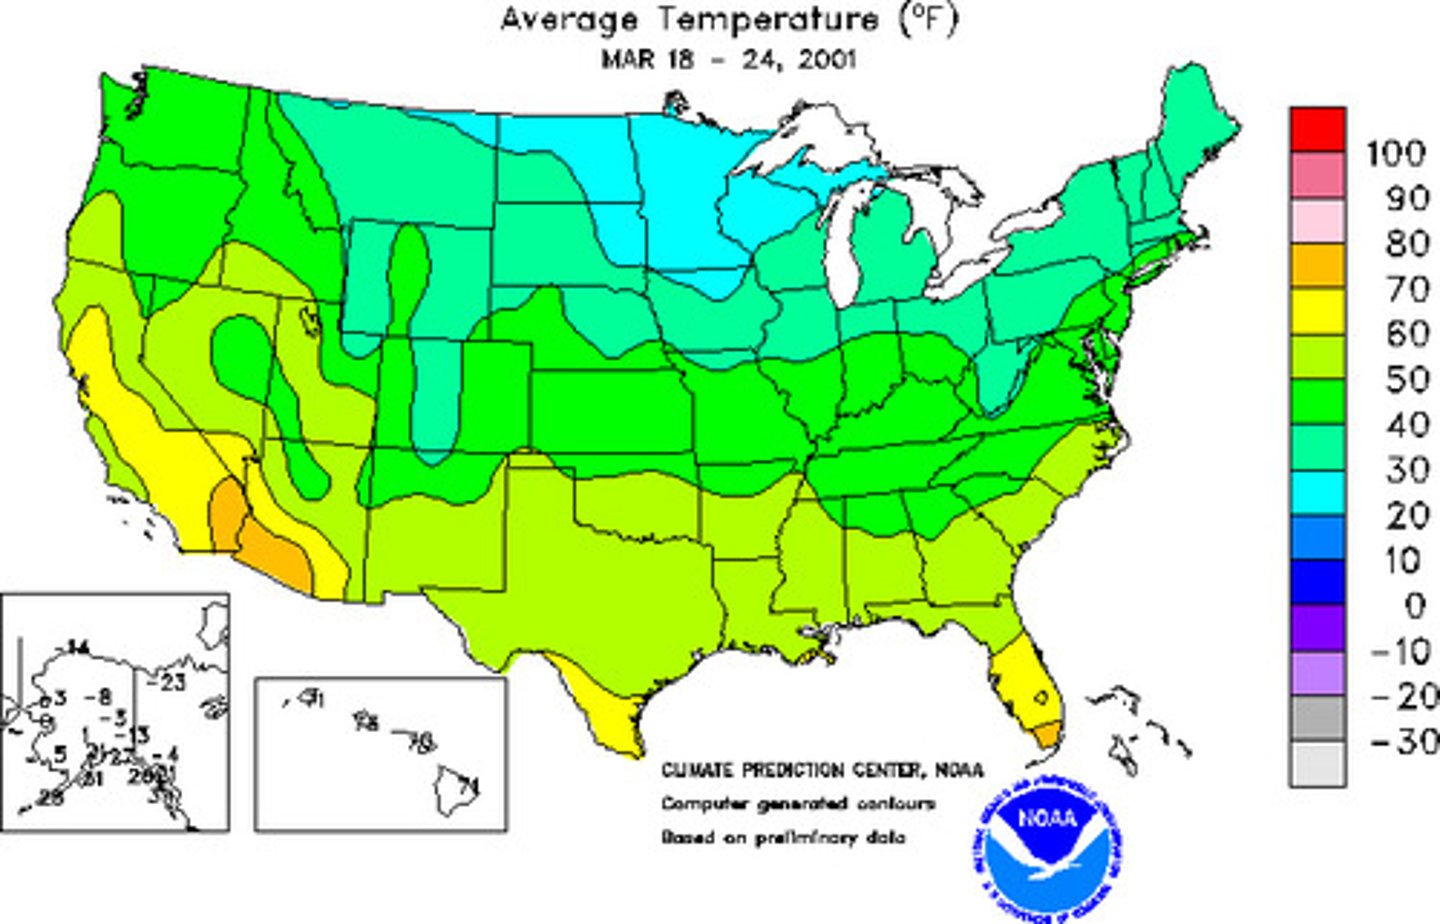
isoline map
lines connecting points w equal values
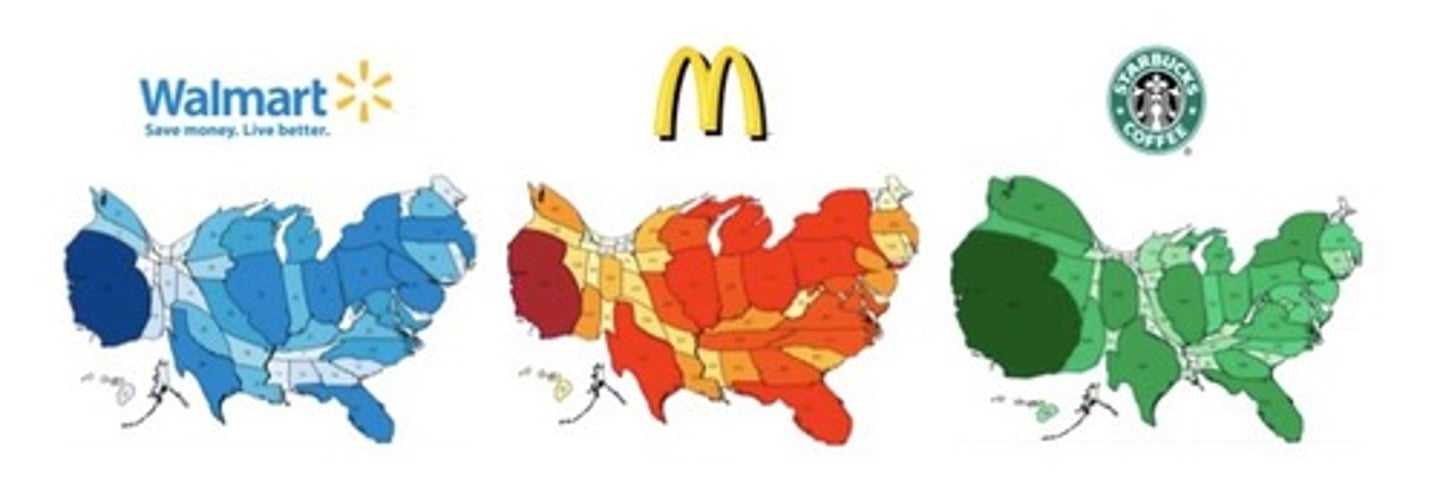
cartogram map
distorts sizes of places for a specific statistic
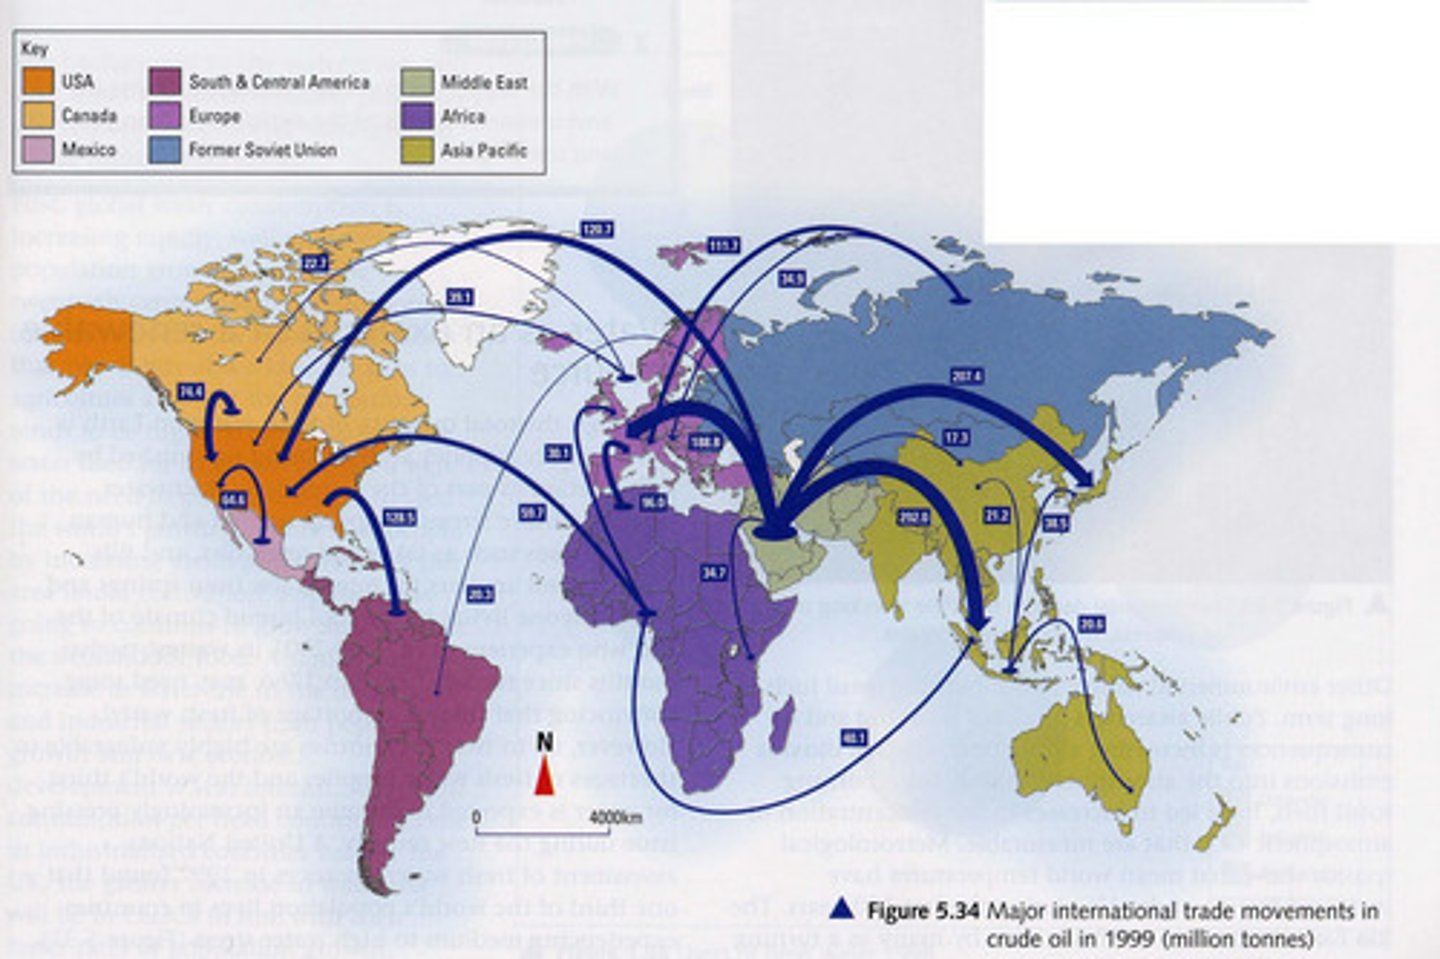
flow line map
uses lines to show movement between locations
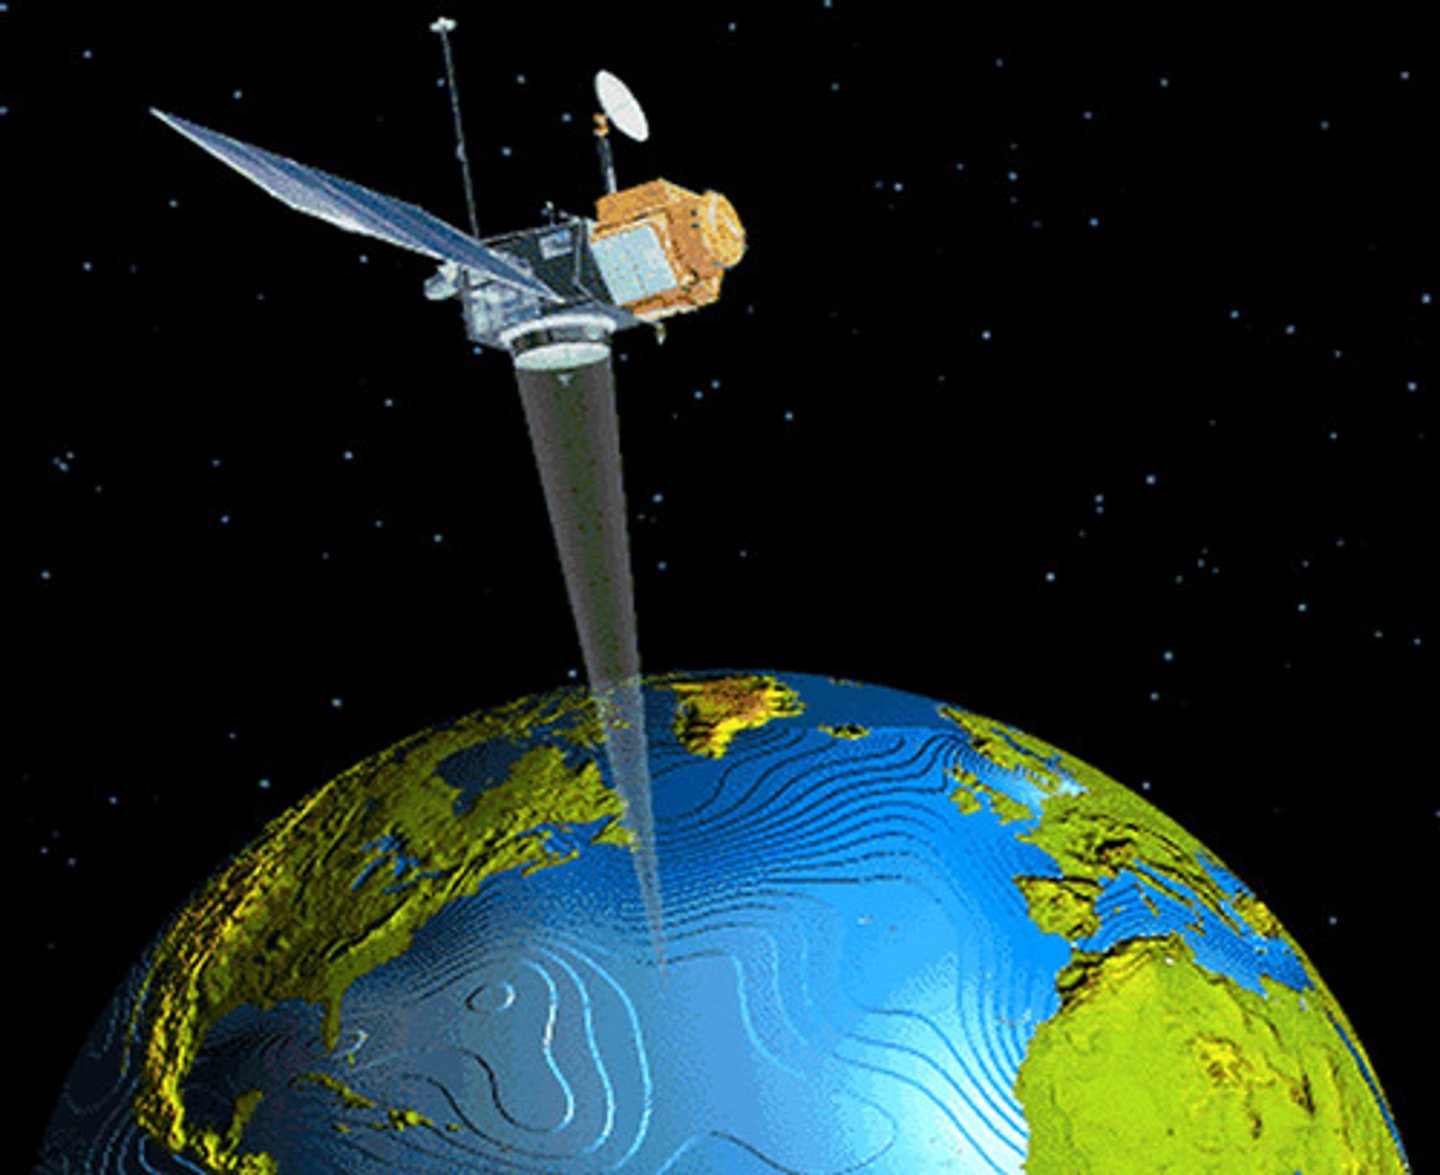
remote sensing
capturing images of earth from air devices, used for land use patterns, weather & natural disaster impacts
geographic information system
computer system organizing, storing, analyzing, displaying geographic data
global positioning system
precise position of something w/ satellites, receivers. used for navigation, tracking object position & location
geospatial technologies
technologies capturing images, recording positions, storing geographic data
field observations
observe ppl in real locations/situations (workplaces, homes)
personal interviews
asking specific questions to someone apart of specific culture
media reports
articles posted by newpapers/magazines
gov documents
reports, censuses, data, statistics posted by gov
travel narratives
writings describing author's journey to distant place, describing habits, ppl, wildlife
landscape analysis
field observation, aerial photography, spatial data to gather info on landscapes
census
gov doc collecting info/data on population, race, sex, age
physical characteristics
mountains, land, water
human characteristics
boundaries, culture, activities, settlements, language, religion
sense of place
emotions/attitudes connected to specific area
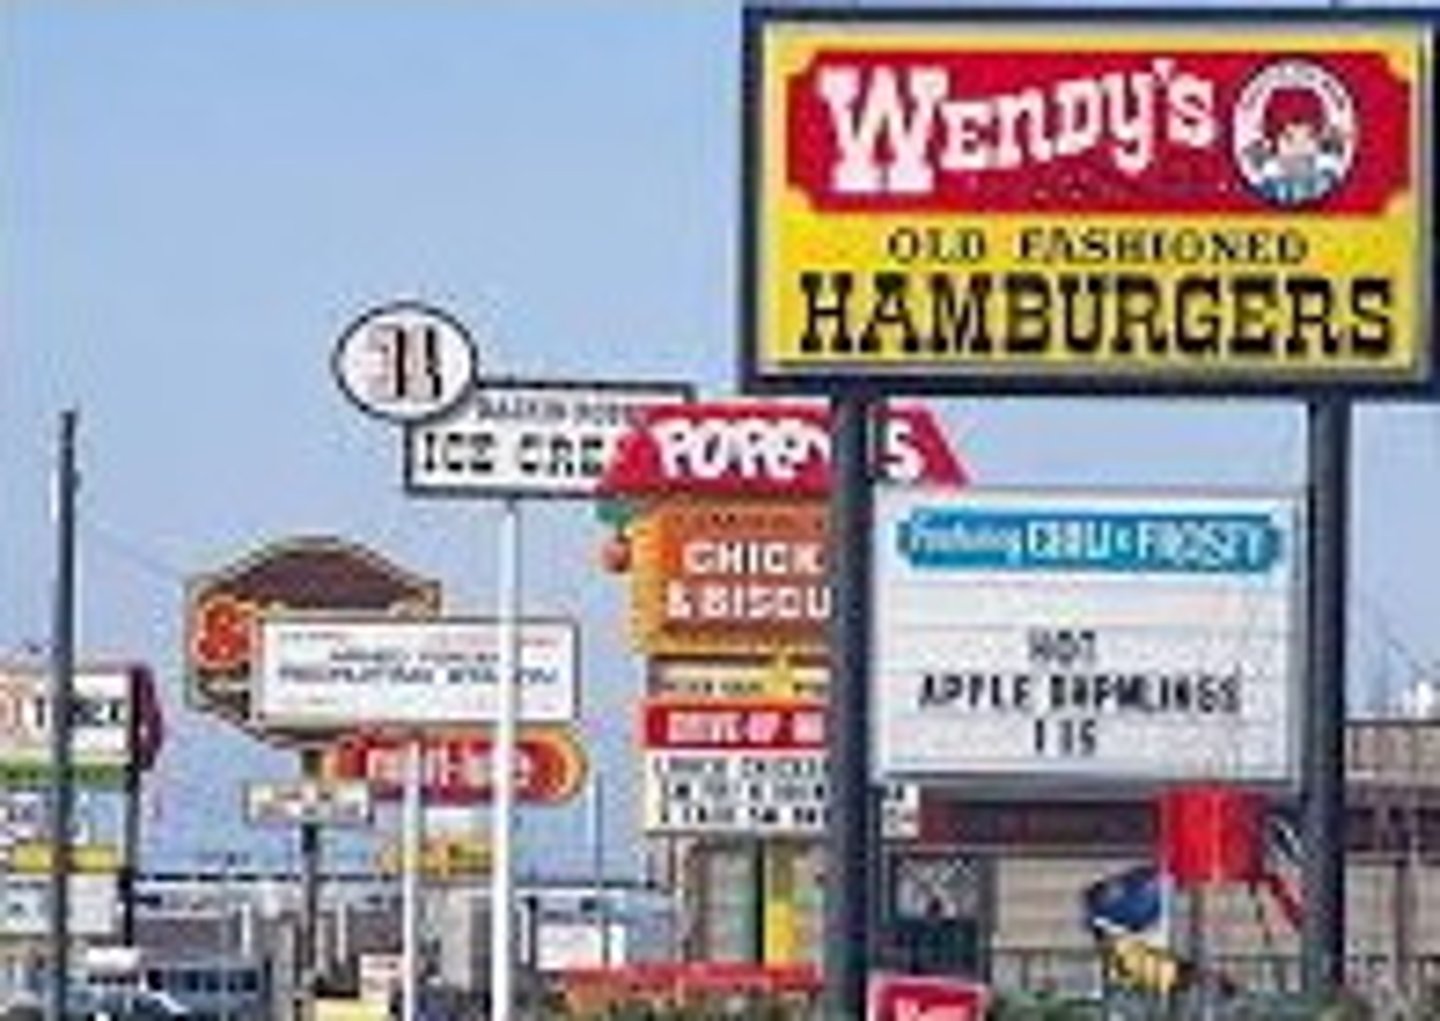
placelessness
loss of uniqueness in a certain place. everything looks same bc globalization & urbanization
spatial association
degree of which 2 or more places share similar distributions
time space compression
reduction of time it takes for something to get from one place to another bc technology & globalization
distance decay
farther 2 things are, less they'll interact (WTR: think of a best friend moving away)

environmental determinism
nat environmental determines culture (ie. antarctica is so so cold so there's no culture)
environmental possibilism
nat environmental can limit society but not culture (ie. las vegas was too hot to live but AC fixed that)
renewable resources
used over & over bc they can get replaced
nonrenewable resources
can't regrow/replace
sustainablity
using earth's resources in a way that will allow future generations to use them too
scale of analysis
observing data based on global/national/regional/local scale
subnational scale example
american states
agricultural land use
cultivation/farming
industrial land use
manufacturing, warehosuese
commerical land use
priv businesses & selling/buying products (retail)
residential land use
housing, apartments
recreational land use
spare time activities, sports, golf
transportation land use
parking lots, airports
small scale maps
large areas, less detail (zoomed SMALLY)
large scale maps
small areas, big detail (zoomed LARGELY)
global scale of analysis
entire world, but must show data EVERYWHERE
regional scale of analysis
continents & world regions
local scale of analysis
states, districts
national scale of analysis
one or more countries
formal region
official boundaries based on one or more shared characteristics (political entities)
functional region
organized around focal point, defined by activity happening across area (delivery areas, mall)
vernacular region
area ppl believe exists as part of cultural identity (middle east)
regional boundaries have the issue of
overlapping
logistic growth
rapid exponential population growth followed by a steady decrease in population growth until size lvls
urban sprawl
expansion of cities/urban areas into rural/undeveloped regions
ecumene
areas occupied by human settlement
subsistence agriculture
farmers provide for their family w/ agriculture
enclosure movement
enclosing common lands into individual holdings
primary sector
gets raw materials from natural environment
secondary sector
transforms raw materials to manufactured goods
tertiary sector
offer services rather products (ie. lawyer)
epimdemiology
studying distribution/patterns of disease in population
physical population density
# of ppl supported by arable land
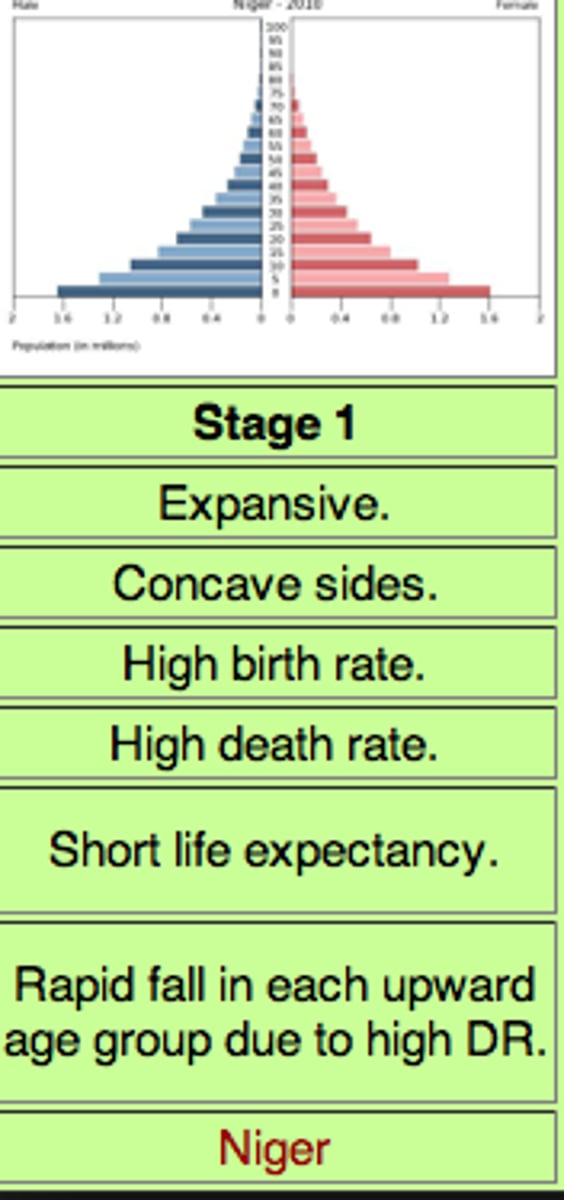
stage 1 of demographic transition model
high CBR and CDR. low growth.
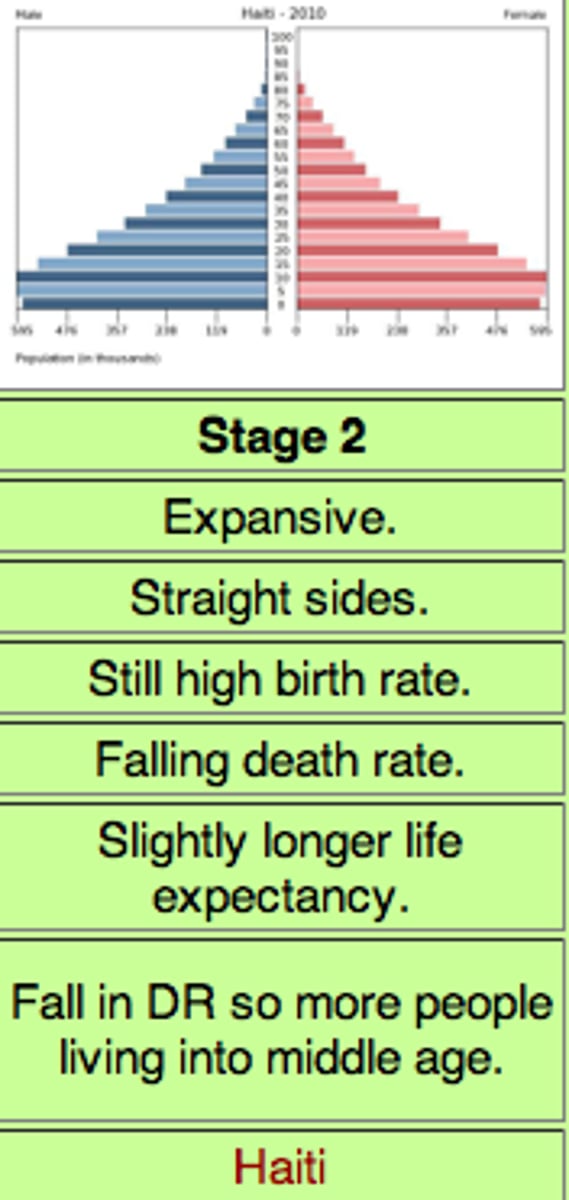
demographic transition model stage 2
high growth, starting to industrialize
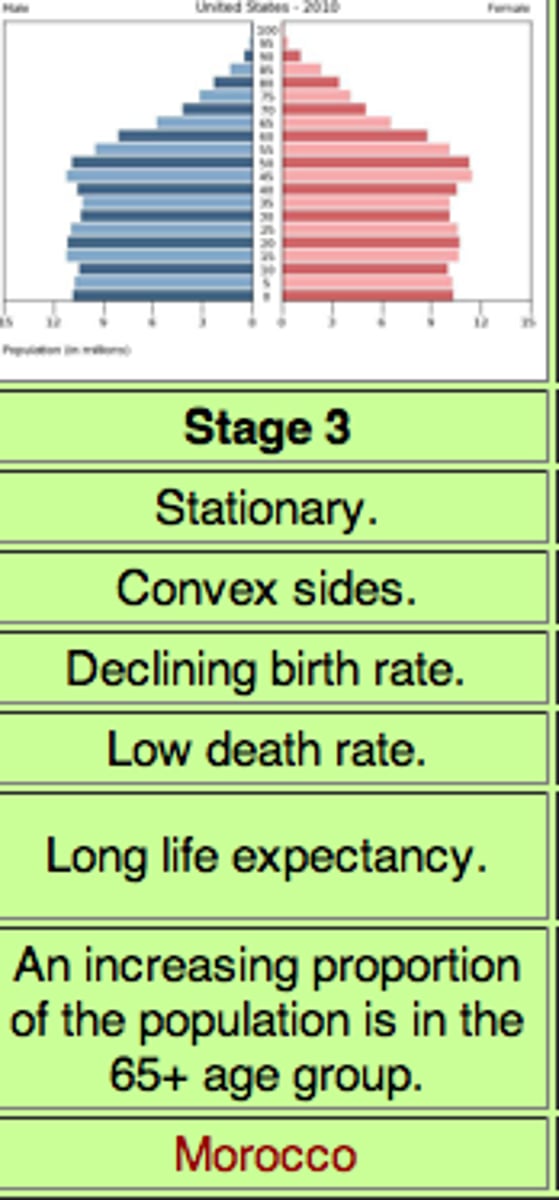
demographic transition model stage 3
decreasing growth, with declining CBR and CDR.
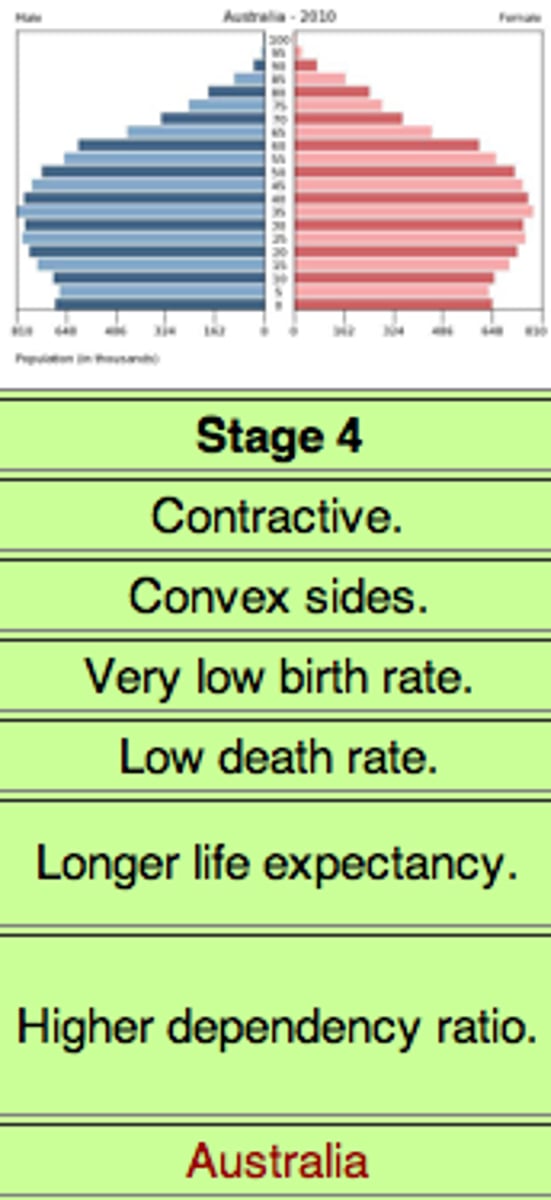
stage 4 demographic transition model
post-industrialized, low CBR, low CDR. modern countries
epidemiological transition model stage 1
epidemics, famine, death
epidemiological transition model stage 2
fewer deaths, less pandemics
epidemiological transition model stage 3
degenerative & chronic disease
epidemiological transition model stage 4
fighting degenerative disease
chain migration
migrate bc relatives/ppl/nationality or sponsoring a family members immigration
forced migration
migrant has no choice but move (slavery, child labor, trafficking)
internal migration
permanent move within same country
transhumance
seasonal movement of livestock migration
zero population growth
CDR = CBR
disposable income
income remaining after taxes & necessities to be spent
pandemic
worldwide spread of disease
epidemic
specific region spread of disease
endemic
local spread of disease (ie. malaria in africa)
degenerative disease
disease continuing to worsen over time
malthusian catastrophe
if population exceeds capacity, then war/famine/disease (aka checks) will happen bc population can't be supported. population then crashes back to normal levels
arithmetic growth
increase by a constant number each time (1,2,3,4)
exponential growth
increase by constant factor each time (1,5,25,125)
step migration
meet destination thru small steps (small town,big town, small city, large city)
gravity model
use of service @ a location is related to # of ppl there, and the distance ppl must travel to reach it.
replacement rate
# of births needed to maintain population @ current
elderly dependency ratio
over 65 ÷ 100 ppl btwn 15-64

child dependency ratio
under 14 ÷ 100 ppl btwn 15-64
agricultural density
# of farmers ÷ total arable land
arithmetic density
# of ppl ÷ total land area
physiological density
# of ppl ÷ total arable land