lecture 6- signficance testing, sampling distribitutions & Z-scores
1/11
There's no tags or description
Looks like no tags are added yet.
Name | Mastery | Learn | Test | Matching | Spaced | Call with Kai | Chat |
|---|
No analytics yet
Send a link to your students to track their progress
12 Terms
What are inferential statistics and what are the types?
uses random sample of data taken from population to help make inferences about population
Helps to reach conclusions beyond our data
2 types:
frequentist
Bayes
What is null hypothesis significance testing (NHST)?
We estimate the probability of a result occurring by chance, assuming the null is true. In order to conclude there is a difference, we want our result to be unlikely/surprising/extreme if we assume no difference in the population.
H0/null hypothesis = no difference
H1/Alternative hypothesis = difference
If p<.05, we reject H0
What are frequentist inferential statistics?
p-values
Effect sizes
Confidence intervals
P-values
Probability the result we found occurred by chance assuming the null hypothesis is true.
if p value is below .05, your result is statistically significant, and we can reject H0 and accept H1
The level at which we accept a result to be significant is the alpha level, usually set at 5%
Example- a p value of .0254 is 2.54% i.e. 2.54% chance results will occur, assuming H0
What are the 2 types of alternative hypotheses?
directional / one-tailed hypothesis - states what the direction of the effect/difference between variables will be. E.g. sleep deprivation will lead to worse memory.
Non-directional / two-tailed hypothesis - states that there will be an effect but doesn’t state the direction. E.g. sleep will affect memory.
What are effect sizes?
tell you about the magnitude of the difference (or similarity for correlation)
Cohen’s d is most popular
Effect sizes are placed into bins of small medium and large.
For cohen’s d = 0.2, 0.5, 0.8
d tells us size of difference, p tells us how surprising difference is
What is sampling distribution?
Theoretical concept that describes the distribution of sample means if an infinite number of samples were drawn from the population.
What is sampling variability?
Each time we draw a sample from the same population, we make different observations. Every sample will be slightly different. If we calculate stats, they are also different.
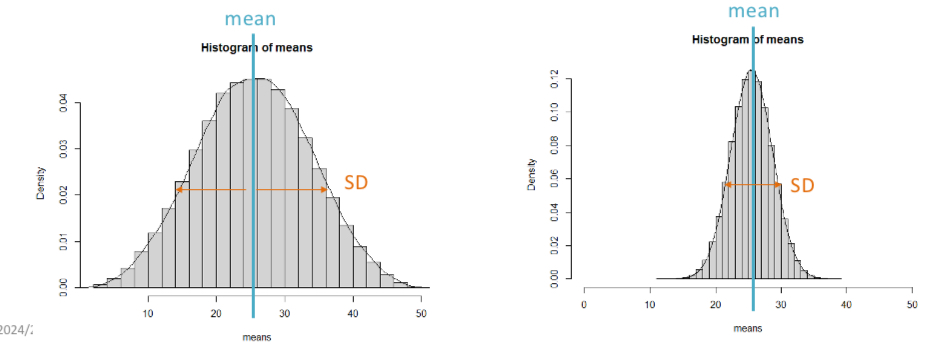
we can plot the means of a large number of samples and get a normal distribution. The mean of the sampling distribution will be the expected value.
The SD of the sampling distribution is the standard error (SE)
Smaller sample size= wider distribution and larger SE
Larger samples= better estimate of mean. Smaller = noisier
What is the central limit theorem?
Sampling distribution of the mean is always a normal distribution. It doesn’t matter what the distribution of values in the population is.
Allows us to connect sample scores to population values.
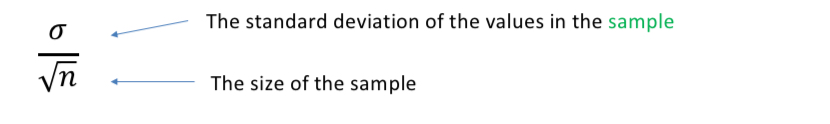
How do you calculate the standard error?
the mean of sampling distribution is the mean in the population
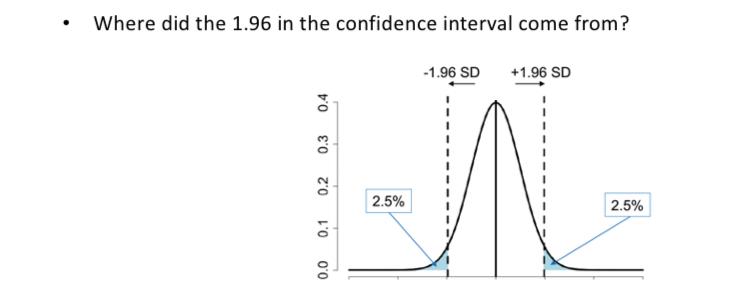
How do you calculate a confidence interval?
By adding and subtracting the 1.96 SEs from the sample mean. Computes a CI that has a 95% chance of covering the population mean.
in any normal distribution, 95% of the values fall within +- 1.96 SD of the mean
A normal distribution with a mean of zero and SD of 1 - standard normal distribution / z distribution
What is a z-transformation and Z-scores?
any normal distribution can be transformed into a standard normal distribution using a z-transformation
For every value, we subtract the mean of the distribution and divide by the SD
Resulting z-scores express the deviation from the mean in SDs
Z-scores allow us to compare scores on different scales.