Statistics - Assessing Normality
1/17
There's no tags or description
Looks like no tags are added yet.
Name | Mastery | Learn | Test | Matching | Spaced | Call with Kai |
|---|
No analytics yet
Send a link to your students to track their progress
18 Terms
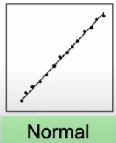
Another way to find a normal distribution
QQ Plot
QQ Plot takes precedence over histogram
TRUE
If R value is close to one…
It is linear
QQ Plot
How to confirm outliers
Use boxplot
What are QQ plots best for
Smaller data sets
What are histograms best for
Larger data sets
Number to determine unusual event
0.05
Normal curve characteristics
Area of the curve’s left and right BOTH equal 1/2
Normal curve’s highest point occurs at mean
TRUE
Area under the curve is
One
Normal Curve is symmetric or unsymmetric
symmetric
central limit theorem
states that regardless of underlying population’s shape, the sampling distribution of x becomes approximately normal as the sample size, n, increases
Sampling distribution
Every number comes from sample
Standard error of mean
Central Limit Theorem applies to
Large samples
You find SD of sampling distribution with what formula?
standard deviation divided by square root of sample size
What effect does sample size have on probability
Increase sample size → prob decreased due SD decreasing as sample size increases