NRES Exam II
0.0(0)
Studied by 24 peopleCard Sorting
1/68
Earn XP
Description and Tags
Last updated 11:57 AM on 4/11/23
Name | Mastery | Learn | Test | Matching | Spaced | Call with Kai |
|---|
No analytics yet
Send a link to your students to track their progress
69 Terms
1
New cards
Briefly describe the natural greenhouse effect and the enhanced greenhouse effect.
Natural greenhouse effect \= sun's warmth in a planet's lower atmosphere due to the greater transparency of the atmosphere to visible radiation from the sun than to infrared radiation emitted from the planet's surface
Enhanced greenhouse effect \= impact on the climate from the additional heat retained due to increased amounts of carbon dioxide and other greenhouse gases that humans have released into the atmosphere since the industrial revolution
Enhanced greenhouse effect \= impact on the climate from the additional heat retained due to increased amounts of carbon dioxide and other greenhouse gases that humans have released into the atmosphere since the industrial revolution
2
New cards
The IPCC’s AR6 models the change in annual average global surface temperature as observed and simulated using human and natural forcings as well as only natural forcings. Sketch the temperature change between 1850 and 2020 and approximate the observed data, the simulated data of human and natural forcings, and the simulated data for natural forcings alone. How do you interpret these
**How I interpret these are the global surface temperature was 1.09 [0.95 to 1.20] C higher in 2011-2020 than 1850-1900, with larger increases over land (1.59 [1.34 to 1.83 C] than over the ocean (0.88 [ 0.68 to 1.01] C)**
![**How I interpret these are the global surface temperature was 1.09 [0.95 to 1.20] C higher in 2011-2020 than 1850-1900, with larger increases over land (1.59 [1.34 to 1.83 C] than over the ocean (0.88 [ 0.68 to 1.01] C)**](https://knowt-user-attachments.s3.amazonaws.com/aa975570a467446b9c21549398c83574.jpeg)
3
New cards
Describe the trends in September Arctic sea ice area and surface ocean pH since the 1950’s.
September Arctic Sea area: declining
Surface ocean pH: declining→ ocean more acidic
Surface ocean pH: declining→ ocean more acidic
4
New cards
What is the change in ocean pH often called and what significance does it have for some organisms?
**Ocean acidification. Significance for some organisms include coral and plankton by making it harder to form their shells and skeletons, and existing shells may begin to dissolve. The low pH is what creates calcium carbonate which they use to build their skeletal structure.**
5
New cards
What is the overall trend in sea levels since 1900? Name two factors that have contributed to this pattern.
Sea level has risen from 0 mm to 190 mm
Attributed to global climate change by 1) thermal expansion of water in oceans 2) melting of ice sheets and glaciers on land
Sea levels have been rising over the last century, about 20 cm overall
Average global temp of the upper ocean has been rising at a rate of 0.11 C between 1971 and 2010. Increased warming is causing heat expansion in the water.
- more importantly, the sea level rise is due to melting glaciers and polar ice caps (warming seen in the last century is the most in over 3000 years)
6
New cards
Ripple et al. 2023 detail the types of positive feedback loops that are currently not well integrated into climate warming projections. Describe at least one of these feedback loops.
**Biotic/Abiotic feedback loops**
1. **Snow cover albedo**
2. **Sea ice albedo**
3. **Permafrost thawing**
4. **Peatlands smoldering**
5. **Wildfire**
6. **Cloud properties**
7. **Desertification**
8. **Forest dieback**
9. **Insect outbreaks**
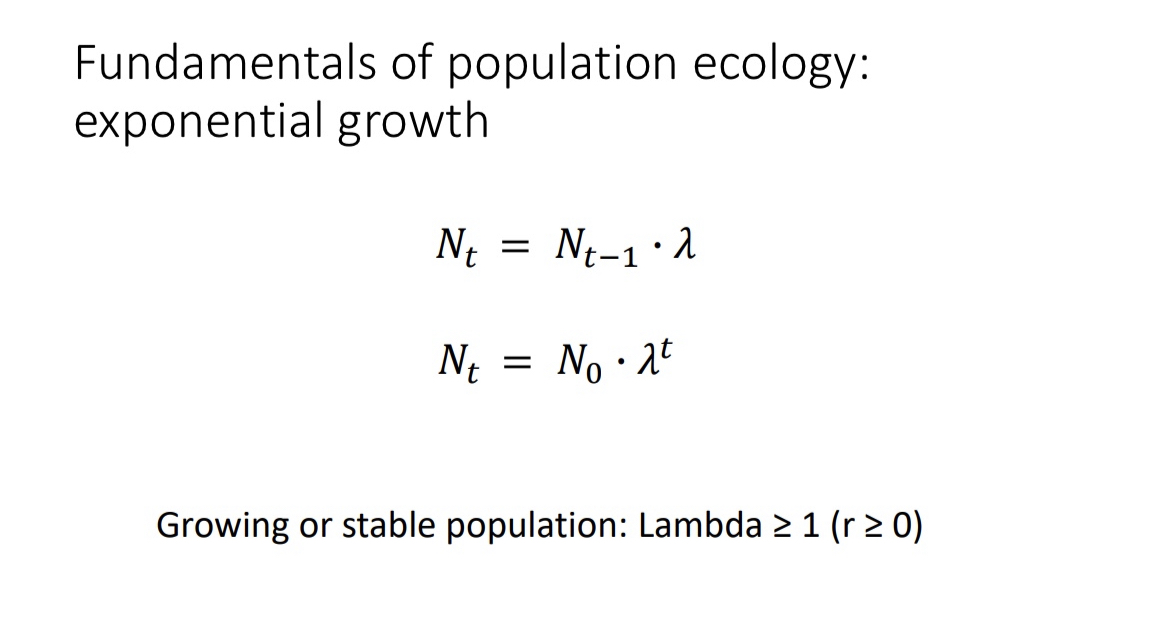
\
**Permafrost thawing- as permafrost thaws bacteria can break down that organic matter releasing CO2/methane into the atmosphere as greenhouse gasses CO2 or methane. Once in the atmosphere, these greenhouse gasses warm the planet creating a positive feedback loop that thaws more permafrost.**
1. **Snow cover albedo**
2. **Sea ice albedo**
3. **Permafrost thawing**
4. **Peatlands smoldering**
5. **Wildfire**
6. **Cloud properties**
7. **Desertification**
8. **Forest dieback**
9. **Insect outbreaks**
\
**Permafrost thawing- as permafrost thaws bacteria can break down that organic matter releasing CO2/methane into the atmosphere as greenhouse gasses CO2 or methane. Once in the atmosphere, these greenhouse gasses warm the planet creating a positive feedback loop that thaws more permafrost.**
7
New cards
The average temperature is expected to increase in the coming decades. What other feature of temperature variation is expected to change? What will this lead to in terms of weather? Why does this matter for organisms?
**Temperature variation is expected to change by extreme heat events.**
**What this means for the weather is spring temperature is coming in what we consider winter with the rain shirting up the mountain and heat shifting towards the poles.**
**What this means for organisms is sex determination in many reptiles is set by the max temp experiences during development (leads to single-sex broods); disease and parasite outbreaks associated with drought and temp; coral bleaching resulting from warmer waters; forests moving up.**
8
New cards
Describe three potential biotic responses to climate warming. Provide an example of each.
1) Migration \= how species will move to a different habitat that is more suitable for them.
- Example \= geese flying south for the winter
2) Extinction \= process of a species dying out.
- Example \= this could be due to a species being unable to migrate or adapt so they die off (Bushy wood rats)
3) Adaptation \= organism becomes better suited for an environment
Example \= camouflage
- Example \= geese flying south for the winter
2) Extinction \= process of a species dying out.
- Example \= this could be due to a species being unable to migrate or adapt so they die off (Bushy wood rats)
3) Adaptation \= organism becomes better suited for an environment
Example \= camouflage
9
New cards
What did Forister and Shapiro (2003) observe in three Central Valley counties and what do their results suggest about biotic response to climate change?
Forister and Shapiro monitored butterfly phenology over three decades
- observed the time of first flight in spring
- saw a shift in emergence of about 24 days early \= advance in phenology
as global temps rise, spring happens earlier in many places.
- butterflies responded to this early spring by moving up the time of their first flight (behavioral adaptation)
- observed the time of first flight in spring
- saw a shift in emergence of about 24 days early \= advance in phenology
as global temps rise, spring happens earlier in many places.
- butterflies responded to this early spring by moving up the time of their first flight (behavioral adaptation)
10
New cards
Briefly describe the Grinnell Resurvey project of small mammals in Yosemite National Park (Moritz et al. 2008). What did they aim to discover?
\
How did individual species’ distributions shift between sampling periods of the Grinnell Resurvey project? What population dynamics might underlie these responses?
\
How did individual species’ distributions shift between sampling periods of the Grinnell Resurvey project? What population dynamics might underlie these responses?
Grinnell project surveyed the abundance of small mammals in places that have been previously recored to see if there was a difference over time
- found an expansion and contraction of species at low and high elevations
One response to climate change for these small mammals \= shifting their geographic range and migrating to different elevations
- some species were unaffected which suggest mammals can respond in different ways \= unaffected species means they either adapted or the change didn't affect their climate envelope yet
11
New cards
What do Smith et al (1995) demonstrate about mammalian response to past temperature fluctuations?
Smith studied packrat middens \= provide info on past environments because they are a rich source of debris and feces
- packrats excrete a very concentrate urine which preserves the nest
Smith collected data on the diameter of the preserved fecal pellets and compared to its data on the mean annual temp in that area
- larger fecal pellet \= larger average body size
Cool temps \= packrats had larger body size
Smaller on average during warm temps
Change in body size is an important response to climate change across many taxa \= species that have the genetic diversity available to do so will fair better in response to climate change
12
New cards
Species have been responding to climate change throughout their evolutionary histories (e.g. Smith et al. 1995), why shouldn't we expect that they'll continue to respond through similar mechanisms? (Name three reasons).
1) Climate changes in the past were slower, adaptation in a population takes time and it could occur over generations
- climate stressors are too severe in one lifetime \= species might not be able to cope with it
2) Some populations lack the genetic diversity to select for advantageous traits, could be too specialized and sensitive to threats
3) Human population increases \= alter/degrade more habitat and landscape becomes increasingly fragmented
- if landscape is too disconnected a species may not be able to naturally respond by shifting its range
13
New cards
Describe four "climate-sensitive" conservation management approaches or practices, that is, practices that might help species respond to climate change.
1. Frequent threat reassessment; dynamic plans
2. Alleviate non-climate stressors
* threats to species = dynamic and occur simultaneously with other anthropogenic stressor (pollution and invasive species)
* most cost effective approach to take when it is possible to alleviate changes from the climate is to focus on reducing the incursion of the invasiveness or mitigating local pollutant
3. Reserve plans to accommodate shifts; corridors
1. Means preserving large landscapes that allow species to shift vertically or horizontally and promoting habitat corridors between reserves to aid in redistribution
4. Assisted colonization, managed relocation?
\
14
New cards
What is "assisted migration"? Describe a situation in which you would argue that this is a management tool that may be of benefit. Describe a situation in which you would be opposed to the use of this approach.
Assisted migration \= manage relocation
- act of deliberately helping plant and animal species colonize new habitats that they have not occupied before due to rapid environmental change
- can't adapt fast enough on their own
Beneficial: situation where the species is immobile or has a low change of relocating. Could be an endemic tree like the Joshua tree or a small species like the Yellow Legged Frog in the Sierras
Harmful \= major risk \= introducing ecologically harmful species
- if little evidence exists about what interactions this species might have with its new environment, managers should weigh the risks carefully
- could have deleterious effects on the process of the ecosystem by relocating a species
15
New cards
How is genetic variation hierarchically distributed, that is, at what scales can we study it?
Loci
Allele
Heterozygosity
Homozygosity
Genotype
Phenotype
A species pool of genetic diversity exists at three levels: genetic variation within individuals (heterozygosity), genetic differences among individuals within a population and genetic differences among populations
- each level in this hierarchy acts as a reservoir of genetic variation of potential importance to conservation, which can be studied to provide insight for conservation practice
16
New cards
What are the two primary (most common) measures of genetic diversity and what is the primary impact of losing diversity in these measures (according to Allendorf et al. 2008)
Heterozygosity: proportion of individuals in the population that are heterozygous --\> primarily impacts short term individual fitness
Allelic diversity: average number of alleles maintained in a population --\> primarily impacts long term adaptive potential of populations
Allelic diversity: average number of alleles maintained in a population --\> primarily impacts long term adaptive potential of populations
17
New cards
What are the two primary (most common) measures of genetic diversity and what is the primary impact of losing diversity in these measures (according to Allendorf et al. 2008)
**Primary measures of genetic diversity are:**
1. **Heterozygosity-impacts short term indiv. fitness**
2. **Allelic diversity- impacts long term adaptive potential of populations**
\
**Primary impact of losing diversity in these measures: reduced population size due to harvesting can also reduce the number of migrants and cause the loss of genetic variation between subpopulations.**
18
New cards
Show how the Hardy-Weinberg equation emerges from a simple Punnett square.
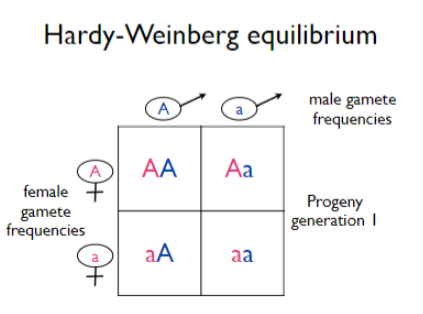
19
New cards
Review how to use the 'counting alleles' method to go from observed genotypes, to allele frequencies, to generating expected values using the Hardy-Weinberg equation
Counting alleles \= getting allele frequencies from observed genotypes
P \= freq (A) \= (2NAA+NAa) / (2N)
Q \= freq (a) \= (2Naa + NAa)/(2N)
p^2+2pq+q^2
P \= freq (A) \= (2NAA+NAa) / (2N)
Q \= freq (a) \= (2Naa + NAa)/(2N)
p^2+2pq+q^2
20
New cards
Consider one locus with two alleles, each allele is at a frequency of 0.5 and the population is in Hardy-Weinberg equilibrium (Ho \= He). A sudden shift happens and the population begins to fully inbreed (genotypic classes only mate with their own kind). Explain or diagram what shifts you expect in heterozygosity across the next two generations.
Lose 50 percent of heterozygosity at the first generation and 50 percent in the second
When a population is inbreeding we aren't losing alleles, but just distributing them in a different way
When a population is inbreeding we aren't losing alleles, but just distributing them in a different way
21
New cards
Briefly explain the concept of the extinction vortex and what factors (at least 4) contribute to it
Extinction vortex \= interaction between genetic and demographic factors that increases the probability of extinction for very small populations
1) small populations resorts to inbreeding
2) leads to inbreeding depression and genetic drift \= loss of genetic variability
3) results in less healthy/adaptable individuals \= lower reproduction and higher mortality rates
4) leading to an even smaller population that is impacted by demographic stochasticity (refers to the variability in population growth rates arising from random differences among individuals in survival and reproduction within a season)
22
New cards
What is the link between inbreeding or heterozygosity and extinction risk? Provide an example from the literature.
According to Saccheri et al. article "The relationship between the risk of local extinction and heterozygosity predicted by the global and sample models is shown in Fig. 2. The effect of heterozygosity on extinction risk is most pronounced in small, isolated populations, but even at intermediate levels of isolation extinction risk increases dramatically with decreasing heterozygosity in the smallest populations."
In the article, the Glanville fritillary butterfly is going extinct in many meadows it had previously occupied. They found that the extinction risk increased significantly with decreasing heterozygosity, an indication of inbreeding; and that heterozygous adults were more fit, had more offspring, and lived longer than homozygous individuals.
In the article, the Glanville fritillary butterfly is going extinct in many meadows it had previously occupied. They found that the extinction risk increased significantly with decreasing heterozygosity, an indication of inbreeding; and that heterozygous adults were more fit, had more offspring, and lived longer than homozygous individuals.
23
New cards
What is inbreeding depression? Provide examples of at least two individual fitness effects that commonly arise from inbreeding depression.
The reduced biological fitness in a given population as a result of inbreeding, or breeding of related individuals.
May contribute to: declines in metabolic efficiency, growth rate, and reproductive success, disease resistance, and an increased risk of extinction.
May contribute to: declines in metabolic efficiency, growth rate, and reproductive success, disease resistance, and an increased risk of extinction.
24
New cards
What is believed to be one cause of inbreeding depression, from a genetic perspective—that is, why are geneticists worried about the loss of heterozygosity?
**Increase in their probability of homozygosity by descent.**
\
**Loss of heterozygosity creates a cell more likely to show malignant growth (cancer) and manifest in reproductive fitness.**
\
**Loss of heterozygosity creates a cell more likely to show malignant growth (cancer) and manifest in reproductive fitness.**
25
New cards
In the examples of the Glanville fritillary butterfly and the prairie chicken, what individual fitness and population-level effects were correlated with reduced genetic variation (lower heterozygosity)?
Butterfly: lower adult longevity, lower larval group size, and a decrease in hatched eggs
Prairie chicken: dramatic population decline of males (from 84 in 1963 to 5 in 1998), decrease in incubated eggs / reduction in fertility, decrease in egg hatch / success
Prairie chicken: dramatic population decline of males (from 84 in 1963 to 5 in 1998), decrease in incubated eggs / reduction in fertility, decrease in egg hatch / success
26
New cards
What is genetic drift
Genetic drift is a change in the genetic composition of a population from generation to generation that takes place by chance, mostly in small and isolated populations. In small populations genetic drift can be the dominant evolutionary force - so strong that the population may not even respond to natural selection.
27
New cards
What is the effective population size (Ne)? Why it is important for biologists or managers to understand the effective size of a population?
Effective population size is the number of individuals in a population who contribute offspring to the next generation, it is typically smaller than the census size. It is the size of an ideal population that would experience the same rate of genetic change through drift as the observed population. Managers are concerned with effective population size because it's essentially the number of breeders, and that determines the rate of genetic drive, and the rate of lost diversity.
28
New cards
How is the effective population size related to the maintenance of heterozygosity in a population?
They are directly related. Heterozygosity will be lost as population numbers decline. Since the effective population size is usually smaller than the census size, declining populations means declining number of breeders.
To minimize inbreeding, and heterozygosity loss, populations need to be maintained at a minimum effective size of 50 to ensure short-term survival. But, managers should aim for a population size of 500 for sustainable long-term adaptability, and maintenance of heterozygosity
To minimize inbreeding, and heterozygosity loss, populations need to be maintained at a minimum effective size of 50 to ensure short-term survival. But, managers should aim for a population size of 500 for sustainable long-term adaptability, and maintenance of heterozygosity
29
New cards
Review how to quantify the loss of heterozygosity over time in populations of different effective population sizes.
Ht \= (1-1/2Ne)^t * H0
30
New cards
Of the two primary measures of genetic diversity, which will decay more rapidly in a population bottleneck?
Allelic diversity will decay more rapidly, and rare alleles will be lost quickly, particularly with a small effective population size (Ne)
31
New cards
What is the probability of losing an allele that occurs at a frequency of 0.7 in a population if we have an effective population size of only 5 individuals?
prob of losing an allele \= (1-p)^2Ne
32
New cards
What is a genetic bottleneck? What two factors determine the magnitude of loss of genetic diversity as a population goes through a bottleneck?
A genetic bottleneck is a sharp reduction in the size of a population due to environmental events (such as earthquakes, floods, fires, disease, or droughts) or human activities. It happens when a large population (and its respective gene pool), are funneled down to a very low population size, coming out the other end with low genetic diversity. The magnitude of loss has to do with how narrow the "bottleneck" was (how severe) and the length of the time of the "bottleneck" (how long the event took place
33
New cards
What are the basic assumptions of the Hardy-Weinberg Principles (name at least 4)? Chose two of these and explain how "violation" of this assumption would cause a change in genetic variation from one generation to the next.
1) Random mating
2) No mutation
3) Large population size (no drift)
4) No natural selection
5) No immigration
Violating random mating by having a population inbreed with other would result in a loss of genetic variation from one generation to the next. (loss of heterozygosity)
Violating a large population size by having a small population creates drift and less genetic variation
34
New cards
Name three factors that can create a mismatch/disparity between the census size of a population (Nc) and its effective size (Ne). Choose one of these and explain why/how it may lower the effective size of a population in relation to the census size of that population.
1) sex ratio
2) unequal family size
3) population size fluctuation
Uneven sex ratio- having more males than females and vice versa can result in a different effective population size since more or less individuals will be able to reproduce which is different than the census size
2) unequal family size
3) population size fluctuation
Uneven sex ratio- having more males than females and vice versa can result in a different effective population size since more or less individuals will be able to reproduce which is different than the census size
35
New cards
What type of mating system would be expected to lead to naturally low effective population size relative to census size?
**Polygynous mating system (1 male:100 females)**
***think elephant seals**
***think elephant seals**
36
New cards
Review how to estimate the effective size of a population given the number of males and females in the population.
Ne \= (4Nm * Nf) / (Nm + Nf)
37
New cards
The Nevada Department of Wildlife's Game Chief has asked for your advise in planning a big horn sheep translocation effort. Citing Singer et al. 2000 as your primary reference, list your top three recommendations. Given that the Game Chief is not a population geneticist, provide a brief and simple explanation of the rationale behind each of your recommendations.
The translocated individuals should come from a relatively large indigenous source of healthy, fit animals that are reproducing. The number of individuals translocated should be large (\>40) to provide genetic diversity, or a large founder size. Migratory corridors should be put into place to provide for movement between localities to allow for gene flow between populations and avoid inbreeding.
38
New cards
Current levels of genetic variation are the result of ongoing processes, but also historic biogeographic factors. Explain the general biogeographic history of most species in North America in relation to glacial retreat over the past \~20k years. How is this history expected to have impacted levels of genetic diversity within and among populations in previously glaciated versus non-glaciated areas? Can you provide an empirical example?
**General biogeographic history: From persistent to expansion populations; expansion populations show low diversity and low subdivision within populations.**
**Reduced genetic diversity in prev-glaciated regions because there has no been enough time since colonization to reach mutation-drift equilibrium.**
\
**Example: Scandinavian carnivore populations (gray wolf, brown bear, lynx) have relatively low levels of mitochondrial diversity.**
**Reduced genetic diversity in prev-glaciated regions because there has no been enough time since colonization to reach mutation-drift equilibrium.**
\
**Example: Scandinavian carnivore populations (gray wolf, brown bear, lynx) have relatively low levels of mitochondrial diversity.**
39
New cards
Allendorf et al. (2008) present numerous case studies concerning how overharvest or poorly planned harvest can have unintended genetic impacts on populations. Describe one of these cases and be sure to clearly identify the evolutionary process(es) that have been impacted, resulting in genetic or phenotypic change.
Overharvest can decline a population drastically resulting in loss of genetic variation. Loss lowers gene flow which reduces population connectivity
Unregulated harvest can lead to physiological changes in populations
\
I.e North Atlantic Sea cod *Gadus morphus*: decline in genetic variation followed by genetic swamping (OG genetic lost). Causes by evolutionary process of reduced effective population size and reducing population connectivity.
Unregulated harvest can lead to physiological changes in populations
\
I.e North Atlantic Sea cod *Gadus morphus*: decline in genetic variation followed by genetic swamping (OG genetic lost). Causes by evolutionary process of reduced effective population size and reducing population connectivity.
40
New cards
What is the major histocompatibility complex and what do we generally expect the relationship to be between heterozygosity and individual fitness? Why? What do we know from at least part of one mouse study (Penn et al. 2002) concerning this relationship?
major histocompatibility complex (MHC): group of genes that code for proteins found on the surfaces of cells that help the immune system recognize foreign substances.
\
individuals heterozygous at MHC loci are able to respond to a greater range of pathogen peptides than homozygotesand, consequently, benefit from increased resistance to pathogens.
\
individuals heterozygous at MHC loci are able to respond to a greater range of pathogen peptides than homozygotesand, consequently, benefit from increased resistance to pathogens.
41
New cards
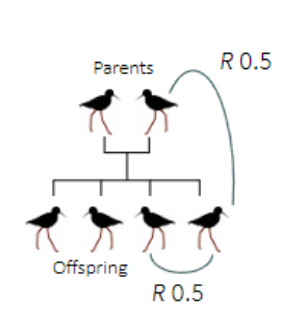
Use a simple graphic to show the generally expected relationship between relatedness of parents and fitness of offspring with various points labeled with the outcome of such parental crosses.
\
42
New cards
What is outbreeding depression? Provide an example from the literature.
Outbreeding is when breeding between organisms from different populations occurs. Outbreeding depression is when a cross between two individuals from different populations, who themselves are phenotypically adapted for their environments in different ways, produces an offspring that is intermediate in phenotype and not suitably adapted to live in either environment.
Outbreeding depression is a reduction in reproductive fitness due to crossing of individuals from two genetically differentiated populations. This occurred with Ibex in Czechoslovakia. The species was hunted to near extinction, so individuals were translocated from several locations to augment and save the population. The crossing of local individuals with those from quite far away (and from a warmer, drier climate) resulted in all of the young being born in February and consequently dying. This was a massive demographic hit, and the species went extinct.
Outbreeding depression is a reduction in reproductive fitness due to crossing of individuals from two genetically differentiated populations. This occurred with Ibex in Czechoslovakia. The species was hunted to near extinction, so individuals were translocated from several locations to augment and save the population. The crossing of local individuals with those from quite far away (and from a warmer, drier climate) resulted in all of the young being born in February and consequently dying. This was a massive demographic hit, and the species went extinct.
43
New cards
The Florida Panther is often referred to as an example of "genetic rescue". Briefly describe the status of Florida Panthers in the early 1990's in terms of individual fitness and long-term probability of persistence of the population. What happened in 1995? List at least three population and/or genetic outcomes from the effort to "genetically rescue" Florida Panthers.
In the 1990's FL panthers were experiencing inbreeding depression with an effective population size (Ne) of 16 older adults. They had many deformities in the populations, and overall were going to be extinct very soon. In 1995 female TX panthers were brought in to rescue/augment the population. The TX species was chosen for its close genetic connectivity. The individuals interbred, and the translocation was considered a success.
Outcomes:
1) mean age went down as the population reproduced more
2) the add-mixed hybrids have higher survivability, and the population showed fewer birth defects
3) there was an increase in the % of heterozygous individuals from 18 to 25 in 10 years
Outcomes:
1) mean age went down as the population reproduced more
2) the add-mixed hybrids have higher survivability, and the population showed fewer birth defects
3) there was an increase in the % of heterozygous individuals from 18 to 25 in 10 years
44
New cards
Did the effort to "rescue" the Florida panther succeed? Give one argument that reflects the possible success of this case and give one argument that reflects the possible failure of this case.
The effort to "rescue" the Florida Panther did not succeed. The Florida Panther (CFP & EVG) began to breed with the Texas Panther (TX) to produce CFP-TX and EVG-TX. There is no back crossing back to the Florida Panther, only to the Texas Panther. Yes, the Florida Panther was able to continue reproducing, but it was no longer a "true" Florida Panther.
45
New cards
What does Fst measure? What is the range of values for this measure (using the equation presented in class) and what is the interpretation of each extreme of this range?
Fst is a means to describe how genetic variation (allele frequency) is partitioned in a population. Fst measures the divergence among subpopulations. The range of values that comes out of this model are between 0-1. 0 being no differentiation and 1 being complete differentiation.
46
New cards
Review how to calculate Fst given allele frequencies at a locus with two alleles.
Fst \= 1 - (Hs / Ht)
Hs \= average expected heterozyosity across subpopulations
Ht \= expected heterozygosity if the entire population was panmictic
Hs \= average expected heterozyosity across subpopulations
Ht \= expected heterozygosity if the entire population was panmictic
47
New cards
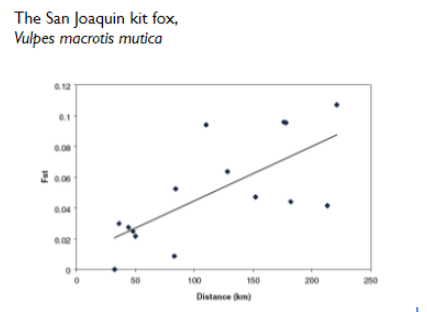
Graph the relationship between Fst and spatial distance exhibited by the San Joaquin kit fox. What is this general relationship typically called and what does it tell us about this species?
The relationship is called "Genetic Isolation by Distance". It is a term used to describe the accumulation of local genetic variation under geographically limited dispersal. This model is used to determine the distribution of gene frequencies among subpopulations that may or may not be experiencing geographic isolation.
The graph of this species shows that some subpopulations at a greater distance from each other have a higher FST, and some subpopulations that are equidistant have differing FST values. The points that seem to "fall off" the line most likely have a barrier to gene flow (like a road)
The graph of this species shows that some subpopulations at a greater distance from each other have a higher FST, and some subpopulations that are equidistant have differing FST values. The points that seem to "fall off" the line most likely have a barrier to gene flow (like a road)
48
New cards
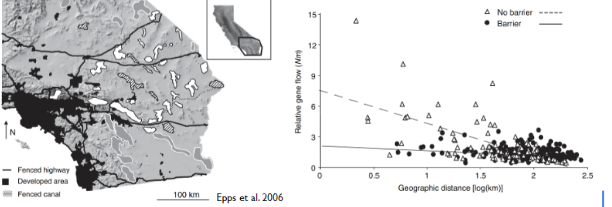
Use a graph of the relationship between relative gene flow and geographic distance, as in Epps et al. 2006, to show how they inferred that barriers on the landscape were inhibiting gene flow between populations of bighorn sheep.
High FST = low # of migrants (Nm)
Low FST = high Nm
The points that represent where there are barriers show low relative gene flow, as compared to subpopulations that do not have barriers where relative gene flow is generally higher.
\
****Barriers on the landscape were inhibiting gene flow between bighorn sheep by reducing population/genetic connectivity which reduced gene flow .**
49
New cards
Provide a definition of hybridization and introgression? What is the important distinction between these?
Hybridization: interbreeding of individuals from genetically distinct populations \n \n Introgression: genes of one group being incorporated into the genome of a distinct group \n \n After contact between the species and mating occurs, the F1 generation hybrid is either sterile due to outbreeding depression, or fertile; at which point the fertile hybrid F1 breeds with one or the other of its parent species, called "backcrossing". This is the point where genes get incorporated into one of the species, or introgression occurs.
50
New cards
What other threats to populations/species have we studied that might augment the risk of non-natural rates of hybridization?
Anthropogenic threats like environmental pollution and pollutants originating in human activity (man made disasters like oil spills) that can cause backcrossing and introgression
51
New cards
Provide an example from the literature of anthropogenically-induced hybridization without introgression (Allendorf's Type 4). Even if introgression is not possible between a native and invasive species, what other demographic or ecological factors may still have a negative impact on the native species? Describe at least two.
1. In the west and northwest, native bull trout are breeding with non-native brook trout to create a sterile bull/brook hybrid. No introgression, so there isn't any backcrossing since it is sterile. The genomes of the bull trout are remaining intact, so there isn't concern about pollution of the genetic makeup of the species. However, hybrids tend to be larger so they can be better competitors for many resources. Also, there could be a demographic issue eventually because the bull trout gametes aren't being passed on, they are competing with the brookies to get their gametes in the next generations. Managers are seeing a decline in native bull trout. The approach they are currently taking is to remove both brookies and hybrids. This makes sense to me as they are both a threat to the bull trout, and together they create twice the pressure, removing only one won't be as effective
2. \
52
New cards
From Dr. Galla’s presentation, what is the Treaty of Waitangi and how did the different interpretations lead to ongoing conflict and breach of this treaty?
**Treaty of Waitangi: historic pact between Great Britain and a number of New Zealand Maori tribes of North Island. It was proposed to protect Maori rights and was the immediate basis of the British annexation of New Zealand.**
\
**The different interpretations were…**
\
**In the English ver, of the Treaty, Maori give the British Crown ‘absolutely without reservation all the rights and powers of sovereignty’ over their lands, but are guaranteed ‘undisturbed possession’ of their lands, forests, fisheries, and other properties.**
\
**In the Maori ver. Maori give the Crown ‘kawanatanga katoa’- complete governorship. And they guaranteed tino rangatiratanga- the unqualified exercise of chieftainship over their lands, dwelling places, and all other possessions**
\
**The different interpretations were…**
\
**In the English ver, of the Treaty, Maori give the British Crown ‘absolutely without reservation all the rights and powers of sovereignty’ over their lands, but are guaranteed ‘undisturbed possession’ of their lands, forests, fisheries, and other properties.**
\
**In the Maori ver. Maori give the Crown ‘kawanatanga katoa’- complete governorship. And they guaranteed tino rangatiratanga- the unqualified exercise of chieftainship over their lands, dwelling places, and all other possessions**
53
New cards
What two dominant factors led to biodiversity loss of birds in Aotearoa New Zealand?
1. **Population bottlenecks: inbreeding depression, loss of diversity, minimizes adaptive capacity)**
2. **Introduced species: i.e rats**
54
New cards
What three ways did Dr. Galla use to estimate genetic relatedness among individual birds?
1. **Pedigree Relatedness**
2. **Genetic Relatedness**
3. **Genomic Relatedness**
55
New cards
What is the level of relatedness expected between parents and offspring, and between full siblings?
**Expected relatedness between:**
* **parents and offspring– 0.5**
* **between full siblings– 0.5**
* **parents and offspring– 0.5**
* **between full siblings– 0.5**
56
New cards
How is relatedness between individuals used to plan breeding pairs in captive breeding programs? What is the goal of this practice?
**Relatedness between individuals is used by determining relatedness by pedigree, genetic, and genomic; the more variation between each of them is used for potential breeding pairs.**
\
**The goal of this practice is to increase genetic variation amongst the population while also decreasing inbreeding coefficient.**
\
**The goal of this practice is to increase genetic variation amongst the population while also decreasing inbreeding coefficient.**
57
New cards
Galla et al. 2021 argue that pedigree data and molecular data are mutually informative. Provide at least two contributions that genomics can make to improving pedigree data and visa-versa.
Molecule data to pedigree data:
1. Founder relationships
2. Impute missing individuals
3. Pedigree reconstruction
\
Pedigree to molecular data :
1. Study design and sampling
2. Life history and phenotypic data
3. Quantitative genetics
4. Improved collaborations
1. Founder relationships
2. Impute missing individuals
3. Pedigree reconstruction
\
Pedigree to molecular data :
1. Study design and sampling
2. Life history and phenotypic data
3. Quantitative genetics
4. Improved collaborations
58
New cards
With unlimited resources, what do you expect the shape of population growth to look like over time? Draw a simple graph of expected change in adundance over time. What is this form of growth called?
Exponential growth- unlimited resources
59
New cards
Which two factors determine the intrinsic rate of growth of a closed population? Provide an equation, or a simple “stocks and flows” diagram to show these two factors.
1. Growth rate - determined by rate of the organism can reproduce at
2. Starting number of organisms
60
New cards
What values of the intrinsic rate of growth indicate a growing population versus a declining population? Provide a simple equation of how you would use this value and the current size of a population to estimate the size of the population in the future.
\
\
Growth rate
\
Delta n= births- deaths + immigrants - emigrants
\
Delta n= births- deaths + immigrants - emigrants
61
New cards
What is the difference between a deterministic model and a stochastic model? Which tends to be more realistic for wild populations?
deterministic: produce same each results based on particular set of inputs
\
Stochastic: model presents data and predicts outcomes that account do levels of randomness
\
More realistic for wildlife: stochastic
\
Stochastic: model presents data and predicts outcomes that account do levels of randomness
\
More realistic for wildlife: stochastic
62
New cards
With our stochastic models, we often used the "sensitivity testing" tool in InsightMaker. Draw a simple graph showing what the output of this approach might show and provide a brief interpretation of the results. How can you use such a graph to estimate extinction risk?
Tool determines how many individuals cover a percent of the land. The median line is how many individuals live in the 50 percent of the region. If the median line has a large number of individuals, the population is at risk of extinction due to limited resources.
Higher median \= higher extinction rate
Higher median \= higher extinction rate
63
New cards
The Atlantic States Marine Fisheries Commission (ASMFC) recently proposed a revision to how it manages the Horseshoe Crab population of Delaware Bay. What were their 2-3 main management goals (listed in Dr. Shoemaker’s “Problem Statement”) for this system?
1. Manage harvest of horseshoe crabs in the Delaware Bay to maximize harvest but also to maintain ecosystem integrity,
2. provide adequate stopover habitat for migrating shorebirds,
3. ensure that the abundance of horseshoe crabs is not limiting the red knot stopover population or slowing recovery.
64
New cards
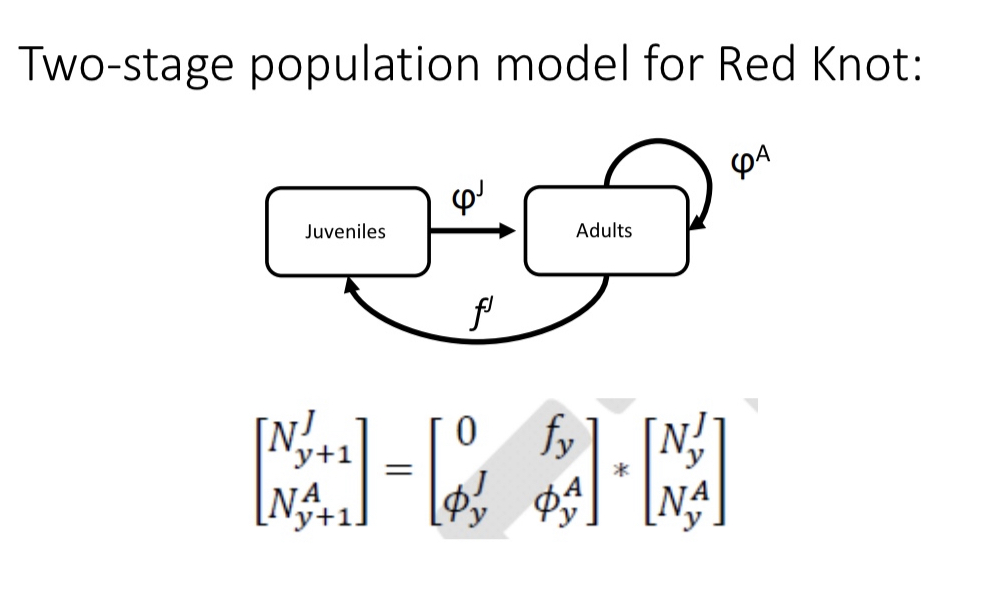
Draw a conceptual life history model for the Rufa Red Knot (with stocks and flows properly labeled as in InsightMaker). Why is it important to identify the different life stages for this population?
cub --\> yearling --\> SA1 --\> SA2 --\> SA3 --\> Adult
we will be able to understand processes that regulate this population
we will be able to understand processes that regulate this population
65
New cards
What is the biological link between the Rufa Red Knot and Horseshoe Crab? How did we incorporate this link into our explorations of possible future trajectories of the Red Knot population? That is, which future scenarios did you test and how did you modify the Red Knot model to explore these? What were the outcomes of your scenario tests and did those outcomes confirm a strong biological link between Red Knot and Horseshoe Crabs?
Bio link : HSC pop supported red knots
66
New cards
You plan to develop a PVA for a species we know very little about. Create a graphic that shows the key life history or demographic stages and transitions (stocks and flows) that are important for this taxon (an image like we made in InsightMaker). Given the model you plan to use, what field data will you need to collect? Provide some plausible values for the key parameters in your model (based simply on your knowledge of this system, even before the field data are all collected).
You could state with a simple count based PVA to determine the risk of extinction, the length of time we expect the population to persist and expected minimum abundance. Counts of at least 10 years are needed
To do a proper PVA you need to run a demographic one. It is more involved
- species life history traits are divided into stages like neonatal, small juveniles, young adults, adults
- survivorship of each stage and the fraction of survivors who transition into the next life stage are recorded
- fecundity rates for females are recorded and at what age they give birth
this data capture requires at least 5 years of collection
- all of this is put into a projection matrix
67
New cards
Why is it important to consider uncertainty in population modeling? What are the two primary sources of uncertainty in population ecology that we attempt to account for in our models?
1. Lack of Knowledge
• Simulate under many replicates of alternative scenarios covering the range of uncertainty we have about our study system
2. Randomness of the system
• Environmental stochasticity
• Demographic stochasticity
68
New cards
We used the horseshoe crab model to explore different possible futures for this population. Which parameters of the model did we modify and what was the outcome of these manipulations? Which parameter is the model most sensitive to, that is, which parameter did we discover has the most impact on the 50-year trajectory of this population?
Number of females harvested from the population
69
New cards
Using PVA models to manage populations often requires us to establish criteria concerning the fate of the population in question. Using your explorations of the horseshoe crab model as an example, what are reasonable criteria that you might establish for what you consider to be sustainable management of this population?
1. HSC pop keeps increasing despite number of harvested
2. 2. Genetic cation no alleix amdoveristy is still in pop
3. Large pop