exam 2 descriptive stats
0.0(0)
Card Sorting
1/10
There's no tags or description
Looks like no tags are added yet.
Last updated 4:21 AM on 10/29/25
Name | Mastery | Learn | Test | Matching | Spaced | Call with Kai |
|---|
No analytics yet
Send a link to your students to track their progress
11 Terms
1
New cards
measures of central tendency
mean, median, mode
2
New cards
mean
average
3
New cards
median
middle
4
New cards
mode
most
5
New cards
measures of variability
range
IQR
variance
standard deviation
6
New cards
measures of relative standing
percentiles
7
New cards
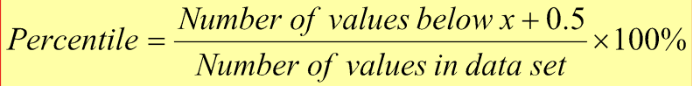
what is the percentile for a given data value
8
New cards
what is the corresponding data value for a given percentile
c = (n x k) / 100
9
New cards
c = (n x k) / 100
where n = sample size
k = percentile
c = position when data values are sorted in rank order
Note: if C is not a whole number round up, if C is a whole number take average of C and C +1
10
New cards
5 number summary
min, max, q1, q2, q3
11
New cards
IQR on box plot
how wide the box is depends on the largest IQR