Dr. Miroshynk "Exam Outline"
1/40
Earn XP
Description and Tags
includes her study guide + anything I think is important! Has all 3 of her powerpoints.
Name | Mastery | Learn | Test | Matching | Spaced | Call with Kai |
|---|
No analytics yet
Send a link to your students to track their progress
41 Terms
What is statistics?
A science not a branch of mathematics, but uses mathematical models as essential tools
functions: summarize, organize, present, analyze, interpret
What is biostatistics?
used to interpret the effects of a medical procedure or medicines on LIVING ORGANISMS
bio= life
What are descriptive statistics?
measurements of central tendency like mean, median, and mode
What is the difference between a variable and data?
variable- a characteristic that is being observed/measured
data- the measured values assigned to the VARIABLE for each individual member of the population
Ex: pain level would be a variable and each patient’s pain level as severe, mild, moderate, etc. would be the data
What are the 4 levels of data measurement?
nominal
ordinal
interval
ratio
Which of the 4 levels of data measurement are discrete and which are continuous?
discrete- nominal, ordinal
discrete ex’s: 5 kids, 96 workers, 3 laptops
were counting
continuous- interval, ratio
continous ex’s: 3.25 kg, 1.32 miles
What is the difference between 4 levels of measurement?
nominal- data can only be counted/categorized
ordinal- data can be counted and ranked
interval- counted, ranked, and added/subtracted
ratio- data can be counted, ranked, added/subtracted AND multiplied/divided
Rachel’s tips for the 4 levels of measurement:
Me personally, I HATE how they explain nominal, ordinal, interval, ratio… so I will explain how I was taught this topic back in the day:
nominal: we can put things into categories…
Ex: gender… I can put people into different categories by gender, however I CANNOT rank them in any order, or do any type of adding, multiplying etc… i mean how can you add/ subtract or rank a gender?
ordinal: we can put think into categories, but now we can RANK them
Ex: winners of a race… I can categorize by 1st, 2nd, 3rd, etc. and NOW there’s a ranking system… we know 1st is the winner, etc. etc. HOWEVER, I still cannot add, subtract, multiply or divide… I mean how do you divide winners of a race?
Another ex: letter grades… I categorize as well AS RANK. We know A, B, C, D there’s a ranking system as well as I categorized data based on what their grade was.
interval: we can categorize, rank, and NOW ADD/SUBTRACT
this is when the meaning of numbers start getting into play
when you think of adding/ subtracting, think of it more as if there is a scale that allows you to assess the difference
Ex: Temperature… We know that between 10-20 degrees there is a 10 degree DIFFERENCE and between 50-60 degrees there is a 10 degree difference. By using adding/subtracting we can now further analyze the data. If I were to subtract the 1st and 2nd place winner of a race… what does that mean????
Ratio- we can categorize, rank, add/subtract and NOW MULTIPLY AND DIVIDE
Ex: prices… a $100 dollar book costs twice the amount of a $50 book. That was division.
when I think of this one, I also think of these variables having a meaningful zero, before with interval if we had 0 degrees, that just means its cold, but ratio data like height, cannot be zero… you cannot be 0 inches tall.
Examples of each type of measurement level:
nominal
eye color, gender, race
ordinal
pain-scales, level of satisfaction, stage of disease
interval
temperature
ratio
distance, length, weight
How do you calculate mean, median, and mode?
mean= average
add em all up/ divide by the number of data points
median= middle
list the values from lowest to highest and pick the one in the middle
mode
which value occurs most frequently
PRACTICE:
Identify what type of measurement each example is:
Heat measured in degrees Celcius
Level of satisfaction for a particular breakfast cereal
Length of a capsule
Favorite color
interval
ordinal
ratio
nominal
Calculate the mean, median, and mode for the following data:
2, 4, 5, 6, 4, 7, 5, 4
mean- 4.625
median- 4.5
mode- 4
How do you calculate a range:
max value- min value
How do you calculate IQR:
to calculate:
IQR= Q3- Q1
List numbers from lowest—>highest
split that down the middle
find the median of the first half—> Q1
find the median of the second half—>Q3
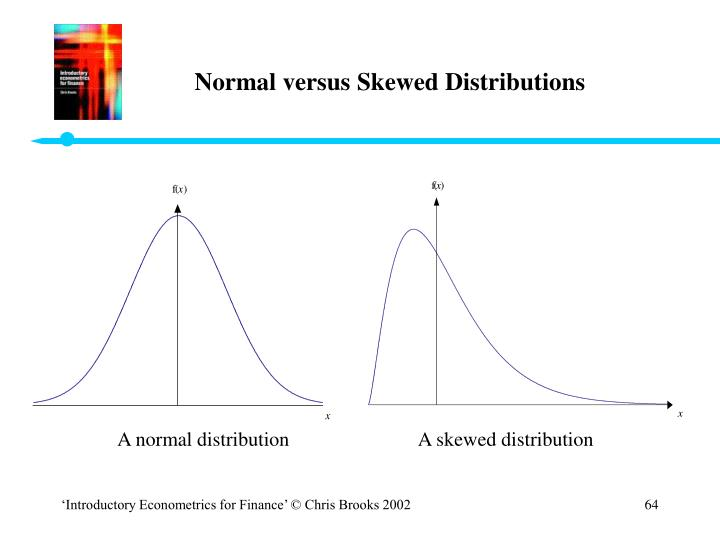
What are the measures of distribution shape?
normal distribution
skewed distribution
What is the difference between normal and skewed distributions?
normal= symmetrical, bell-shaped curve
mean=median=mode
skewed= asymmetrical, uneven distribution
mean≠median≠mode
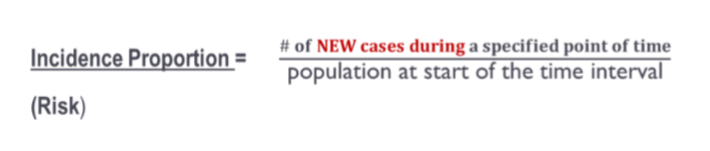
What does incidence measure?
measures the number of new cases of a disease during a given period
How is incidence proportion (risk) calculated?
What does prevalence measure?
# of existing cases (new and preexisting) at a particular point in time
Calculate point prevalence:
= # of existing cases(new and preexisting)/ population
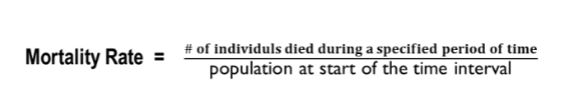
Calculate mortality rate:
Sensitivity is also referred to as ________________________.
true positive rate
Specificity is also referred to as ______________________.
true negative rate
___________________ is the test ability to correctly identify individuals WITHOUT disease.
a. sensitivity
b. specificity
b. specificity or true negative rate
Think: negative= no disease
___________________ is the test ability to correctly identify individuals WITH disease.
a. sensitivity
b. specificity
a. sensitivity or true positive rate
Think: positive= tested positive for the disease
How do you calculate sensitivity?

How do you calculate specificity?

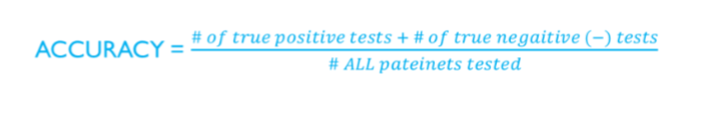
How do you calculate accuracy?
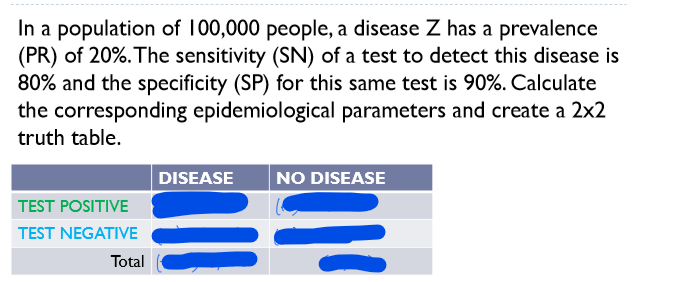
EXAM TYPE PROBLEM ON SENSITIVITY AND SPECIFICITY!!!
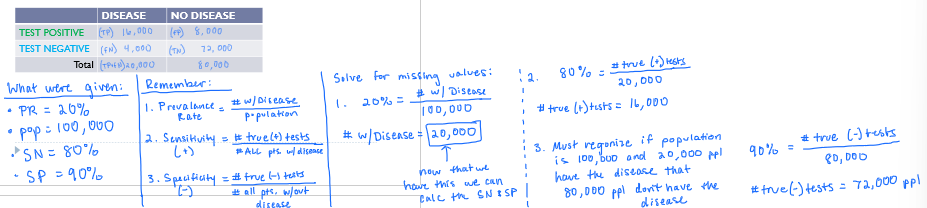
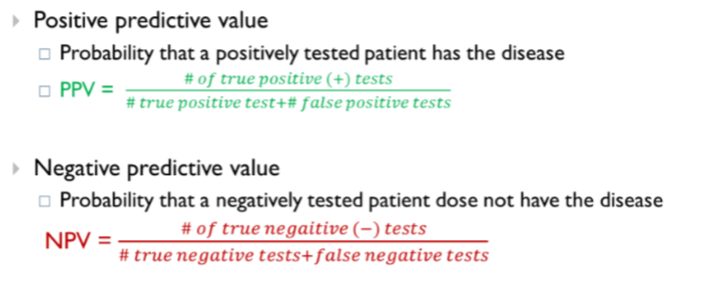
How do you calculate negative and positive predictive values?
What are the common types of visual data representation?
frequency table
box and whisker plot
used to present ranges of data
bar chart
ordinal data
histogram
continuous data
pie chart
What are inferential statistics?
use data to make a conclusion
What is the difference between population and samples and statistic and parameter?
population- set of all individuals in the group of interest
parameter goes with population
sample- a portion of the population selected for study
statistic goes with sample
What is the main idea of the central limit theorem in statistical analysis?
as sample size increase= distribution will approach NORMAL
What is the difference between null and alternative hypothesis?
null- assumes no difference between the study groups
alternative- assumes there IS a difference between the study groups
parametric vs. nonparametric tests and their selection criterea
parametric- for normal distributed data
ex: t-tests, ANOVA
nonparametric- for not normal distributed data
chi-square, etc.
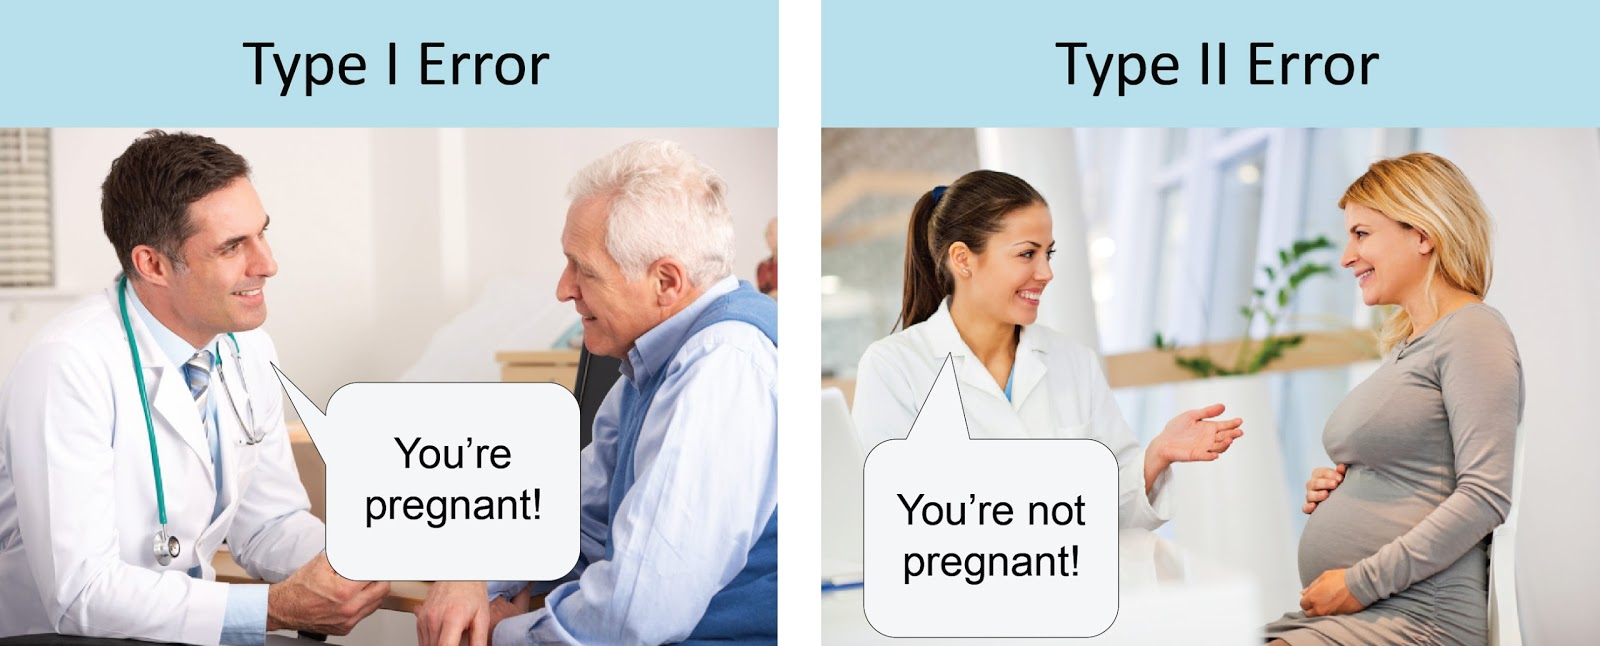
What are type I and type II errors?
Type I
false positive
If you reject the null hypothesis and you weren’t supposed to reject it
Type II
false negative
Alpha vs p-value
both are probabilities
p-value < alpha = REJECT NULL
p-value > alpha = ACCEPT NULL
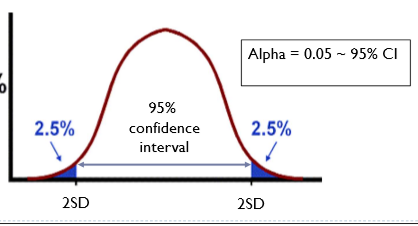
What is confidence interval and its value?
confidence interval is another measure of statistical significance
CI= 1- alpha
Explain how confidence intervals can be used to test hypotheses:
Is used to test if our hypothesis is clinically significant so…
estimates a range of scores likely to contain the unknown pop parameter
Which one is more important in clinical research—-statistical or clinical significance?
clinical signficance