Fundamentals of Operations Management and Process Design
1/96
There's no tags or description
Looks like no tags are added yet.
Name | Mastery | Learn | Test | Matching | Spaced | Call with Kai |
|---|
No analytics yet
Send a link to your students to track their progress
97 Terms
Operations management
The design, control, and coordination of resources and processes to provide customer and stakeholder value.
Input-transformation-output model
A framework that describes how input resources are transformed into outputs through processes.
Transformed resources
Input resources which undergo change in the process.
Transforming resources
Resources used to transform input resources.
Input-transformation-output model application to a coffee shop
A practical example of the input-transformation-output model in a coffee shop setting.
Inputs/transformed resources in a coffee shop
Coffee beans, Milk, Sugar, Customers.
Transforming resources in a coffee shop
Coffee machines, Personnel.
Outputs in a coffee shop
Prepared coffee, Satisfied customers, MONEEEEEEEEEEEEEY.
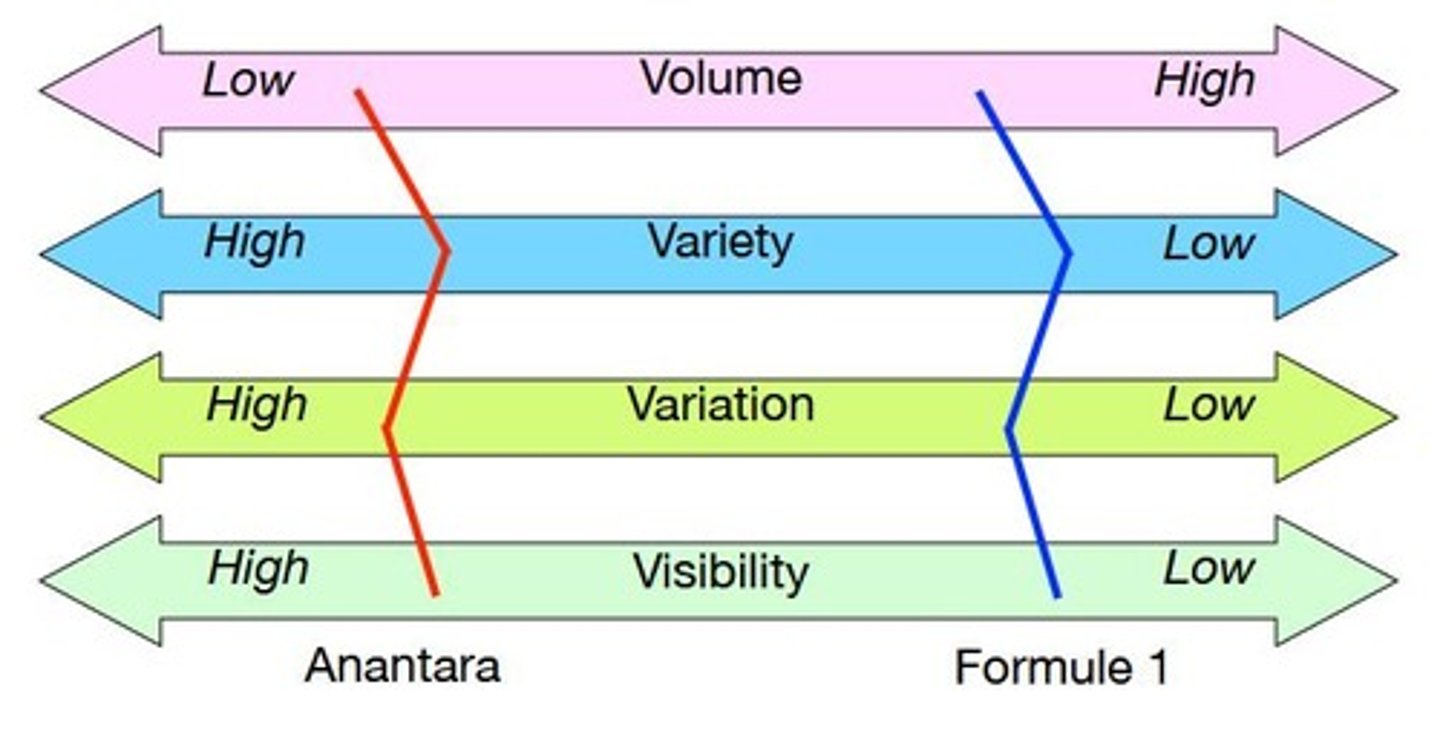
Operation characteristics (four V's)
Volume of output, Variety of output, Variation in demand for output, Visibility of creation of output to customers.
Volume of output
How much output is created through the process.
Variety of output
How varied are the outputs of a process.
Variation in demand for output
How elastic or conditions-related is demand.
Visibility of creation of output to customers
How visible the process of creating output is to customers.
Dabbawallas
A successful food delivery system in Mumbai that aligns operations with the local culture and environment.
Four V-profile
A model that outlines the volume, variety, variation, and visibility of operations.
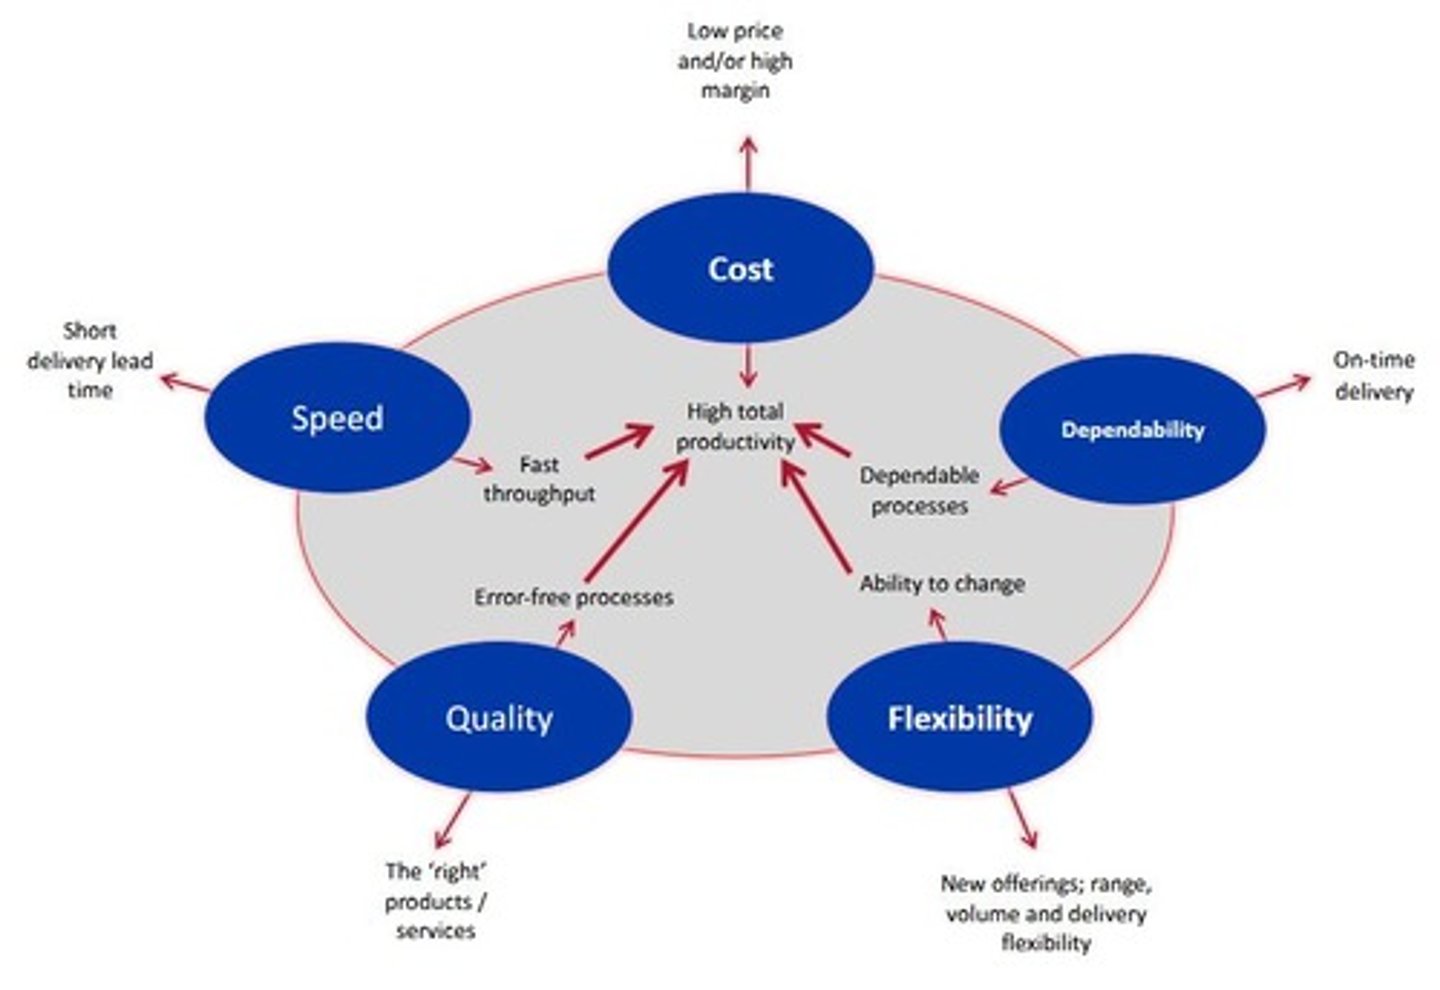
Performance objectives of operations
Five objectives: quality of output, cost reduction, increased dependability, improved customer satisfaction, and speed of production and delivery.
Quality of output
The degree to which the output meets the required standards and specifications.
Cost reduction
The process of minimizing expenses to improve profitability.
Increased dependability
The ability to deliver products or services consistently and reliably.
Improved customer satisfaction
Enhancing the experience and fulfillment of customer needs.
Speed of production and delivery
The rate at which products are produced and delivered to customers.
Flexibility of operations
The capability to adapt to changes in customer demand and operational conditions.
Cost of production
The total expenses incurred in the manufacturing of a product.
Types of quality
Includes conformance to basic requirements and specification which adds custom value.
Types of flexibility
Includes product/service flexibility, mix of products and services, volume flexibility, and delivery flexibility.
Polar diagram of performance objectives
A visual representation showing internal and external traits of performance objectives.
Case study - Concept Design Services
An analysis of a design firm facing challenges and advantages in operations.
Challenges in Concept Design Services
Issues include subcontracting difficulties, communication gaps, and unpredictable sales forecasts.
Advice for CDS
Recommendations include hiring consultants, improving communication, and better sales forecasting.
Process design
The planning and organization of processes to achieve specific operational goals.
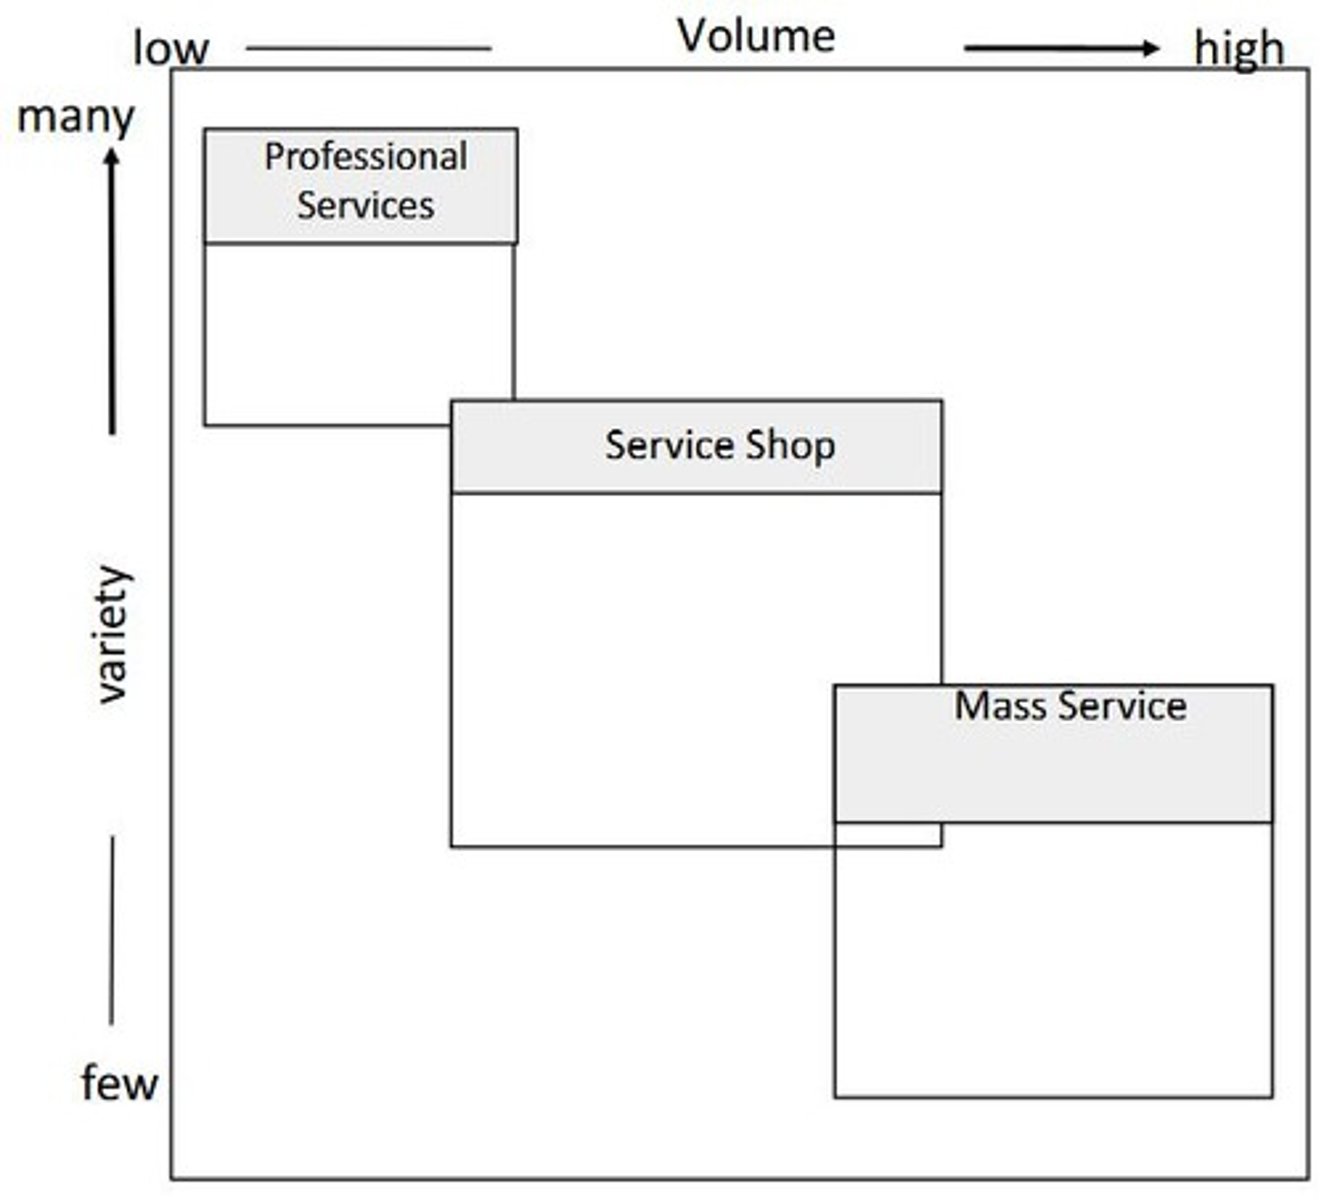
Process types
Includes project, jobbing, batch, mass, and continuous processes.
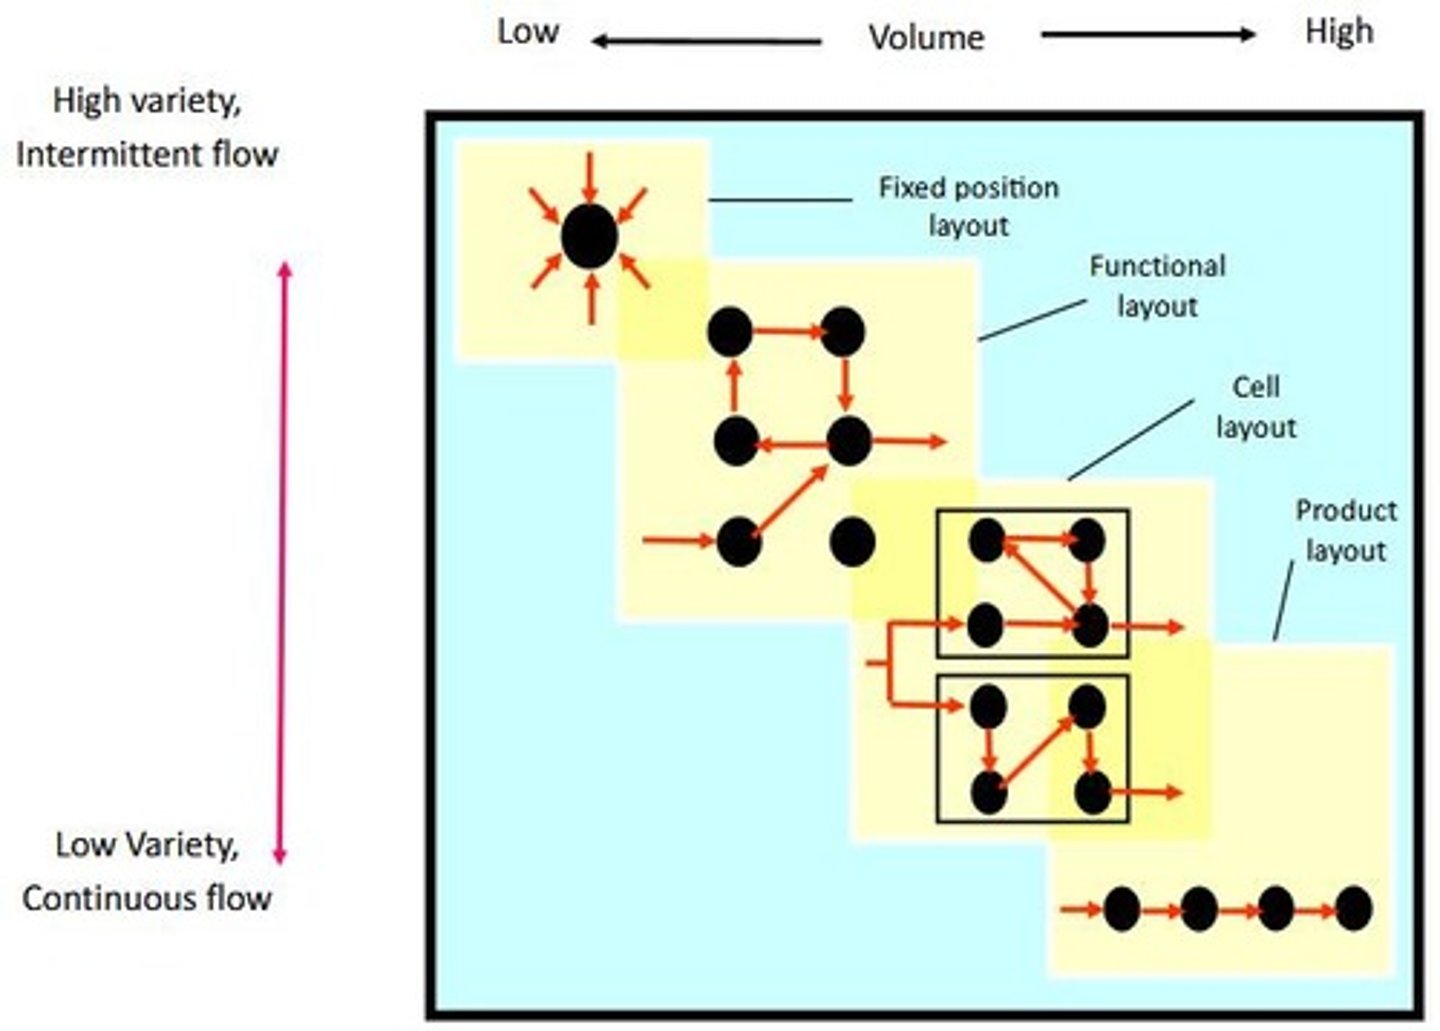
Layout types
Includes fixed position, functional, cell, and product layouts.
Line Balancing
The assignment of tasks to resources to optimize workflow and minimize idle time.
Case study - North West Bank
An examination of the consolidation of departments and the resulting operational challenges.
Organizational coherence
The alignment of teams and processes to create a unified operational strategy.
Process mapping
The visualization of processes to identify steps and improve efficiency.
Throughput time
The total time an item spends in the system from entry to exit.
Cycle time
The average time taken to complete a single cycle of a process.
Sales forecast
An estimate of future sales, crucial for planning and inventory management.
Market intelligence
The process of gathering and analyzing information about market trends and customer preferences.
Investment in operations
The allocation of resources to improve various operational objectives.
Specialist recruitment
Hiring individuals with specific skills and expertise for particular roles.
Generalist recruitment
Hiring individuals with a broad range of skills applicable to various roles.
Work-in-progress
Number of items within the process at any given time
Throughput efficiency
Work content / Throughput Time (x 100)
Little's Law
Throughput time = WIP x Cycle time
Work-in-progress (WIP)
Number of units waiting to be processed further
Number of transforming resources
Work content / Cycle Time
Inventories
Accumulations of transformed resources
Stock
Physical items
Ques
People
Databases
Information
Managing databases
More about organization of the data, its storage, security, and retrieval
Transforming resource
Information can often turn from a transformed resource into a transforming resource (e.g.: customer data being used to target ads for similar groups)
Buffer inventory
Can be used for unexpected fluctuations in demand, essentially protection against uncertainty
Cycle inventory
Countering lack of flexibility with demand-sufficient inventory of item A while production of item B takes up all product processes
Anticipation inventory
For large but mostly predictable demand fluctuations
Pipeline inventory
Inventory awaiting distribution or locked down from other customers by an order
Queues of customers
Enable prioritization (e.g.: hospital queues with separate emergency lines)
Efficient multi-level access to data
Use for databases
Inventory management
Affects return on assets
Obsolescence costs
With large orders, some items will inevitably sit in storage longer than others, potentially losing value
Economic Order Quantity (EOQ)
Formula for how much of a specific item to order
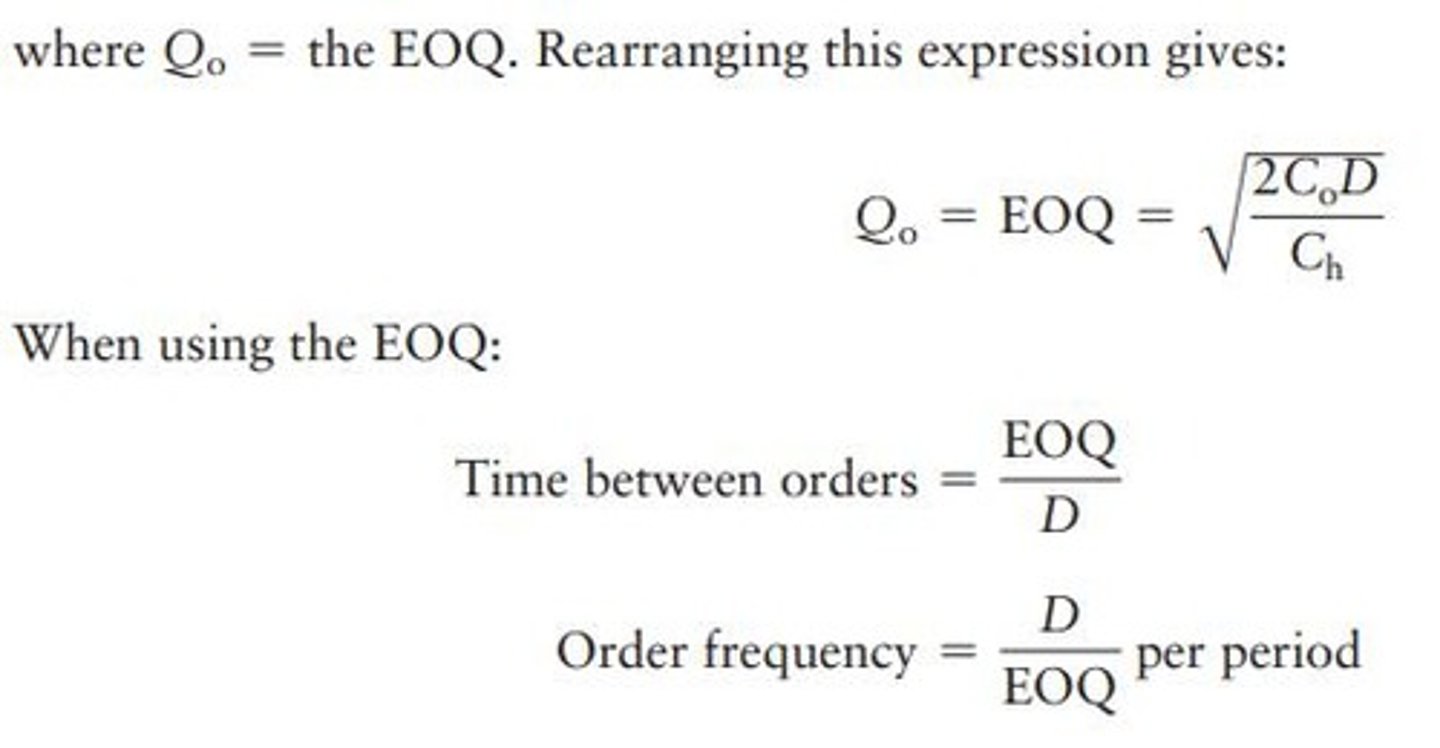
Q
Items ordered
D
Demand rate (units demanded per month)
Ch
Total cost of holding one unit in stock for a period of time
CO
Total cost of placing an order
Economic Batch Quantity (EBQ)
Takes into account that even when produced in batches, items are added to and sold from the inventory continuously
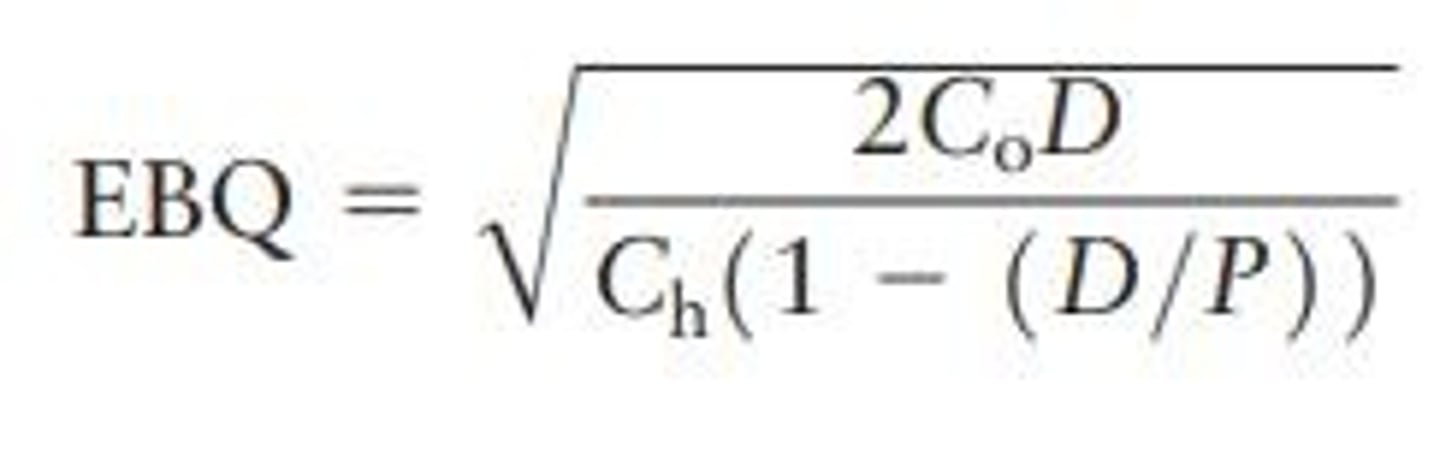
P
Rate at which items are made and put into inventory
Lean philosophies
Argue for different methods to reduce costs
Order placement timing
When should the order be placed?
Lead time
The time between ordering a product and it arriving
Re-order point
Point at which stock will fall to zero minus the order lead time
Re-order level
The level of inventory when a replenishment order needs to be made
Safety / Buffer stock
The stock that is still in inventory the moment the replenishment order arrives
Lead-time usage
How many products are taken out of the inventory during order lead time (d1 and d2 in the picture)
Continuous review
Orders placed at re-order level and the order quantity is constant
Periodic review
Orders placed at regular intervals and at quantities that help reach a certain point every time
Maximum quantity Qm
Set higher to compensate for uncertain demand and lead time
Usage value
Usage rate X Individual value
Pareto law (or 80/20 law)
A relatively small proportion of the total range of items in an inventory will account for a large proportion of the total usage value
ABC Inventory control
Controlling stock according to the Pareto law
Class A items
The 20% of items that contribute 80% of usage value
Class B items
The next 30% of items that contribute 10% of usage value
Class C items
The last 50% of items that contribute 10% of usage value
Consequence of stock-out
One of the criteria for classifications of items
Uncertainty of supply
One of the criteria for classifications of items
High obsolescence or deterioration risk
One of the criteria for classifications of items
Cover of the stock
Calculate how long the inventory would last without replenishment
Perpetual inventory principle
The principle followed by computerized inventory management systems
Dependent demand
Dependent on other products or variables (e.g.: car tires in an automobile plant are dependent on cars)
Independent demand
Dependent on random factors that are very difficult to predict
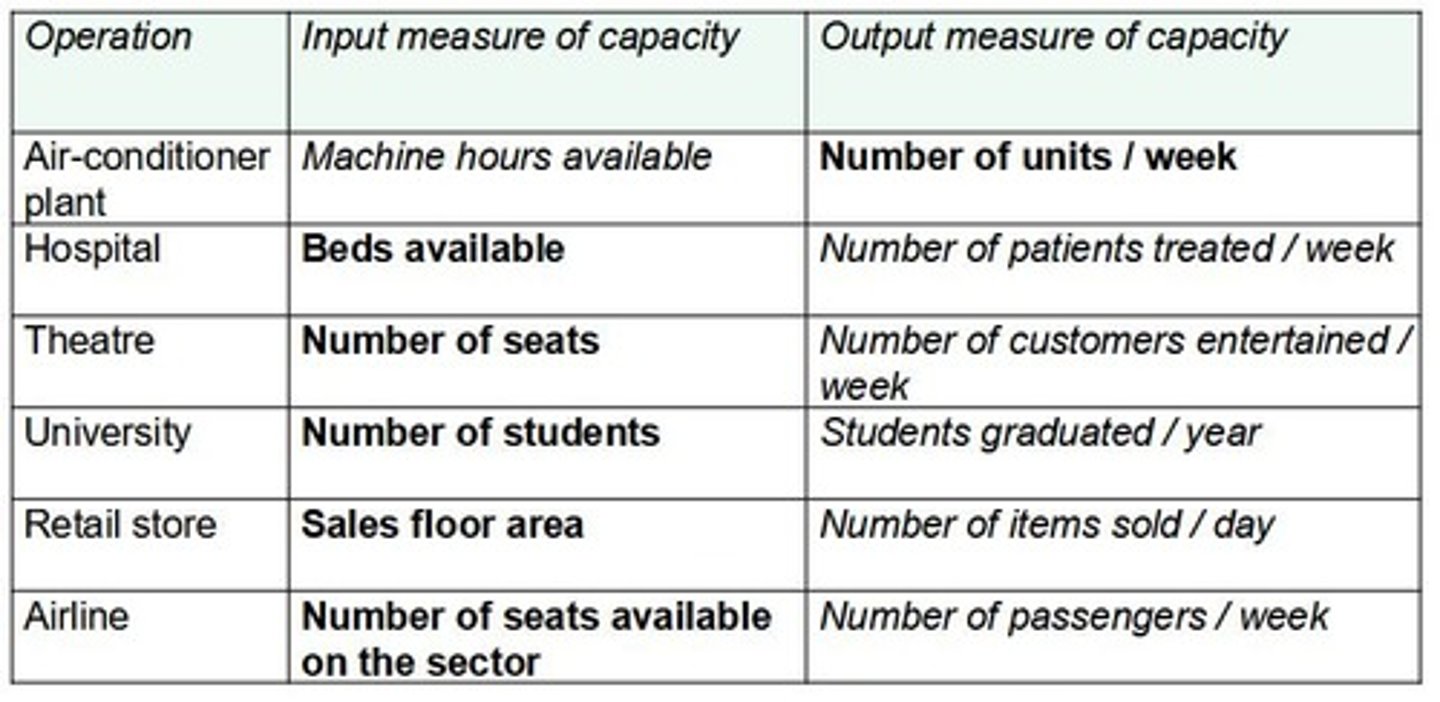
Capacity
Scale of an operation, not necessarily reflective of processing capability
Capacity management
The purpose is to determine an appropriate amount of capacity for an operation
Chase demand plan
Adapting to demand and trying to stay above it
Manage demand plan
Affecting demand with marketing efforts
Level capacity demand
Keep capacity at a constant level despite of demand (e.g.: luxury products or petrochemical [capacity hard to change])