UCF FIN3403 Exam #3, Possible Conceptual Questions
1/37
There's no tags or description
Looks like no tags are added yet.
Name | Mastery | Learn | Test | Matching | Spaced | Call with Kai |
|---|
No analytics yet
Send a link to your students to track their progress
38 Terms
Payback Period (PP)
The Payback Period is the amount of time it takes for a project to generate enough cash inflows to recover its initial investment. It measures how long it will take for the project to “pay back” its cost.
Payback Period (PP) Rules
Accept the project if the payback period is less than or equal to the firm’s required (or maximum acceptable) payback period.
Reject the project if the payback period is greater than the firm’s required payback period.
When comparing multiple projects, prefer the project with the shorter payback period, assuming all meet the required cutoff.
Only consider cash flows up to the payback point (since later cash flows are ignored by the method)
Payback Period (PP) Advantages
Simple and easy to understand — requires basic calculation and minimal financial expertise.
Quick to compute — useful when decisions need to be made fast.
Focuses on liquidity — shows how quickly the initial investment can be recovered, which is helpful for firms that are cash-constrained.
Useful for assessing short-term risk — projects that pay back quickly are generally considered less risky.
Can be helpful in industries with rapid technological change — because long-term cash flows are less certain, a fast payback becomes more valuable.
Payback Period (PP) Disadvantages
1. Firm cutoffs are subjective.
The cutoff period chosen by the firm is subjective and may not reflect optimal decision-making.
2. Does not consider time value of money
It does not consider the time value of money, meaning cash flows are treated as if they all have the same value.
3. Does not consider any required rate of return
It ignores the required rate of return, so it cannot assess whether the project meets a minimum profitability threshold.
4. Does not consider all of the projects cash flows.
It does not consider all cash flows, only those that occur up to the payback point, ignoring benefits (or costs) that happen afterward.
Net Present Value (NPV)
The total PV of the annual net cash flows - initial outlay.
Net Present Value (NPV) Rules
If NPV is positive, accept.
If NPV is negative, reject.
Net Present Value (NPV) Advantages
Considers the time value of money, giving a more accurate measure of a project’s true profitability.
Includes all cash flows over the project's entire life.
Directly measures value creation, showing how much wealth a project adds to the firm.
Consistent with the goal of maximizing shareholder value, making it one of the most reliable decision tools.
Clear decision rule: accept if NPV > 0; reject if NPV < 0.
Works well for comparing mutually exclusive projects, especially when combined with incremental analysis.
Allows for different discount rates to reflect varying levels of risk.
Does not rely on accounting profits, focusing instead on cash flows.
Net Present Value (NPV) Disadvantages
Requires an estimate of the discount rate, which can be difficult to determine accurately and heavily affects the result.
More complex to calculate than simpler methods like the payback period or accounting rate of return.
Not always intuitive for managers who are unfamiliar with present value concepts.
Assumes cash flows are reinvested at the discount rate, which may not reflect real-world conditions.
May conflict with other decision criteria (e.g., IRR) when comparing mutually exclusive projects.
Sensitive to forecasting errors, since inaccurate cash flow projections can lead to misleading results.
Does not consider project size directly, meaning a project with a high NPV may require a much larger investment than an alternative with a lower but more efficient return.
Profitability Index (PI)
The Profitability Index (PI) is a capital budgeting tool that measures the value created per dollar invested.
It is calculated by dividing the present value of future cash inflows by the initial investment.
Profitability Index (PI) Rules
Accept the project if PI > 1 (it creates value).
Reject the project if PI < 1 (value is destroyed).
For mutually exclusive projects, choose the one with the higher PI, as long as scale differences are not misleading.
Profitability Index (PI) Advantages
onsiders the time value of money
Like NPV, PI discounts future cash flows, giving a more accurate measure of project value.
Includes all relevant cash flows
Accounts for all expected inflows over the project’s life.
Useful for ranking projects when capital is limited
Helps decide which projects give the most value per dollar invested.
Simple decision rule
Accept projects with PI > 1, reject projects with PI < 1.
Shows value created per unit of investment
Provides a relative measure of efficiency, which is helpful when comparing projects of different sizes.
Consistent with NPV
Generally aligns with the goal of maximizing shareholder wealth.of return.
Profitability Index (PI) Disadvantages
Can be misleading for mutually exclusive projects
A project with a higher PI might have a smaller total NPV compared to a larger project, so PI alone doesn’t always indicate the most value-creating option.
Requires accurate discount rate
Like NPV, PI depends on the choice of the discount rate. A wrong rate can give misleading results.
Does not consider project size directly
PI measures value per dollar invested, not total wealth added. A small project may look better by PI even if a bigger project adds more absolute value.
Sensitive to cash flow estimates
If future cash flows are uncertain or difficult to estimate, PI can be unreliable.
Less intuitive than NPV
Managers may find it harder to interpret compared to the straightforward “how much value is created” from NPV.
Internal Rate of Return (IRR)
The return on the firm’s invested capital.
IRR is simply the rate of return that the firm earns on its capital budgeting projects.
Internal Rate of Return (IRR) Rules
Accept the project if IRR > required rate of return (hurdle rate)
The project is expected to generate a return higher than the minimum acceptable return.
Reject the project if IRR < required rate of return
The project does not meet the minimum profitability threshold.
Indifferent if IRR = required rate of return
The project just meets the minimum return; decision may depend on other factors.
For mutually exclusive projects
Choose the project with the highest IRR, provided it exceeds the required rate.
Be careful: IRR can sometimes conflict with NPV, especially for projects with different sizes or timing of cash flows.
Multiple IRRs
If a project has non-conventional cash flows (cash inflows and outflows alternate), it may have multiple IRRs. In such cases, rely on NPV instead of IRR for decision-making.
Internal Rate of Return (IRR) Advantages
Considers the time value of money
Like NPV, IRR discounts future cash flows to reflect their present value.
Uses all cash flows
Accounts for every expected cash inflow and outflow over the project’s life.
Simple decision rule
Accept if IRR > required rate of return, reject if IRR < required rate.
Provides a rate of return
Expresses project profitability as a percentage, which is often easier to interpret than absolute dollar amounts.
Useful for comparing projects
Especially helpful when ranking projects by expected return.
Consistent with shareholder wealth maximization
Generally aligns with NPV decisions when cash flows are conventional.
Internal Rate of Return (IRR) Disadvantages
Multiple IRRs can occur
Projects with non-conventional cash flows (alternating inflows and outflows) may have more than one IRR, making interpretation confusing.
Can conflict with NPV for mutually exclusive projects
A project with a higher IRR may have a lower NPV, especially if project sizes or timing of cash flows differ.
Assumes reinvestment at IRR
IRR assumes interim cash flows are reinvested at the same rate, which may not be realistic.
Less reliable for projects with different durations
Comparing projects of unequal lengths can lead to misleading decisions.
Requires precise cash flow estimates
Like NPV, inaccurate cash flow projections can distort IRR.
Does not indicate absolute value created
A high IRR doesn’t necessarily mean the project adds more total wealth than a larger project with a lower IRR.
Modified Internal Rate of Return (MIRR)
The Modified Internal Rate of Return (MIRR) is a variation of IRR that eliminates the problem of multiple IRRs and gives a more realistic measure of a project’s profitability.
It assumes cash inflows are reinvested at the firm’s required rate of return (or cost of capital), rather than the IRR.
It assumes cash outflows are financed at the project’s cost of capital.
Modified Internal Rate of Return (MIRR) Rules
Accept the project if MIRR > required rate of return (hurdle rate)
The project is expected to generate a return higher than the minimum acceptable return.
Reject the project if MIRR < required rate of return
The project does not meet the required profitability threshold.
Indifferent if MIRR = required rate of return
The project exactly meets the minimum required return; other factors may influence the decision.
For mutually exclusive projects
Choose the project with the highest MIRR, provided it exceeds the required rate.
Avoid multiple MIRRs problem
Unlike IRR, MIRR produces a single, unique rate, even for projects with non-conventional cash flows.
Modified Internal Rate of Return (MIRR) Advantages
Eliminates multiple IRR problem
More realistic reinvestment assumption than IRR
Considers all cash flows over the project’s life
Consistent with NPV decisions for ranking projects
Expressed as a percentage, making it easy to compare with the required rate of return
Modified Internal Rate of Return (MIRR) Disadvantages
Requires selection of a reinvestment rate, which can affect the result
More complex calculation than simple IRR
Less commonly used in some firms, so managers may be less familiar with it
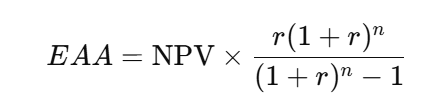
Equivalent Annual Annuity (EAA)
The Equivalent Annual Annuity (EAA) converts a project's NPV into an annual payment (annuity) over the life of the project.
It tells you the value created each year by a project.
Equivalent Annual Annuity (EAA) Rules
1. Use EAA when comparing projects with unequal lives
EAA is only needed if projects are mutually exclusive and have different lifespans.
2. Convert each project’s NPV into an annual value
Use the EAA formula:
3. Decision Rule for Mutually Exclusive Projects
Choose the project with the higher EAA.
This project provides the greater annualized value.
4. If projects are independent, EAA is NOT required
Use NPV alone if both projects can be accepted.
5. A positive NPV will always produce a positive EAA
NPV > 0 → EAA > 0
NPV = 0 → EAA = 0
NPV < 0 → EAA < 0
6. EAA removes the bias caused by different project lengths
Longer projects may have higher NPVs simply because they last longer.
EAA adjusts for this by putting all projects on a per-year basis.
Equivalent Annual Annuity (EAA) Advantages
Allows comparison of projects with unequal lives
Converts NPVs into annualized cash flows, making them directly comparable.
Removes bias toward longer projects
A longer project might have a higher NPV just because it lasts longer; EAA adjusts for this.
Easy decision rule
Simply choose the project with the higher EAA.
Compatible with NPV principles
Since EAA is derived from NPV, it still reflects value maximization for the firm.
Useful for replacement decisions
Helps compare projects that need to be renewed over different time periods.
Simplifies reinvestment comparison
Annualizes cash flows, making it easier to see which project delivers better annual returns.
Equivalent Annual Annuity (EAA) Disadvantages
Requires NPV calculation first
You cannot calculate EAA without first computing NPV, which requires a discount rate and future cash flow estimates.
Assumes constant discount rate
EAA assumes the same required rate of return throughout the project’s life, which may not reflect changing market conditions.
Ignores project flexibility
Does not consider managerial options like expansion, abandonment, or delay.
Less intuitive than NPV for some users
Annualized cash flows may be harder to interpret than total value (NPV).
Still relies on forecasted cash flows
Any errors in estimating cash flows or growth rates directly affect the EAA.
Only useful for mutually exclusive projects
For independent projects, EAA is unnecessary; NPV alone suffices.
Mutually Exclusive Projects
Only ONE project can be chosen from a set.
Selecting one project automatically eliminates the others.
Reasons may include:
They perform the same function
They require the same resources
They physically cannot coexist
Example:
Choose either Machine A or Machine B to replace old equipment—not both.
Decision Method:
Pick the project that provides the highest value (usually highest NPV).
Independent Projects
Projects do NOT affect one another.
More than one project can be accepted.
Accept all projects that meet the decision criteria.
Example:
Building a new warehouse and purchasing delivery trucks—both can be done independently.
Decision Method:
Accept any project with
NPV > 0
IRR > required return
PI > 1
NPV and PI Relationship
1. NPV and PI Relationship
If NPV > 0 → PI > 1
If NPV = 0 → PI = 1
If NPV < 0 → PI < 1
Why?
Because PI = Present Value of Inflows ÷ Initial Investment.
If inflows > investment → PI > 1 → NPV positive.
If inflows = investment → PI = 1 → NPV = 0.
If inflows < investment → PI < 1 → NPV negative.
NPV and IRR Relationship
IRR is the discount rate that makes NPV = 0.
If IRR > required return → NPV > 0 → Accept
If IRR = required return → NPV = 0 → Indifferent
If IRR < required return → NPV < 0 → Reject
This is because NPV declines as the discount rate increases.
IRR and PI Relationship
Since both techniques use discounted cash flows:
If IRR > required return, the present value of inflows exceeds the investment → PI > 1.
If IRR < required return, present value of inflows is too small → PI < 1.
NPV vs. IRR for Mutually Exclusive Projects
They usually agree for independent projects.
They may conflict for mutually exclusive projects when:
Project sizes differ
Timing of cash flows differ
In these cases:
NPV is always the correct method because it maximizes firm value.
MIRR and IRR
MIRR fixes IRR problems (multiple IRRs, unrealistic reinvestment).
MIRR > required return → NPV > 0 → PI > 1.
MIRR will always give one unique answer, even if IRR gives multiple.
Summary of Comparisons
See chart

Sunk Costs
A sunk cost is a cost that has already been incurred and cannot be recovered, no matter what future decision is made.
Key Points About Sunk Costs
They must NOT be included in capital budgeting decisions.
They are irrelevant for evaluating a project because the money is already spent.
Decisions should be based only on future costs and benefits.
Examples
Money spent last year on research and development.
A non-refundable deposit already paid.
Equipment purchased in the past that has no resale value.
Unequal Lives — What It Means
Projects have unequal lives when they last for different lengths of time.
Example:
Project A lasts 3 years
Project B lasts 5 years
Because they run for different time periods, you cannot directly compare their NPVs.
Why Direct NPV Comparison Is Misleading
A longer project usually has a higher NPV simply because it receives cash flows for more years —
not necessarily because it's better.
We need a method that lets us compare them fairly.
Solution: Use EAA (Equivalent Annual Annuity)
The Equivalent Annual Annuity converts each project’s NPV into an equal annual payment over the life of the project.
This lets you compare projects of different lengths on a per-year basis.
Decision Rule
Choose the project with the higher EAA
(if the projects are mutually exclusive and have unequal lives).
Why Use EAA?
Makes comparisons fair
Eliminates bias from different project lengths
Converts each project into a per-year value measure
Simple Example
If:
Project A: NPV = $20,000, life = 3 years
Project B: NPV = $25,000, life = 5 years
You cannot just pick Project B because $25k > $20k.
You compute EAA for each and choose the higher annual equivalent value.
Conventional (Normal, Typical) Cash Flows
Definition:
A project has conventional cash flows when it involves one initial cash outflow followed by a series of cash inflows.
Pattern: − ,+,+,+,+…-\ , + , + , + , + \ldots− ,+,+,+,+… Example:
Year 0: –$100,000 (investment)
Years 1–5: +$30,000 each year
Characteristics:
Only ONE sign change (from – to +)
IRR will always give one unique answer
NPV and IRR usually agree on accept/reject decisions
This is the "normal" pattern for most investments.
Unconventional (Non-normal, Atypical) Cash Flows
Definition:
A project has unconventional cash flows when cash flows change signs more than once.
Pattern: − ,+,−or−,+,+,−,+…-\ , + , - \quad \text{or} \quad - , + , + , - , + \ldots− ,+,−or−,+,+,−,+… Example:
Year 0: –$100,000
Year 1: +$80,000
Year 2: –$20,000 (cleanup cost, maintenance, environmental fee)
Characteristics:
More than one sign change
IRR may produce multiple IRRs, or sometimes none
MIRR is preferred because it gives a single, correct rate
NPV is still reliable