Stats Unit 1 Vocab
1/38
There's no tags or description
Looks like no tags are added yet.
Name | Mastery | Learn | Test | Matching | Spaced | Call with Kai |
|---|
No analytics yet
Send a link to your students to track their progress
39 Terms
Descriptive stats
describe/display sample data
Inferential stats
use sample data to make inference about larger population
Population
Size N, set of all subjects we want to describe
defined by researcher
large, varied, and hard to describe
parameters
characteristics of a population
μ- mean, σ- stdev, ρ- correlation
sample
size n, subset of a population
statistics
characteristics of a sample (estimates of parameters of a pop)
X̄- mean, s-stdev, r-correlation
sampling error
happens by chance, reduce by increase sample (size n)
bias
systematic discrepancy, eliminate by taking a random sample
categorical variable
define membership in a group
(univariate) describe using frequencies or proportions/%
categorical nominal
categorical variable that has no inherent order (last movie seen, etc)
categorical ordinal
categorical variable that exists in an order (ie fruit ripeness, class)
numeric variable
quantitative measurement that typically has magnitude and units
(univariate) describe using a measure of center (mean, median, mode) and a measure of spread (stdev, IQR)
numeric discrete
variable that only exists in individual increments, doesn’t typically have decimals (# of texts sent, shoe size (only have .5 increments))
numeric continuous
exists as any real number (decimals typically make sense); hours slept, height, etc
confounding variable
unmeasured variables that may mask/distract from the causal relationships between variables of interest (homeless people cause car crashes)
univariate
describe 1 variable’s distribution
bivariate
describe relationship between 2 variables
explanatory variable
(bivariate) independent/predictor variable; see if it explains or predicts another variable
response variable
(bivariate) dependent/outcome variable, what you want to explain/predict (variable of interest)
standard deviation
measure of spread, gives average distance for each value to X̄ (mean)
Inner quartile range (IQR)
measure of spread, distance between 1st (25th percentile) and 3rd quartile (75th percentile)
Q3-Q1
percentile
percentage of values in a set of data scores that fall below a given value (25th percentile- 25% of the values are below the given value)
5 number summary
set of numbers that explain distribution
{min, Q1, median, Q3, max}
Describing numeric variables
include shape (symmetric or skewed) and a measure of center and spread (depends on shape)
symmetric
describe using x̄ (mean) and s (stdev)
skewed
describe using median and IQR
pos/neg based on which direction the tail points
contingency/2-way frequency table
table to display 2 categorical variables
compare the marginal distribution to the conditional distribution
marginal distribution
percentage out of the totals, probability of one variable
conditional distribution
probability of one variable given another
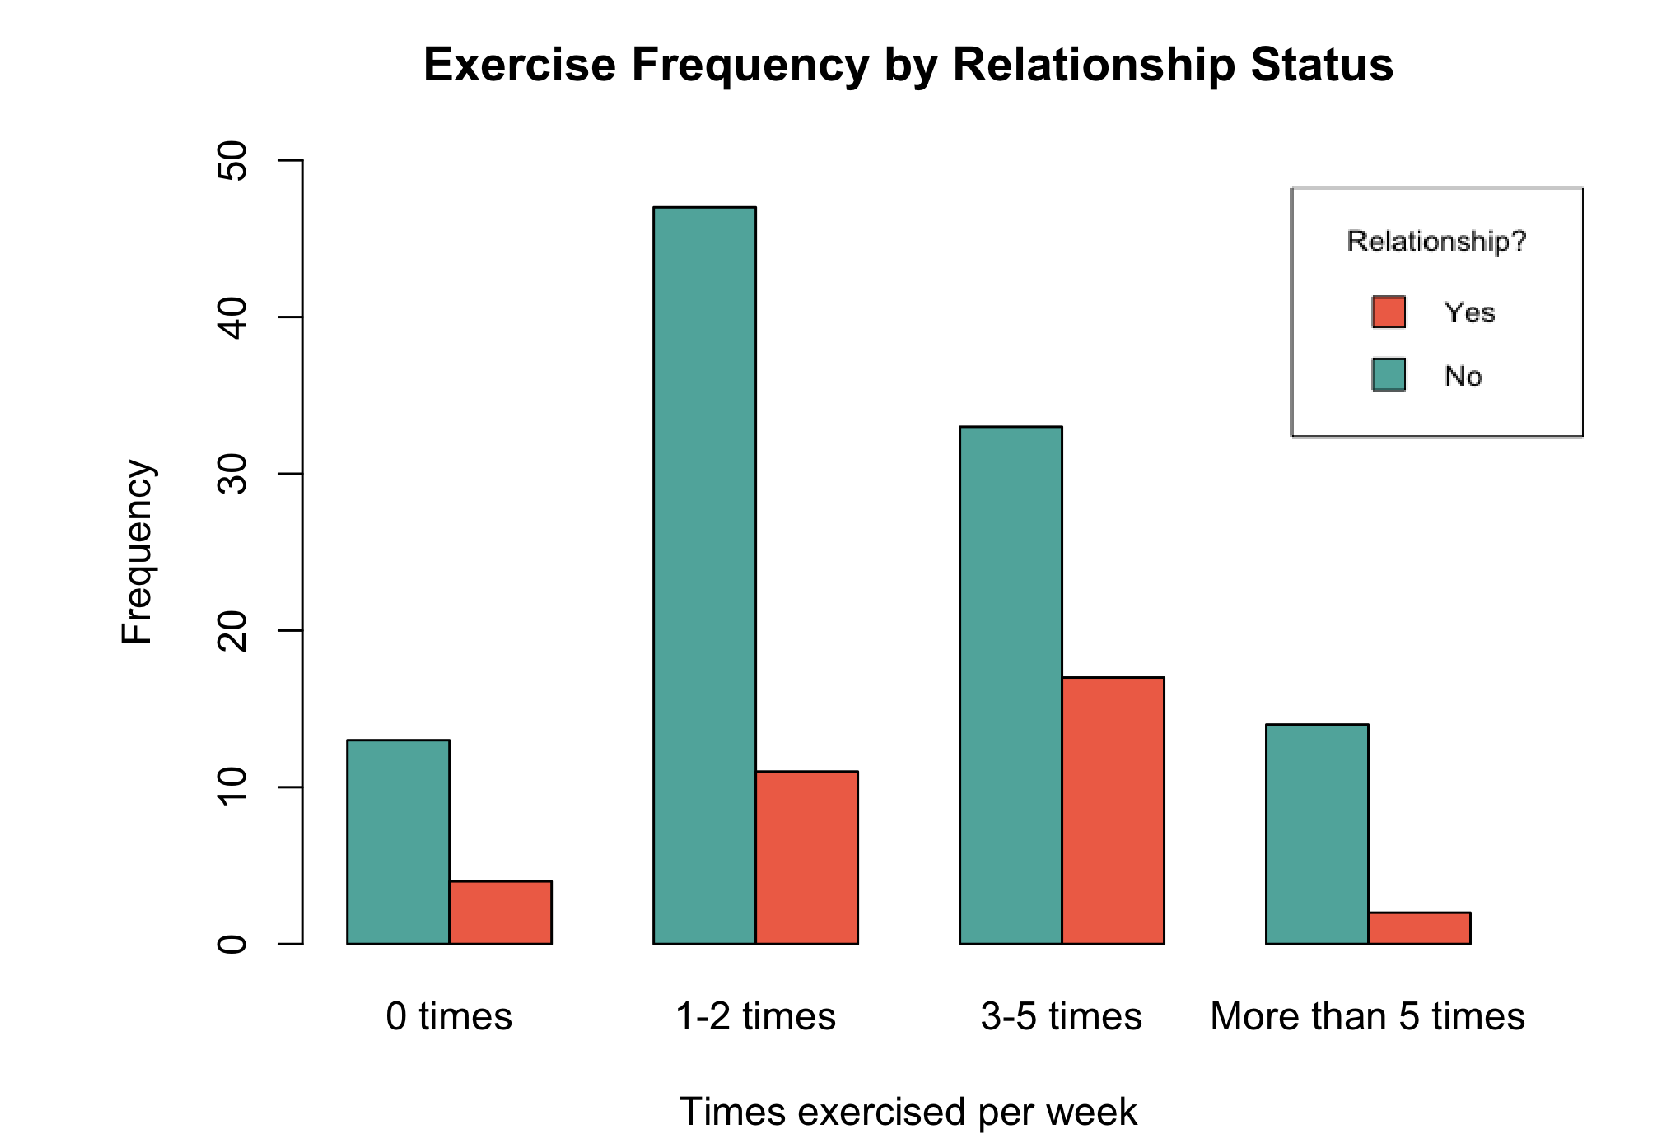
grouped bar chart
used to display 2 categorical variables
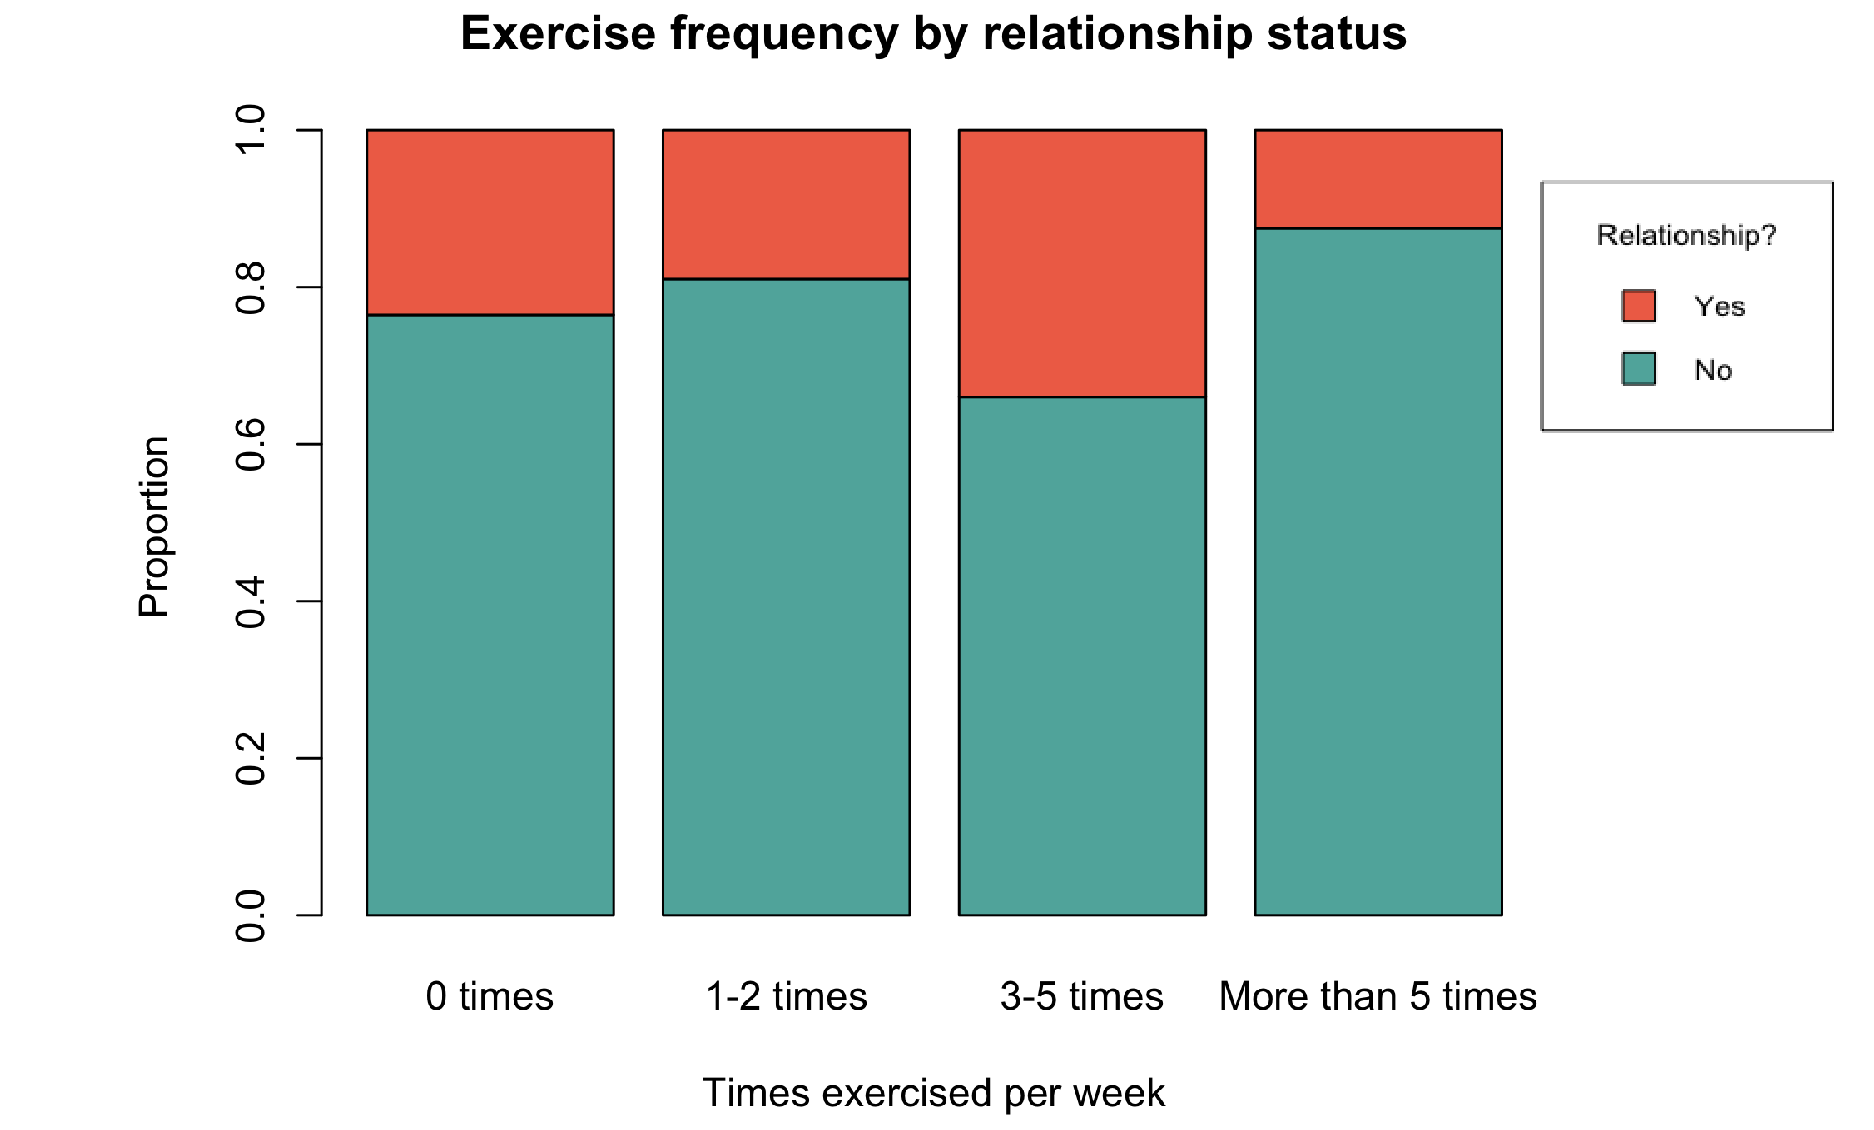
mosaic plot
used to display 2 categorical variables, better for when group sizes differ
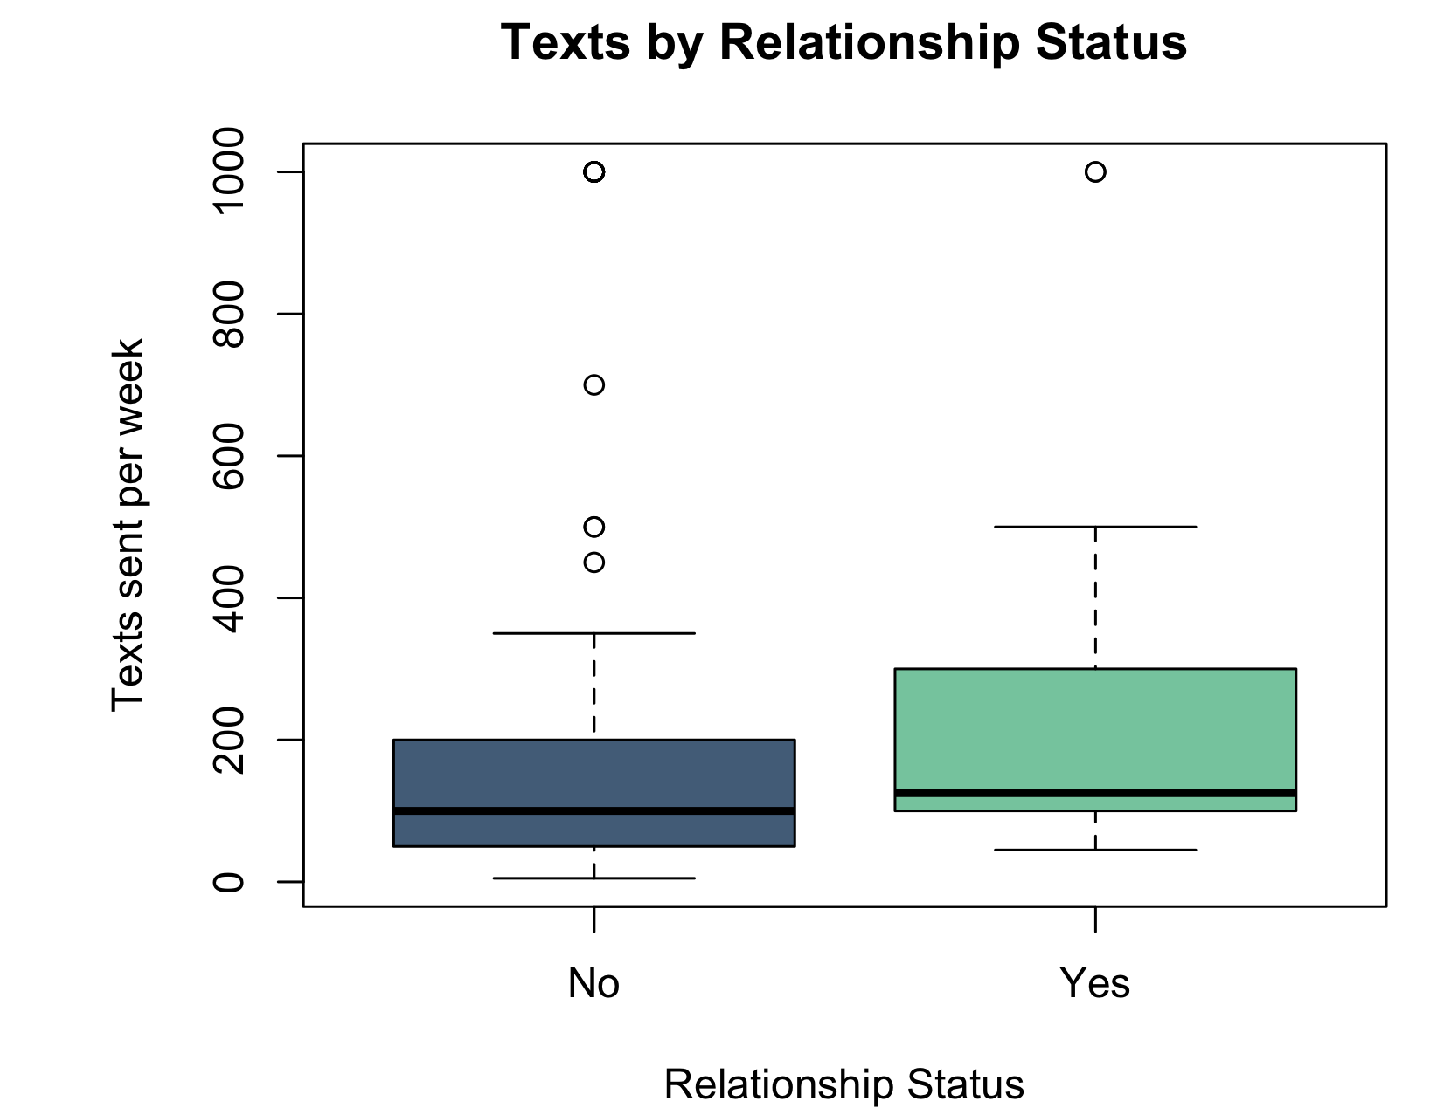
grouped box plot
used to display one categorical, one numeric variable
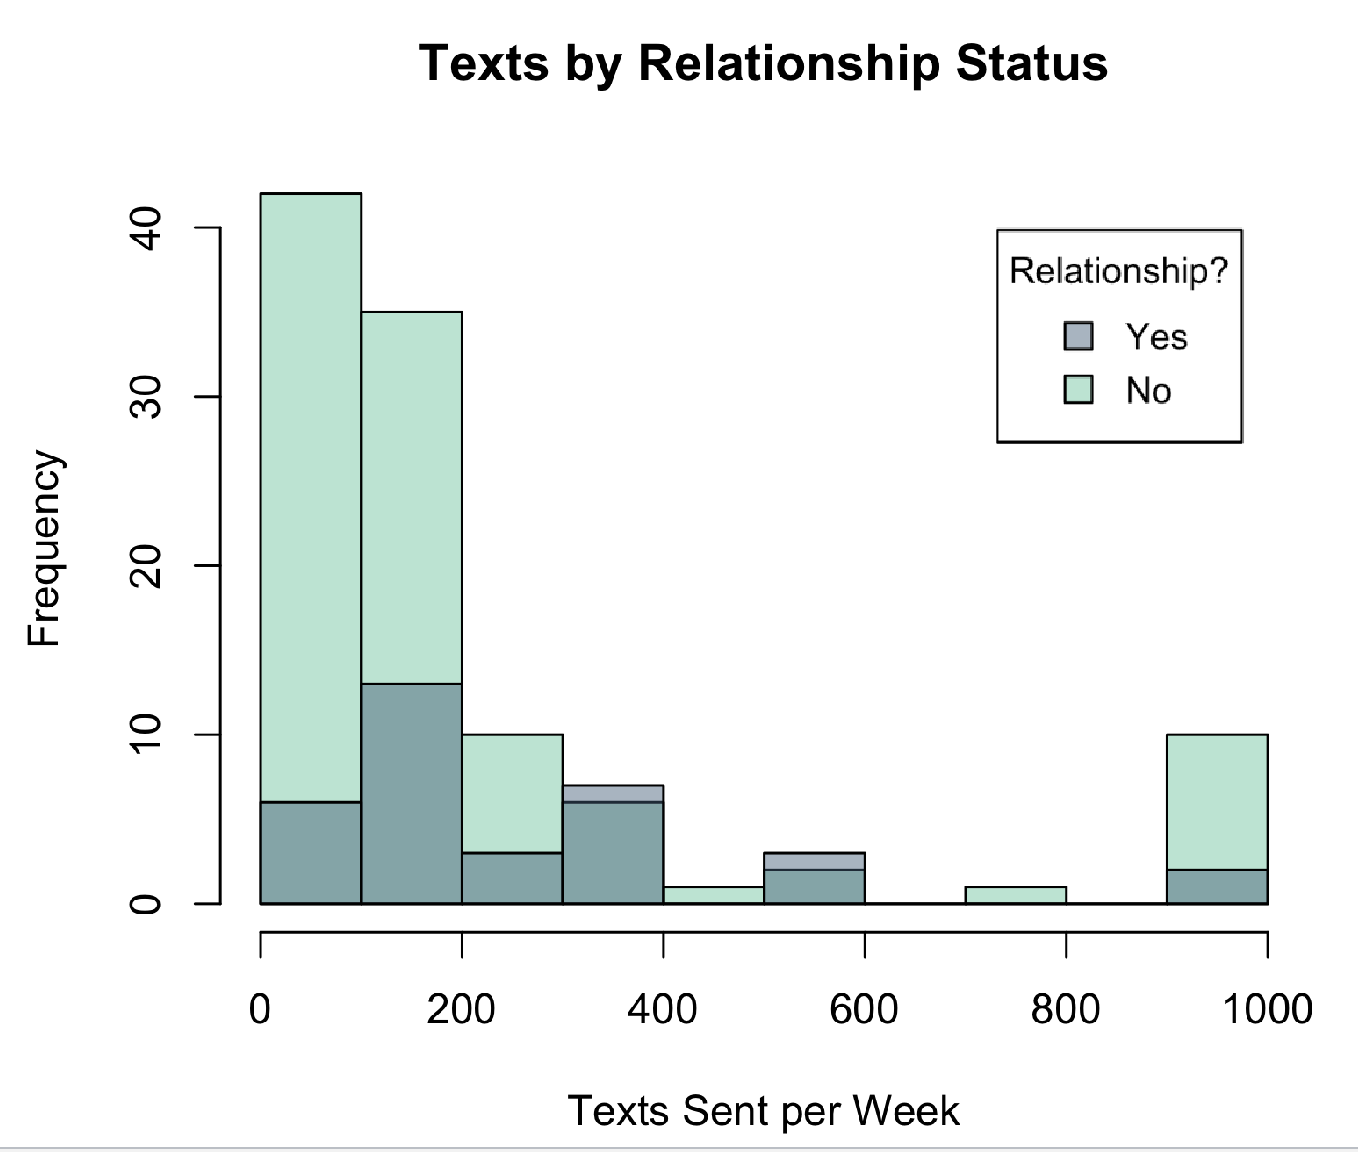
grouped histogram
used to display one categorical, one numeric
pearson correlation (r)
tells strength and direction of linear relationships
law of large numbers
probability of an even is what its relative frequency will converge on after infinite trials
or probability
pr(a or b) = pr(a) + pr(b) - pr(a and b)
removes overlap
mutually exclusive events
pr(a and b) =0
and probability
pr(a and b) = pr(a) * pr(b|a)
to remove overlap
conditional probability
pr(b|a)
probability of b, given a has already happened
reduces sample space