Performance Final
1/115
There's no tags or description
Looks like no tags are added yet.
Name | Mastery | Learn | Test | Matching | Spaced |
|---|
No study sessions yet.
116 Terms
Performance Calculations
to know Weight and Calculate Profit from payload
Payload
Weight of Pax, Baggage, & Cargo.

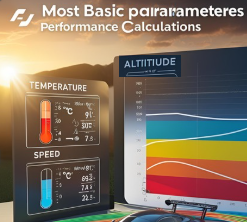
Basic Parameters affecting aircraft's performance
(1/∝)Temperature
(1/∝)Altitude
(∝)Speed
Temprature benefits in aviation
Performance Calculations.
Determining Icing Conditions.
Airspeed and Altitude Correction,
for Obtaining True Calculations
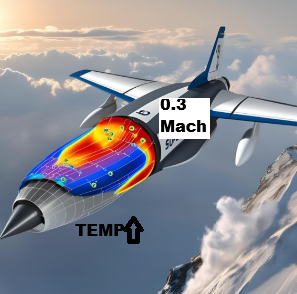
Ram Rise
increase Temperature due to
Compressibility.
Negligible Until: 0.3 Mach speed
Static Air Temprature (SAT) (or) Outside Air Temprature (OAT)
temperature of
Free moving, Undisturbed Air Around an aircraft
corrected for Instrument & Compressibility Errors
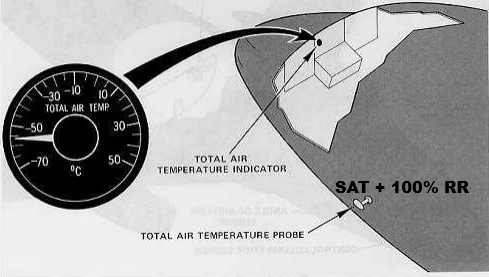
Total Air Temprature (TAT)
“SAT”+ 100% of Ram Rise
Determines N1/EPR limits
obtained by TAT Probes
Ram Air Temperature (RAT)
SAT + Specific % of Ram Rise.
Altitude
Elevation with respect to an assumed reference level
Barometric Altitude
reduction in air pressure with an increase in altitude
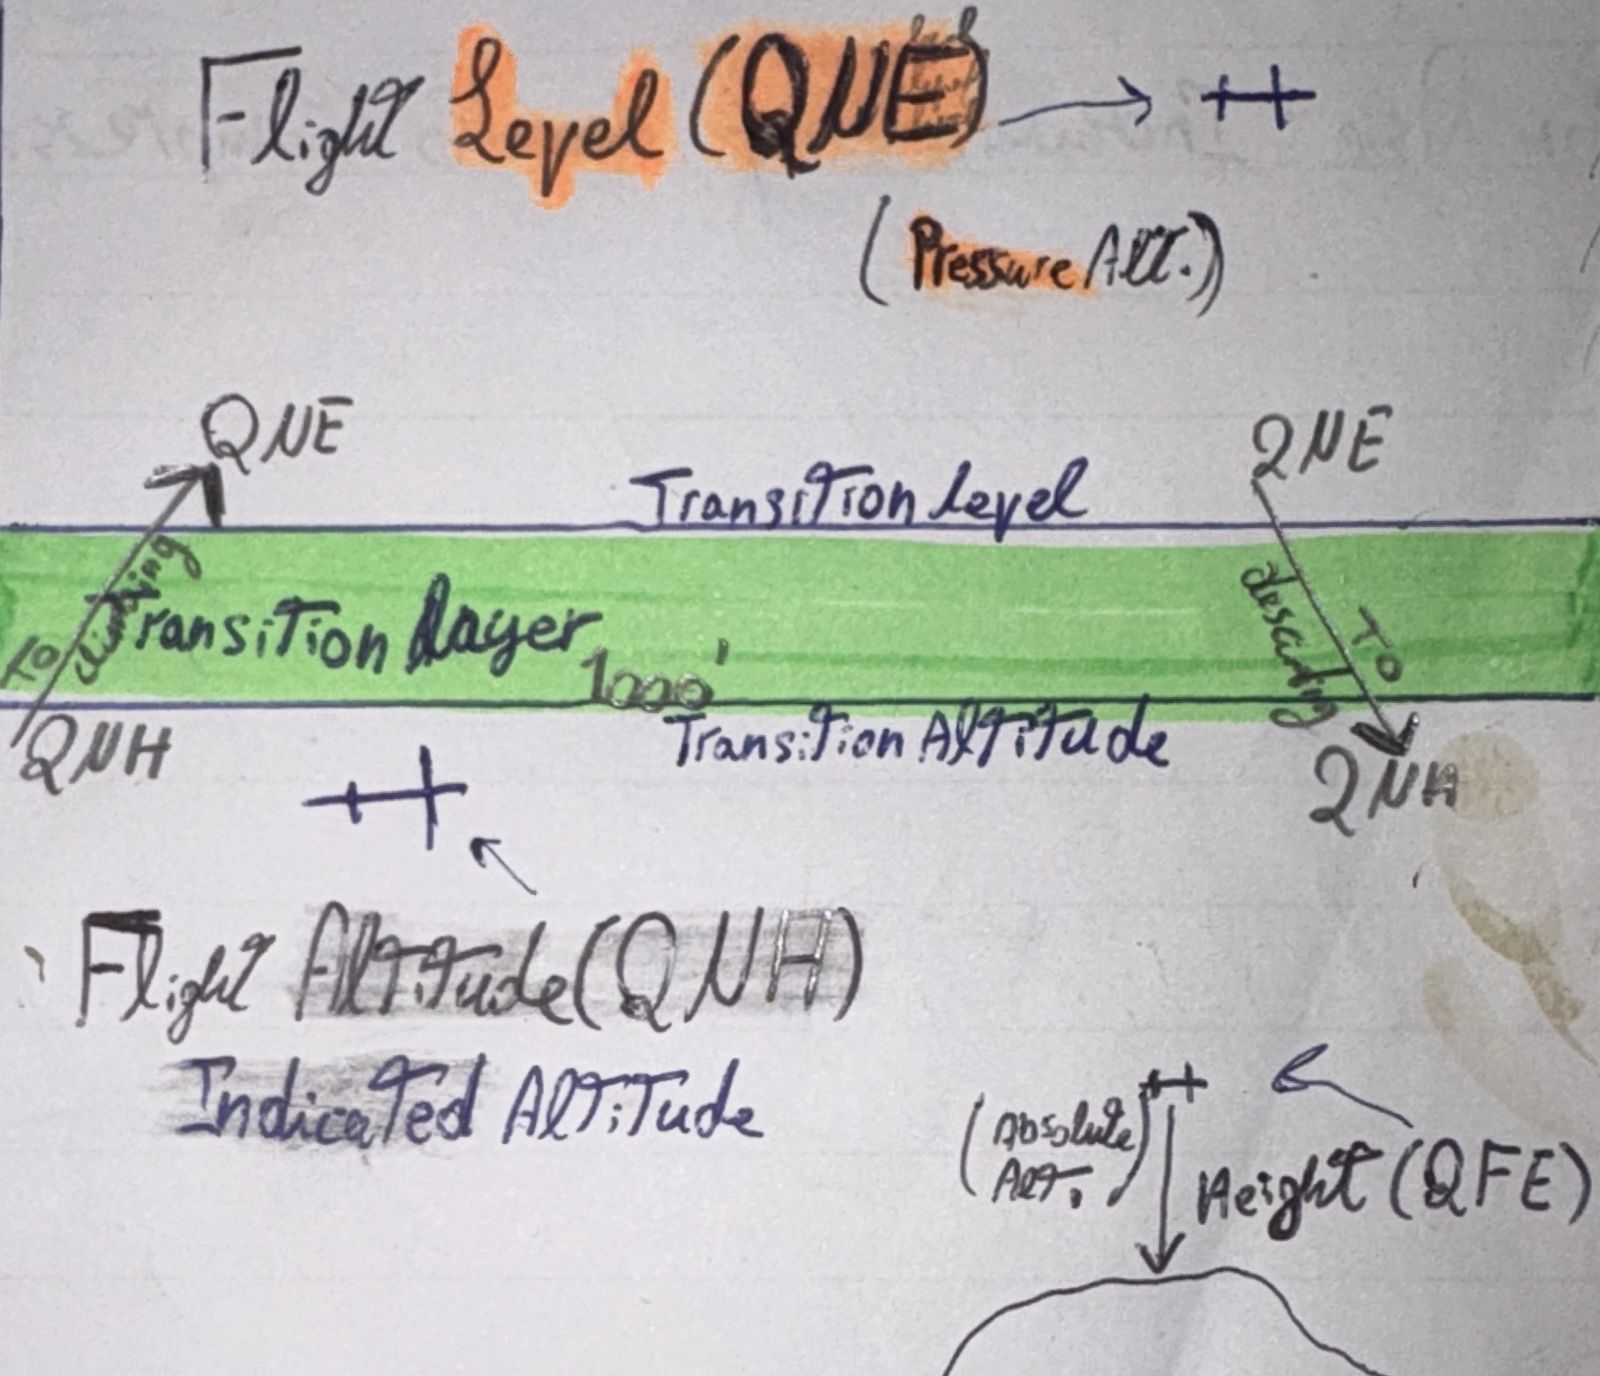
QFE (Height)
Altimeter setting that indicates height Above Ground Level (AGL)

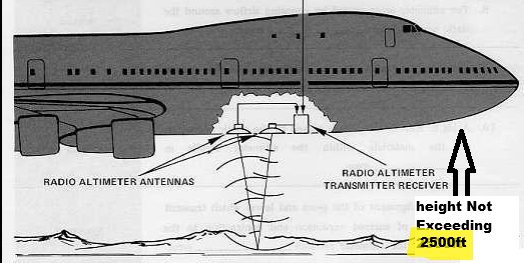
Absolute Altitude
Height Above Terrain
Measured by RA
not exceeding 2500 feet
QNH ‘Local Altimeter Settings’
Altimeter setting used Below Transition Layer
when aircraft's fly with reference to
Mean Sea Level, Giving Indicated Altitude
Indicating Elevation, Provided by ATC

Indecated Altitude
Altitude on the altimeter when set to QNH
indicates the aircraft height above MSL

Transition Altitude
Highest available to use below the transition layer.
where transition from QNH To QNE
if Climbing should begin

Transition Layer
1000ft layer between
transition altitude & level
ensuring Vertical Separation of aircraft
Operating on Different Altimeter Settings

Transition Level
Lowest available for use Above the transition Layer.
where transition from QNE to QNH
if Descending should begin

QNE
Altimeter setting used Above Transition Layer
when aircraft fly with reference to Flight Level
@ Standard Pressure 1013.25Hpa
and “Pressure Altitude”

Pressure Altitude
Altitude on the altimeter when set to QNE
@ISA
which is 1013.25 hectopascals (hPa)
or 29.92 inches of mercury (inHg).
Density Altitude
Pressure altitude corrected for non-standard Temp.
used for (Perf. Calculations)
DA=[Non stndr temp. - 15°c] x120+PA
![<p><strong>Pressure altitude</strong> <strong>corrected </strong>for <strong>non-standard Temp.</strong></p><p><strong>used for (Perf. Calculations)</strong><br>DA=[Non stndr temp. - 15°c] x120+PA</p>](https://knowt-user-attachments.s3.amazonaws.com/e20ddd61-14f9-4449-9dd5-f69b113f118d.jpg)
True Altitude
Actual Height of an object above Sea Level
not indicated by any instruments.
in ISA conditions, MSL = SL, so True Alt.= Indecatied Alt.
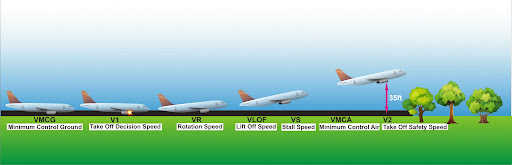
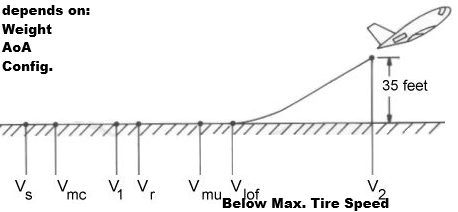
Takeoff speeds
V1, VR, V2, VMU, VMCG, VMCA
Safety key element for takeoff,
Enabling Pilot’s:
Situational awareness &
Decision-making in this
very dynamic stage.
misuse of takeoff speeds can lead to;
Tail strikes, High-speed Rejected takeoffs
Vs1g
Stall speed @ which airflow Separation Begins,
but Not Full wing stalls for ailerons to Stay Effective.
Highest point in the 'CL and AoA curve.'
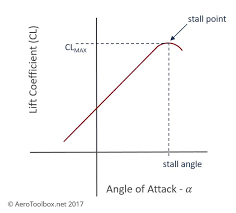
Vs
Stall speed where Airflow
Separates Completely & Wing fully stalls.
VMCG
Minimum Control speed on Ground
at which aircraft still Controllable using Maximum Rudder Deflection only.
in case of 😞 engine failure & Other engine on T/O Thrust
Decrease with
(high, high)—>Temp., Alt.
VMCA
Minimum Control speed in Air (Flight)
at which aircraft still Controllable using Maximum Rudder Deflection only.
in case of 😞 engine failure & Other engine on T/O Thrust
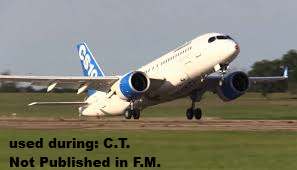
VMU
Minimum unstick speed.
Lowest speed where aircraft can safely be Airborne
Without Encountering Tail Strike.
Used during Certification Testing,
Not Published in most Flight Manuals.
V lof
actual speed at which the airplane lifts off. depends on:
Weight,
(AoA) angle of attack,
Configurations.
Must always be Below
Maximum Tire Speed.
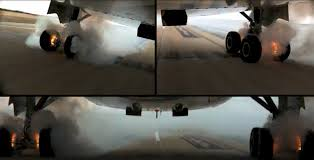
limited by: Maximum Tire speed
Maximum Tire Speed
Strength of the tires determines this speed due to the Exposure to
⬆Centrifugal forces @⬆Speeds
✈ Why it matters more at high-elevation airports:
As Altitude ⬆, Density↓
To generate same lift higher True Airspeed (TAS) is needed.
Indicated airspeed (IAS) might be normal, But TAS may exceed the tire limit
VMBE
Maximum Break Energy Speed for
Full Braking to a Complete Stop, within Braking System's Heat Limitations
Depending on
Temperature,
Pressure,
Weight,
Runway Slope
Wind.
V1
speed whether you Reject or Continue the takeoff.
Not a Decision but Action speed,
where the 1st Braking Action must be Applied in case of aborted T/O
limits:
Minimum VMCG
Maximum VR & VMBE
VEF
Speed @ which critical engine is assumed to Fail. was 1 second,
now 2 seconds before Action speed (V1)
to allow pilots to react to
😞engine failure.
VR
Speed at which the airplane is rotated for liftoff. Ensures reaching V2 at screen height.
Minimum (Lower limit) V1, & 1.05 VMCA
V2
Take Off Climb Speed
Reached @ Screen Height
& Maintained for the entire climb with takeoff Flaps,
in an 😞engine failure at or after V1.
Minimums (Lower limits) are:
1.1Vmca,
1.2 Vs,
1.13Vsr
In all‑engine takeoff, Climb is made 10–15 kts above V2
Screen Height
35ft for dry,
15 for wet runways,
50 For Class B aircrafts
above the takeoff surface after an engine failure at V1,
at which V2 speed must be reached.
Take off Preformance
Determining 3 things during this initial phase:
Capabilities and Limitations of aircraft
Minimum Runway Length Required for Safe Takeoffs,
Best Fuel Consumption
which-Ensuring passenger safety
-Reducing Wear on aircraft
-Optimizing flight schedules.
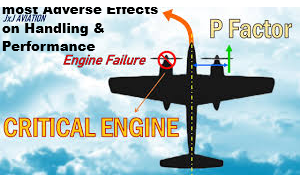
Crtical Engine
in ↔Multi-engine aircraft with the Most Adverse Effects
on aircraft's Handling and Performance⚙️
in case of its 😞Failure.
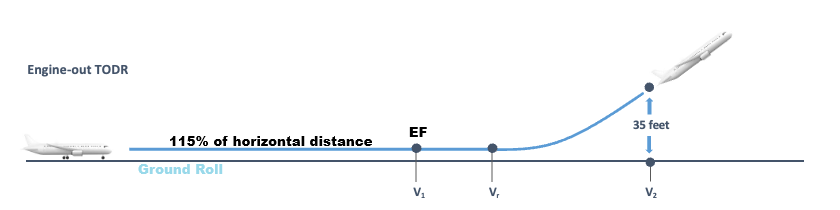
TODR
Take-off Distance Required
Horizontal distance starting from;
Ground Roll until reaching 35 feet above take-off surface in case of 😞Engine Failure @V1
with all engines operating, 115% of horizontal distance, starting from ground roll to the screen height,
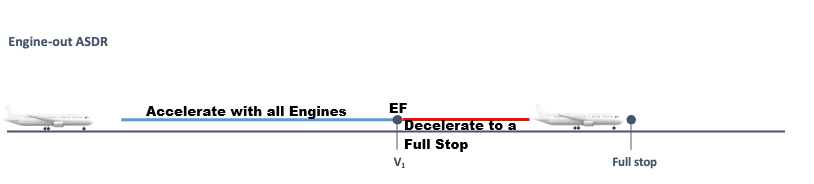
ASDR (Accelerate Stop Distance Required)
Sum of the Distances required to:
1) Accelerate with All Engines
2) Decelerate to a Full Stop
In Case of EF @ V1
TORA (Takeoff Runway Available Length)
portion of the runway, that is available and suitable for an aircraft to accelerate to lift-off speed.
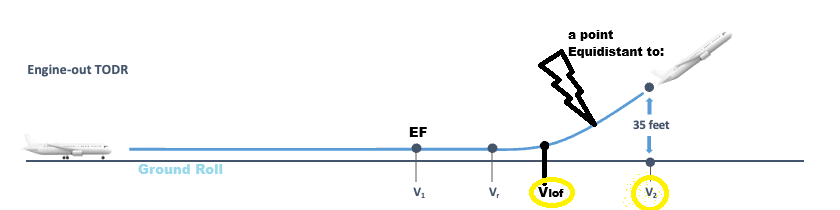
TORR (Take-Off Run Required)
Horizontal distance from ground roll until reaching
a point equidistant to Vlof &V2
above the takeoff surface in case of 😞EF @ V1
Must not exceed Runway Length
Stop way
Beyond the Runway, above its Extended Centerline, Under Airport Authorities,
Must be Rigid surface.
As Wide As Runway,
Increasing aircraft's Weight,
that it's Able to Support aircraft's Weight, during an Aborted T/O.

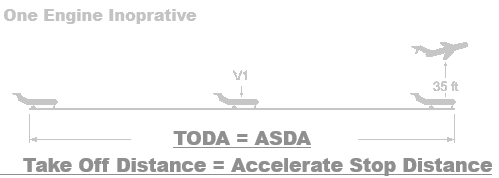
ASDA (Accelerated Stop Distance Available)
Runway Length + Stopway

Clearway (CWY)
Area Clear from objects or terrain.
Beyond the runway, above its Extended Centerline, Under Airport Authorities,
Might Not be a Rigid surface.
Minimum Width of 500 feet,
Upward Slope not exceeding 1.25%
Increasing Weight & Decreasing V1
to enhance Accelerate Stop Distance.
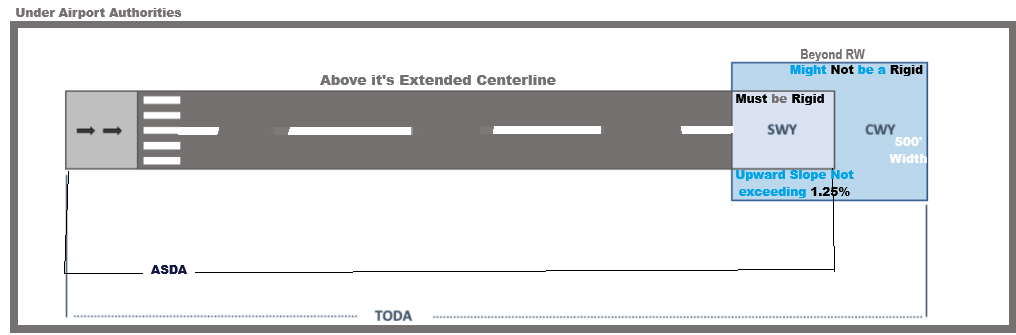
TODA (Takeoff Distance Available)
Runway length+ Clear Way

Balanced Field Length
TODR=ASDR
Clearway or Stopway are 'Not Used'
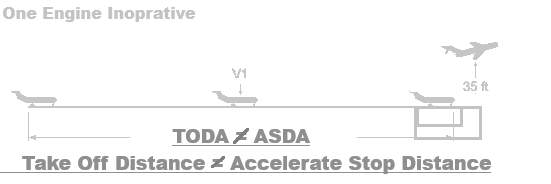
Unbalanced Field Length (mtkawesa)
TODR ≠ ASDR
Clearway or Stopway Used
Balanced Takeoff
TODR = ASDR
Balanced V1
V1 when the TODR = ASDR

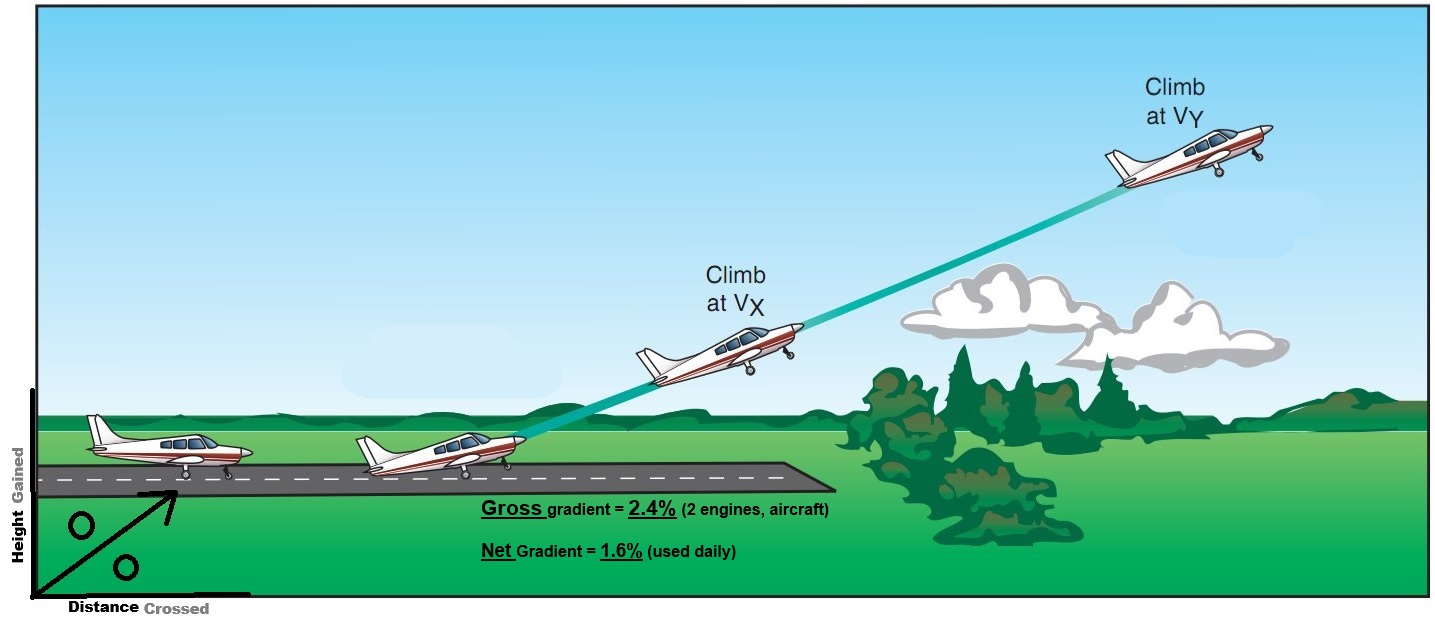
Climb Gradient
Percentage (%) of Height achieved to
Ground Distance covered.
Factors Affecting Net & Gross Gradients (weight)
• Flaps Configuration
• V1
• V2
Notical mile
=6067 feet
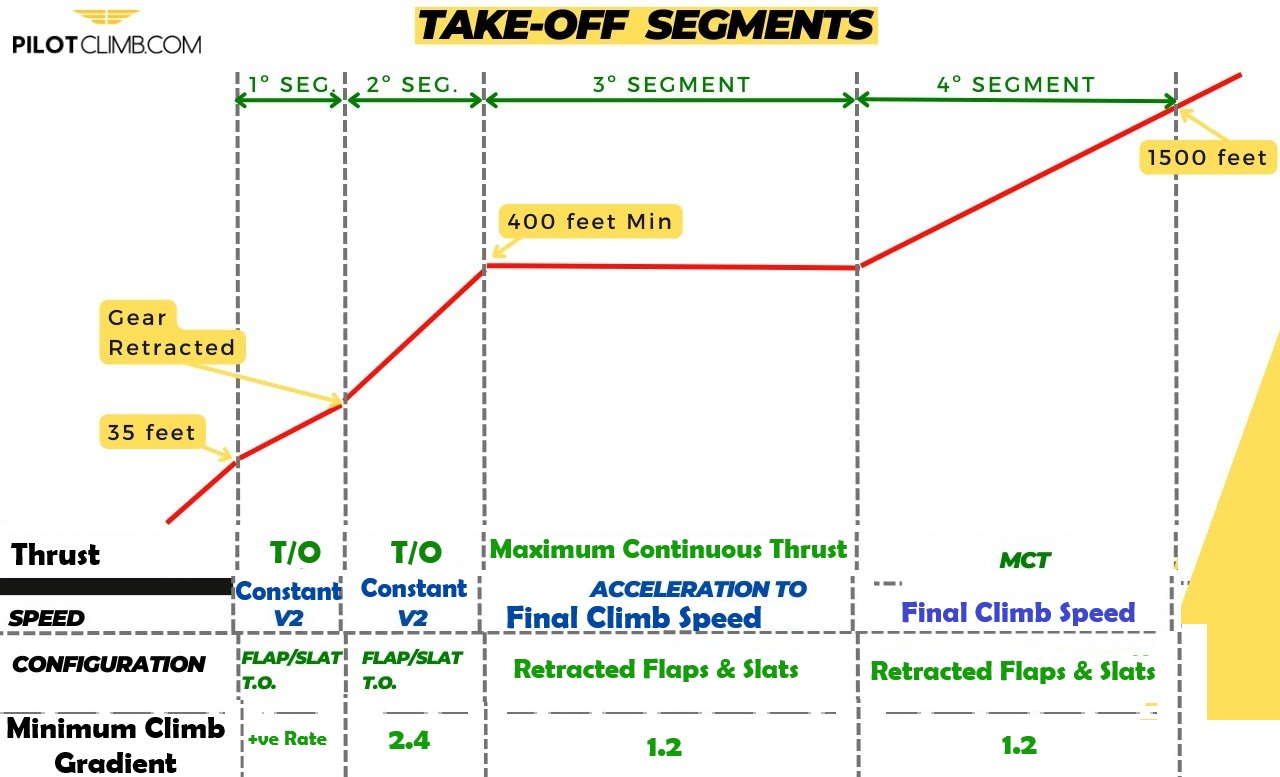
TakeOff Path
actual flight path from 35ft to 1,500ft above the takeoff surface
in case of 😞Engine Failure.
Thrust
Pushing force exerted by the engine of an aircraft.
Affected by: (ptha)🏠
1.Pressure
2.Temperature
3.Humidity
4.Airspeed
Net Path Clearence
Must clear Obstacles by 35’ft
(Gross Climb Gradient - 0.8%)
1st Sigment
start from 35’ till
Landing Gear Fully Retracted, @ constant V2 speed
using
T/O Thrust, T/O Slats & Flaps,
with +ve Minimum Climb Gradient
2nd sigment
From Landing Gear fully Retracted to at least 400’ AGL
Egyptair uses (800’ ft Engine Out Acceleration Height) for safety
@constant V2 speed
using
T/O Thrust, Slats & Flaps,
2.4% Minimum Climb Gradient
1.6% Net G.
3rd sigment
Horizontal Distance to Accelerate to Final Climb Speed, using
T/O Thrust
while Flaps and slats Retraction.
4th sigment
Start from End of Third segment
to at least 1500ft @ Final Climb Speed using
Maximum Continuous Thrust (MCT)
Retracted Slats & Flaps
1.2% Minimum Climb Gradient
Take/Off Thrust
Maximum Thrust Engine Can Produce for
5 minutes 'Both Engines operating'
10 minutes in case of EF.
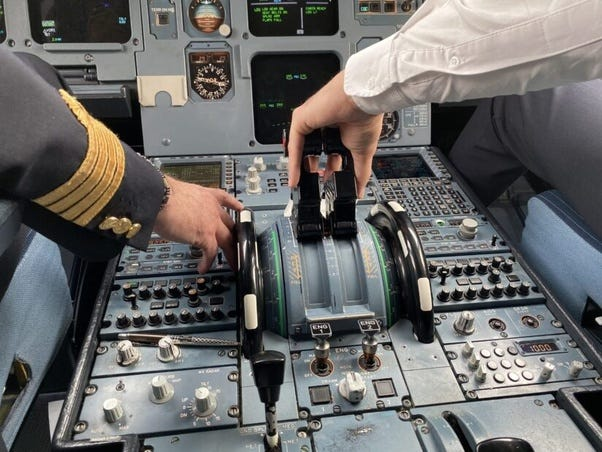
Go/Around Thrust
same as the maximum takeoff thrust,
with the higher speeds during go-around
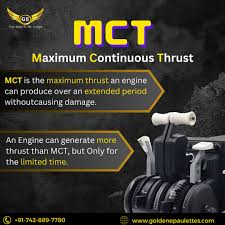
Maximum Continuous Thrust
Maximum Thrust Engine Can Produce in Case of Engine Failure Continuously.
Maximum Climb Thrust
Lower than Maximum Continuous Thrust
used in reaching Cruise Speed.
En-route climb & Step Cimb
Step Climb
Series of altitude Gains,
Improving Fuel Efficiency
by Moving into Thinner air.
Preformed around Optimum Altitude,
within 1% Loss range.
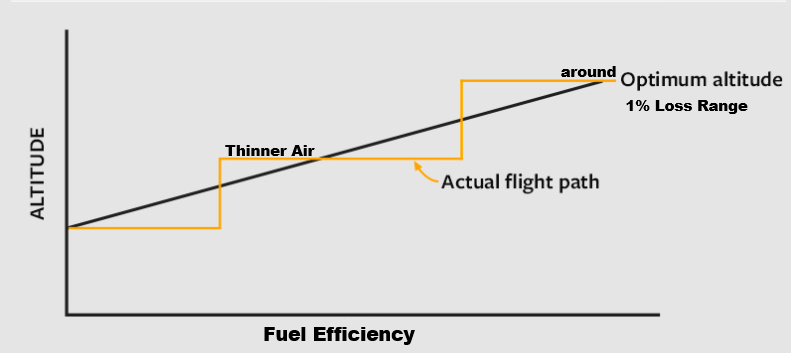
Optimum Altitude
Altitude at which Best Fuel to Milage occurs.
Wind Altitude Trade (or) Break Even Wind
Wind Required to Maintain Present
Specific Range @New Altitude.
Maximum Cruise Thrust
Maximum thrust usable during the cruise
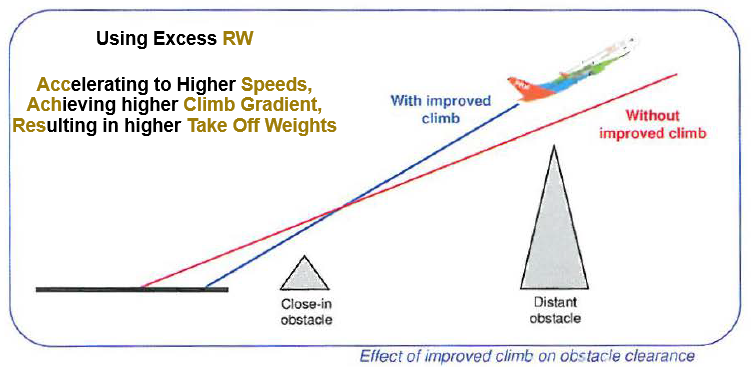
Improved Climb Performance Technique
Using Excess RW
Accelerating to Higher Speeds,
Achieving higher Climb Gradient,
Resulting in higher Take Off Weights
QRH
stands for Quick Reference Handbook.
Includes T/O performance tables and charts.
Accessible anytime by pilots, Usable at any airport or runway Unlike
RTOW, which is specific to certain airports/runways.
Does NOT account for obstacles in the takeoff path.
Items Affecting Takeoff Performance
✅ Controllable Factors:
Aircraft Configuration:
Trim devices
Flaps, slats
Spoilers
Landing gear position
Wheel Brake Configuration:
Antiskid system (ON/OFF)
Engine Thrust Setting:
full rated thrust or reduced thrust
• Gross Weight:
Adjusting payload or fuel to meet performance requirements
❌ Uncontrollable Factors:
Runway Length
(clearway / stopway availability)
Runway Condition:
Wet, dry, snowy
Smooth or rough surface
Runway Environment:
◦ Temperature (OAT) and Pressure Altitude (PA).
◦ Runway Slope (± 2%).
◦ Wind Components (Headwind or Tailwind).
Obstacles: in the takeoff path
Optimum Takeoff Flaps Settings
Compromisation between 2 values
if Runway's the problem,
more flaps are useful.
if Climb Gradient's the problem,
fewer flaps are useful.
Regulated TakeOff Weight (RTOW)
Maximum Takeoff Weight limited by:
Climb limit
Tire speed limit
Runway limit
Brake energy limit
Obstacles limit
Structure limit
Factors Affecting Engine Thrust
Pressure
Temperature
Humidity
AirSpeed
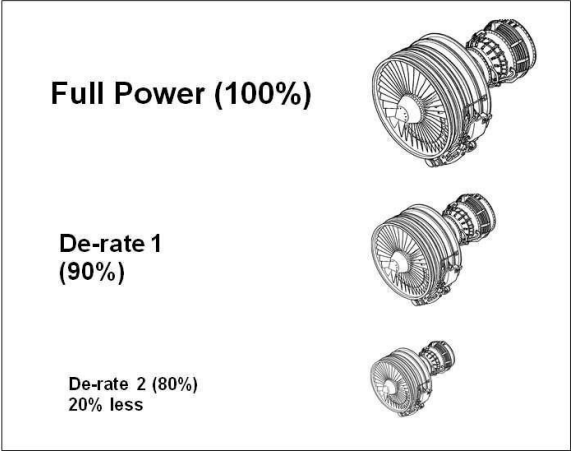
thrust reduction
Allowed by regulations, but:
Must not exceed 25 (Minimum= 75% of full-rated takeoff thrust)
Two methods
Assumed Temperature Method (ATM)– Boeing
-Flex Temperature (Flex) – Airbus
De-rate For Boeing
'ATM' Assumed Temprature Method for Boeing
'FLEX' Fexible temperature for Airbus
Easily calculated Dictated Temp.
Limiting Actual T/O Thrust
Reducing Cost by ⬇Stress on Turbine, ⬆Engine Life
& Fuel Effeciency
D-Rate for Boeing
Replacing the full rated engine by another less thrust engine. Through the FMC.
De-rated engine is an entirely different engine but when using the ATM or flex: the VMCG is calculated based on the full rated thrust
Flat Rated Power
Maximum Thrust Output based on Ambient Temperature
Provided by the Engine
EPR
Engine Pressure Ratio: Measuring Thrust
Tref
highest Temperature engine can provide Flat rated power.
Power starts to Decrease After, due to Temp. increase
Tmax
Maximum temperature at which the engine Can provide thrust.
Climb
Portion of flight
Starts at the End of Takeoff Segments &
Beginning of En-Route Climb.
Angle Of Climb
Gaining of Altitude per unit of Horizontal Distance
Best Angle Of Climb 'Vx'
Speed @ which Shortest Distance is required for reaching
a Specific Altitude.
Rate Of Climb
Gaining of Altitude per unit of Time.
Best Rate Of Climb "Vy"
Speed @ which Shortest Time is required for reaching
a Specific Altitude.
IN CASES OF EMERGENCY. FROM THE INITIAL CLIMB TO TOP OF CLIMB (TOC)
• 250 KIAS below 10,000ft referred to as constrained speed (KIAS knots of indicated airspeed)
• 300 KIAS/ 0.78 Machmaintaining 300 knots until switch into Mach number usage
• 0.78 Mach / 300 KIASfor descent • 250 KIAS below 10,000f
Cruise
Phase of flight, From Top of Climb to Top of Descent
approximately 90% of flight.
main pilot's task in this phase is
saving fuel as much as possible
Load Factor (or) G Factor
relation between Lift produced to
Gross Weight
Opposing it.
Maneuvering Margin
Ability of Air surrounding the wings to
Support the aircraft's Weight at High Altitudes
Apparent Gross Weight (or) Equivelant Weight
Actual weight of A/C multiplied by the G Factor.
Consisting of:
1. Weight
2.Lift & Gravitational forces of Vertical Acceleration & horizontal Stabilizers
4.Centrifugal forces (in TURNS)
Buffet Boundries
low and high speeds for Initial Buffet
at any Given Altitude and Weight
Low Speed Buffet
caused by Air-flow Separation before Stall.
High Speed Buffet
caused by Shockwaves Formation
Speed Margines (Buffet Margine)
Margin between low and high speeds for initial buffet
at any given Altitude and Weight
Coffin Corner (or) Q Corner (or) Aerodynamic Ceilling
Altitude where it's difficult to keep an airplane in Stable flight where there is
No Margin between low & high-speed buffet boundaries,
while Load Factor is 1.0 g.
Endurance
‘How Long You Last?’
Maximum Time Engine can Operate on Given Fuel quantity
Range
‘How Far Can You Go?’
Maximum Distance in (NAM) Engine can Operate on Given Fuel quantity
Specific Range
Rate of Distance Traveled per Unit of Fuel
Number of nautical air miles (NAM) the aircraft can fly per 1,000 kg of fuel can be calculated using the following equation
Specific Range (SR) = TAS/Total Fuel Flow
Maximum Range Cruise (MRC)
‘More Miles, Less Rush’
Speed Where Maximum Range
(Distance to Fuel) is Achieved.
Long Range Cruise (LRC)
faster than MRC, saves time with only 1% loss in SR ‘Fuel Efficiency’.