Exam 2
1/56
Earn XP
Description and Tags
IT Exam 2 all Powerpoints!
Name | Mastery | Learn | Test | Matching | Spaced |
|---|
No study sessions yet.
57 Terms
How to plot in Pandas
<dataframe name>.plot(x = “column”, y=”column”)
plt.show()
How to set chart type
<dataframe name>.plot(x =”column”, y = “column”, title = <title>)
plt.show()
“Area” is for:
area plot
“bar” is for:
vertical bar charts
“barh” is for:
horizontal bar charts
“box” is for box plots
box plots
“hexbin” is for:
hexbin plots
“hist” is for:
histograms
“kde” is for:
kernel density estimate charts
“density”
an alias for “kde”
“line” is for:
line graphs
“pie” is for:
pie charts
“scatter” is for:
scatter plots
Plotting categorical data
use value_counts on a categorical data
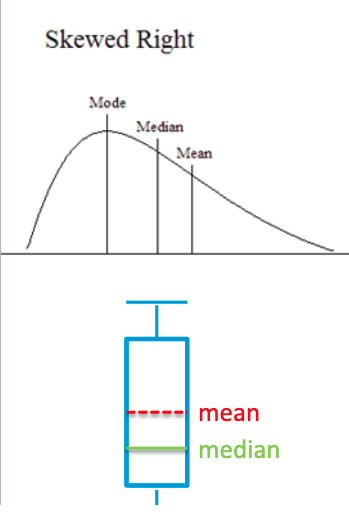
Box Plots
Used to visualize a distribution of data
no x-axi parameter in the plot function
bottom of the box is 25% threshold
median value is the line in box
top of box is 75% threshold
dots are outliers
Skewed Right
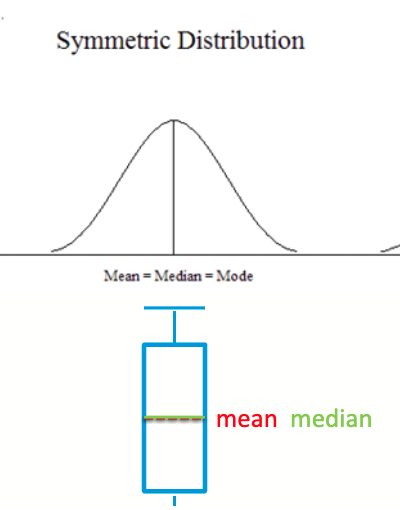
Symmetric
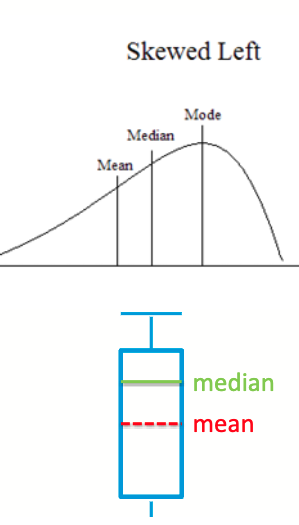
Skewed Left
Exploratory Analytics
Looking at patterns and trends in the data to explain what has already happened
Predictive Analytics
Looking at patterns and trends in the data to explain what will happen (ie forecasting)
Steps for Predictive Models
Learn the relationship between predictors and target
Test if the model has learned the relationship
Training Set
used to learn the relationship
Validation Set
used to test the model
randomly sampled from original data
we can compare target estimates with the known target values to calculate the accuracy or error of the model
Regression
determining the relationship between a variable and one or more other variables
Linear Regression
given a set of observations, determine the equation of a line that can be used to describe the dataset
Exploratory Modeling
obtain the best fit model from all observations
Predictive Modeling
split observations into a training and validation set
General rule for splitting observations into sets
80% used for training, 20% used for validation
Error
absolute of expected - estimated
Mean Error (ME)
the average of the errors
Mean Squared Error (MSE)
the sum of the errors squared, divided by the number of errors
Root Mean Square Error (RMSE)
the square root of MSE
What does fitting a model mean for MLR
solving for the best values of the coefficients
If we have n predictors, how many coefficients is MLR solving for?
n+1
predicted value of y is…
an estimate of y
If we have the actual y, we can…
compare it to the predicted y to understand the accuracy of our model
How do we select the best predictors?
brute force method
plotting the relationships
Brute force method
use all predictors, measure the error
take out one predictor, measure the error
continue until you have the combination that has the smallest error
Steps for using multiple linear regression with Python
import libraries (pandas, scikit-learn)
import data (read from csv)
split data into training and observation sets
fit training data into a linear model
use the model with the validation set
evaluate the model
Scikit learn
a popular library in python for data analytics, data science, and machine learning
Using the predict function of the model, giving it the x-values will give us…
predictions that we can compare against the y-values from the validation set
R squared
a metric for how well the model is fit to the data (0 —> 1)
aka- how much of the variation in y can be explained by the predictors
Classifiers…
take a set of features and give us back a class label
Classification is…
the process of identifying a label (class) for the data points
What is the difference between regression models and classification models?
the target, or what we are trying to estimate
The premise of the K-Nearest Neighbor (KNN) is…
the most similar class of a data point is the class of its closest neighbors from the training set
How do we know which data points are closest?
need to use a distance metric
by measuring the distance between data points, we are actually measuring the similarity of the data points
smaller the distance, the more similar
larger the distance, the more dissimilar
Euclidean Distance
the distance between two points
Why do we have to scale the data?
so each feature has equal influence on the final decision
Data normalization is necessary with KNN…
because the euclidean distance squares the differences in features
When a datapoint’s features are given but does not have a label…
the model computes the distance between the datapoint’s features and all training data
From the K training datapoint’s…
the predicted class label is identified as the class label that occurs most frequently in the K datapoints
accuracy function
accuracy = accuracy_score(validation_y, predicted_regions)
You have trained your model and are happy with the accuracy. How do you use it?
use the predict function of the model
need to normalize your data first
KNN classifiers require that all features be…
numeric
Encoding
turning categorical features into numeric features
One-hot-encoding
a column with a categorical variable will be expanded in to a column of 1’s and 0’s
the number of columns created will be the number of unique values of the variable