Climate maps / synoptic charts
1/94
There's no tags or description
Looks like no tags are added yet.
Name | Mastery | Learn | Test | Matching | Spaced | Call with Kai |
|---|
No analytics yet
Send a link to your students to track their progress
95 Terms
What is a synoptic chart
A map giving a summary of the weather conditions at a particular time and place
Time that synoptic maps are published
12:00 Zulu time or 14:00 SA standard time (Add 2 hours to UTC)
Why are synoptic maps important
Allows for weather preditction which lets people prepare for flooding from rainfall or evacuation
Main South African Weather stations
Gough Island, Marion Island and Tristan da Cunha
Why does South Africa use Marion Island for the weather station
Allows us to see and predict incoming weather conditions in order to create a forcast
Summer Solstice
21 December
Autumnn solstice
21 March
Winter solstice
21 June
Spritng solstice
22 September
What is an isobar
A line which joins areas of the same barometric pressure
Why is the pressure pattern of isobars important
Where the wind is coming from. 2. How strong the wind is. 3. Areas of high and low pressure
Air moves from
High to low pressure along a gradient
- Isobars that are very close together
Strong winds
Intervals of Isobars
4hPa
(Low pressure zones) Atmosphric pressure of a low pressure zone
Less than 1013 hPa
(Low pressure zones) Another name for low pressure zones
Depressions/cyclones
(Low pressure zones) Movement of low pressure cells in the Southern hemisphere
LIRC. LOW pressure. Air is sucked INWARDS. Air RISES which results in clouds. Air moves towards the centre in a CLOCKWISE motion and cells form a spin (this spin can cause hurricanes and cold fronts)
(Low pressure zones) Movement in the northern hemisphere
Air moves anti-clockwise due to the coriolis force
(Low pressure zones) Weather conditions of a low pressure zone
Rain, clouds, windy (Low-sy weather, air is rising and therefore forms clouds)
(High pressure zones) Atmospheric pressure of a high pressure zone
More than 1013 hPa
(High pressure zones) Another name for high pressure zones
Anti-cyclones
- (High pressure zones) Movement of high pressure cells in the southern hemisphere
HASO. HIGH pressure. Air moves ANTICLOCKWISE. Air is SINKING (warm cloudless weather). Air is moving OUTWARDS.
(High pressure zones) Movement of high pressure cells in the northern hemisphere
Clockwise due to the coriolis force
(High pressure zones) Weather conditions of high pressure zones
Clear skies (air is pushing down), littlw wind (Heavenly weather)
Descending air diagram
High pressure zone, air sinks/subsides
Ascending air diagram
Low pressure zone, air is rising/ascending
- (Pressure cells) High pressure cells names
South atlantic high pressure cell (on the left of SA), South Indian high pressure (on the right of SA) and Kalahari high pressure (on the land, indicates winter)
(Pressure cells) Factors causing high pressure
Altitude, 2. Temperature, 3, Season, 4.Water vapour, 5. Type of movement
(Factors causing high pressure) Altitude
Sea level means there is more air, there is more weight / pressure pushing air down
(Factors causing high pressure) Temperature
Cold air sinks
(Factors causing high pressure) Season
In winter it is cold and therefore the air is heavier
(Factors causing high pressure) Water vapour
Dry air is heavier
(Factors causing high pressure) Type of movement
Divergence, the air sinks and goes out (diagram)
(Pressure cells) Factors causing low pressure
Altitude, 2. Temperature, 3, Season, 4.Water vapour, 5. Type of movement
(Factors causing low pressure) Altitude
The higher the area the less air there is and air pressure decreases
(Factors causing low pressure) Temperature
Warm air rises
(Factors causing low pressure) Season
Summer means that it is warmer and miore air is rising
(Factors causing low pressure) Water vapour
Higher humidity means more clouds
(Factors causing low pressure) Type of movement
Convergence, air moves upwards and meets to form clouds (diagram)
Temperature
refers to how hot or cold it is
Temperature measurement
Using a thermometer and is represented in degrees celsius
Precipitation
Refers to any form of moisture that falls from the sky
Forms of precipitation
Rain, hail, snow
Rain
Water droplets that fall from the sky
Rainfall measurement
Measured using a rain gauge and is represented in millimeters
Wind
moving air
Meteorolgists meausure wind
The direction and speed
Wind direction
Determined using a wind vane or wind sock
Wind speed
Meaured using an anemometer and is recorded in knots (intervals of 5)
Cloud cover measurement
No instrument, is done with eyes
Expression of cloud coverage
In eights, never simplify
Cloud coverage indication
Of what weather to expect
Elements that weather station models measure
Precipitation, Temperature, wind speed, wind direction, cloud cover
Weather station model
A symbolic illustration of the weather occuring at a given reporting station compiled by meteorologist
Wind pressure is measured
Using a barometer
⅛ Cloud cover
line in the middle of circle
2/8 cloud vover
quarter of the circle
4/8 cloud cover
half of the cirlce
6/8 cloud cover
three quarters of the cirlce
8/8 cloud cover
full cirlce
Sky obscured
x over the cirlcle
Max temperature
top number
Dew point
bottom number
Weather
middle dot with a symbol
Wind speed
feathers
Wind direction
is dependant on where the wind is going
Wind name
Depends on where the wind is coming FROM
Wind speed 10 knots

Wind speed 15 knots

Wind speed 5 knots

Drizzle symbol

Fog or mist symbol

Hail symbol

Rain symbol

Shower symbol

Sleet symbol

Snow symbol

Thundestorm symbol

Max temp and dew point close together
higher chance of rain
Who needs to understand the weather
pilots, ships, sporting, farming, construction (safety)
Steps to read a synoptic chart
Find south africa, find the date (indicates season), find the time, key
Influence of oceans on the areas adjacent to them
Warm agulhas on east causes ait to be warmer, humid, and unstable thus increases the rainfall. Cold on westcoast due to benguela, air above the ocean holds little moisture anf therefore fog can form with very little rainfall
Influence of latitude
Type of high pressure zones. South atlantic high, kalahari high, south indian high
South Atlantic high pressure
Causes stable conditions on west coast, can ridge in behind the front and pushes a cold front across the land (WC). Elongated air mass pushes air
South Indian high pressure
Causes north easterly or south easterly onshore winds (warm air from agulhas current is pushed onto the land). Brings rain to the eastern sude and is further from the land in summer but moves closer in winter
Kalahari high pressure (inland high pressure)
Lower in winter as the mass is cold and less air is rising, clear skies no rain in winter - leads to frost. ONLY IN WINTER . (Don’t receive warm air from agulhas over the plataeu because of the khp)
Cold front shape
Warm front shape
Cold fronts
Moves from the west in an easterly direction across SA
What happens when cold air behind the front reaches the warm air in front
storms and rains occur (eg capetown rain in winter)
Temperature of front
Follows BEHIND the front
Troughs drawing (elongated lp)
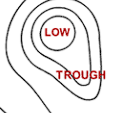
Troughs
An elongated low pressure cell that is often associated with cool, cloudy and potentially wet weather (severe rainfall)
Ridge drawing
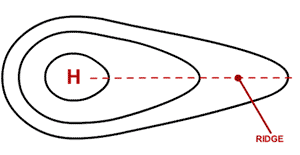
Ridge
An elongated area of high pressure, typically associated with warmer, drier and fair weather and can bring about heat waves