AP HUG Unit 1: Thinking Geographically
1/59
Earn XP
Description and Tags
Name | Mastery | Learn | Test | Matching | Spaced | Call with Kai |
|---|
No analytics yet
Send a link to your students to track their progress
60 Terms
Time-distance decay
Thematic maps
Choropleth maps
Dot distribution maps
Graduated symbol maps
Isoline maps
Topographic maps
Cartogram
Absolute location
Relative location
Absolute distance
Relative distance
Clustered (agglomerated) distribution
Linear distribution
Dispersed distribution
Circular distribution
Geometric distribution
Mercator projection
Peters projection
Conic projection
Robinson projection
Remote sensing
Space
Location
Place
Site
Situation
Sense of place
Time-space compression
Friction of distance
Distance decay
Land use
Built environment
Cultural landscape
Environmental determinism
Possibilism
Geographic/relative scale
Global scale
World regional scale
National scale
National regional scale
Local scale
Formal regions
Functional/Nodal regions
Perceptual/vernacular regions

1. Why is the map projection shown here especially useful for navigation on the surface of the earth?
Distances are correctly portrayed.
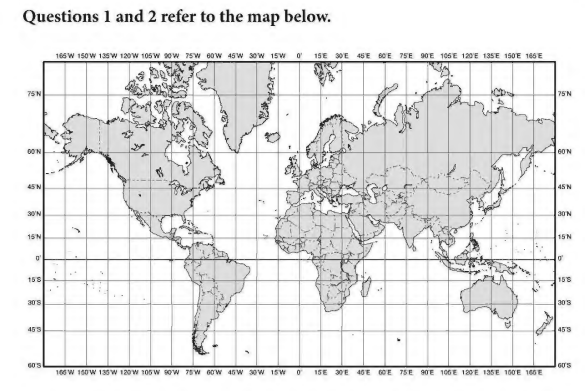
Like the map above, all maps have some kind of distortion. Why?
The earth's surface is curved and a map is flat.
Which phrase refers to the collection of geospatial data through of satellite imagery?
Using remote sensing
Which is the best example of qualitative data used by geographers?
Surveys about how often people visit other places
Question 5 refers to the passage below.
“Smartphones, each one with a tiny GPS pinging, have revolutionized cartography. Matthew Zook, a geographer at the University of Kentucky, has partnered with data scientists there to create what they call the DOLLY Project (Digital OnLine Life and You)-it's a searchable repository of every geotagged tweet since December 2011, meaning Zook and his team have compiled billions of interrelated sentiments, each with a latitude and longitude attached.” -Christian Rudder, "The United States of Reddit" Slate, 2014.
Why are geographers interested in the information in DOLLY?
It provides information about spatial distribution of people's reactions to events

Which statement best describes the absolute location of Paris, France?
49 degrees north, 2 degrees east
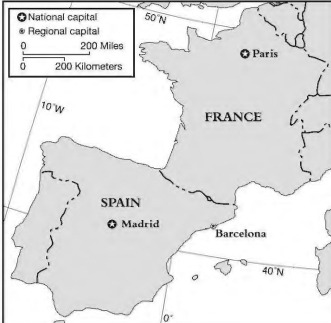
Which statement describes the relative location of Barcelona, Spain?
386 miles west of Madrid and 644 miles south of Paris

Which best explains why the above image is considered part of the built
environment?
It is part of the landscape made by humans.
Which technology had the greatest effect on the application of the
distance-decay function?
A jet because it strengthens the connections between distant places
The way a phenomenon is spread out or arranged over an area is
distribution
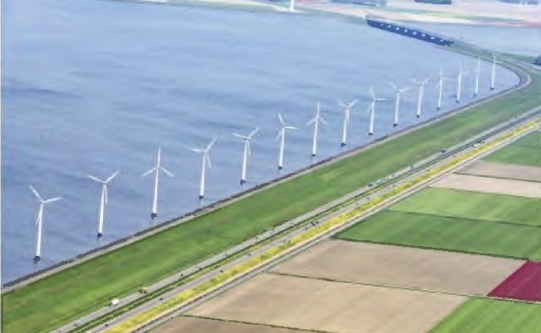
Which renewable resource is best illustrated in the image?
Wind

The use of canal, dykes (dams), pumps, and electricity to protect and reclaim land in the Netherlands best exemplifies which theory?
Possibilism

Using the chart on the previous page, which of the following conclusions is best supported by the data related to the period of 1950-2010?
Of the regions listed, Asia had the largest increase of life expectancy.

Which response best illustrates the scale of analysis being shown in the table on the previous page?
Regional